
Mass spectrometry
Quick Notes
- Mass spectrometry identifies compounds based on mass-to-charge (m/z) values of ions.
- The molecular ion peak (M⁺) gives the relative molecular mass.
- Fragmentation produces smaller ions, which help identify structure.
- Relative atomic mass can be calculated using isotope abundances.
- The [M+1]⁺ peak can estimate the number of carbon atoms in a molecule.
- [M+2]⁺ peaks help detect chlorine (3:1 ratio) or bromine (1:1 ratio) due to their isotopes.
Full Notes
Interpreting Mass Spectra (m/z values and abundances)
Mass spectrometry produces a graph showing peaks for different ions formed when a compound is ionised.
Each peak represents an ion with a specific mass-to-charge (m/z) ratio. The height of the peak shows the relative abundance of that ion.
Most ions have a +1 charge, so m/z is usually equal to the ion’s mass.
For elements the spectrum shows different isotopes.
For molecules, a peak with the highest m/z represents the molecular ion (M⁺).
Calculating Relative Atomic Mass (Ar)
Use this formula:
Ar = (Σ (isotopic mass × % abundance)) / 100
Example Chlorine isotopes
Chlorine has two isotopes which show as two peaks on a mass spectrum, each with different relative abundances:

Cl-35 (75%), Cl-37 (25%)
Ar = (35 × 75 + 37 × 25) / 100 = 35.5
Molecular Ion Peak (M⁺)
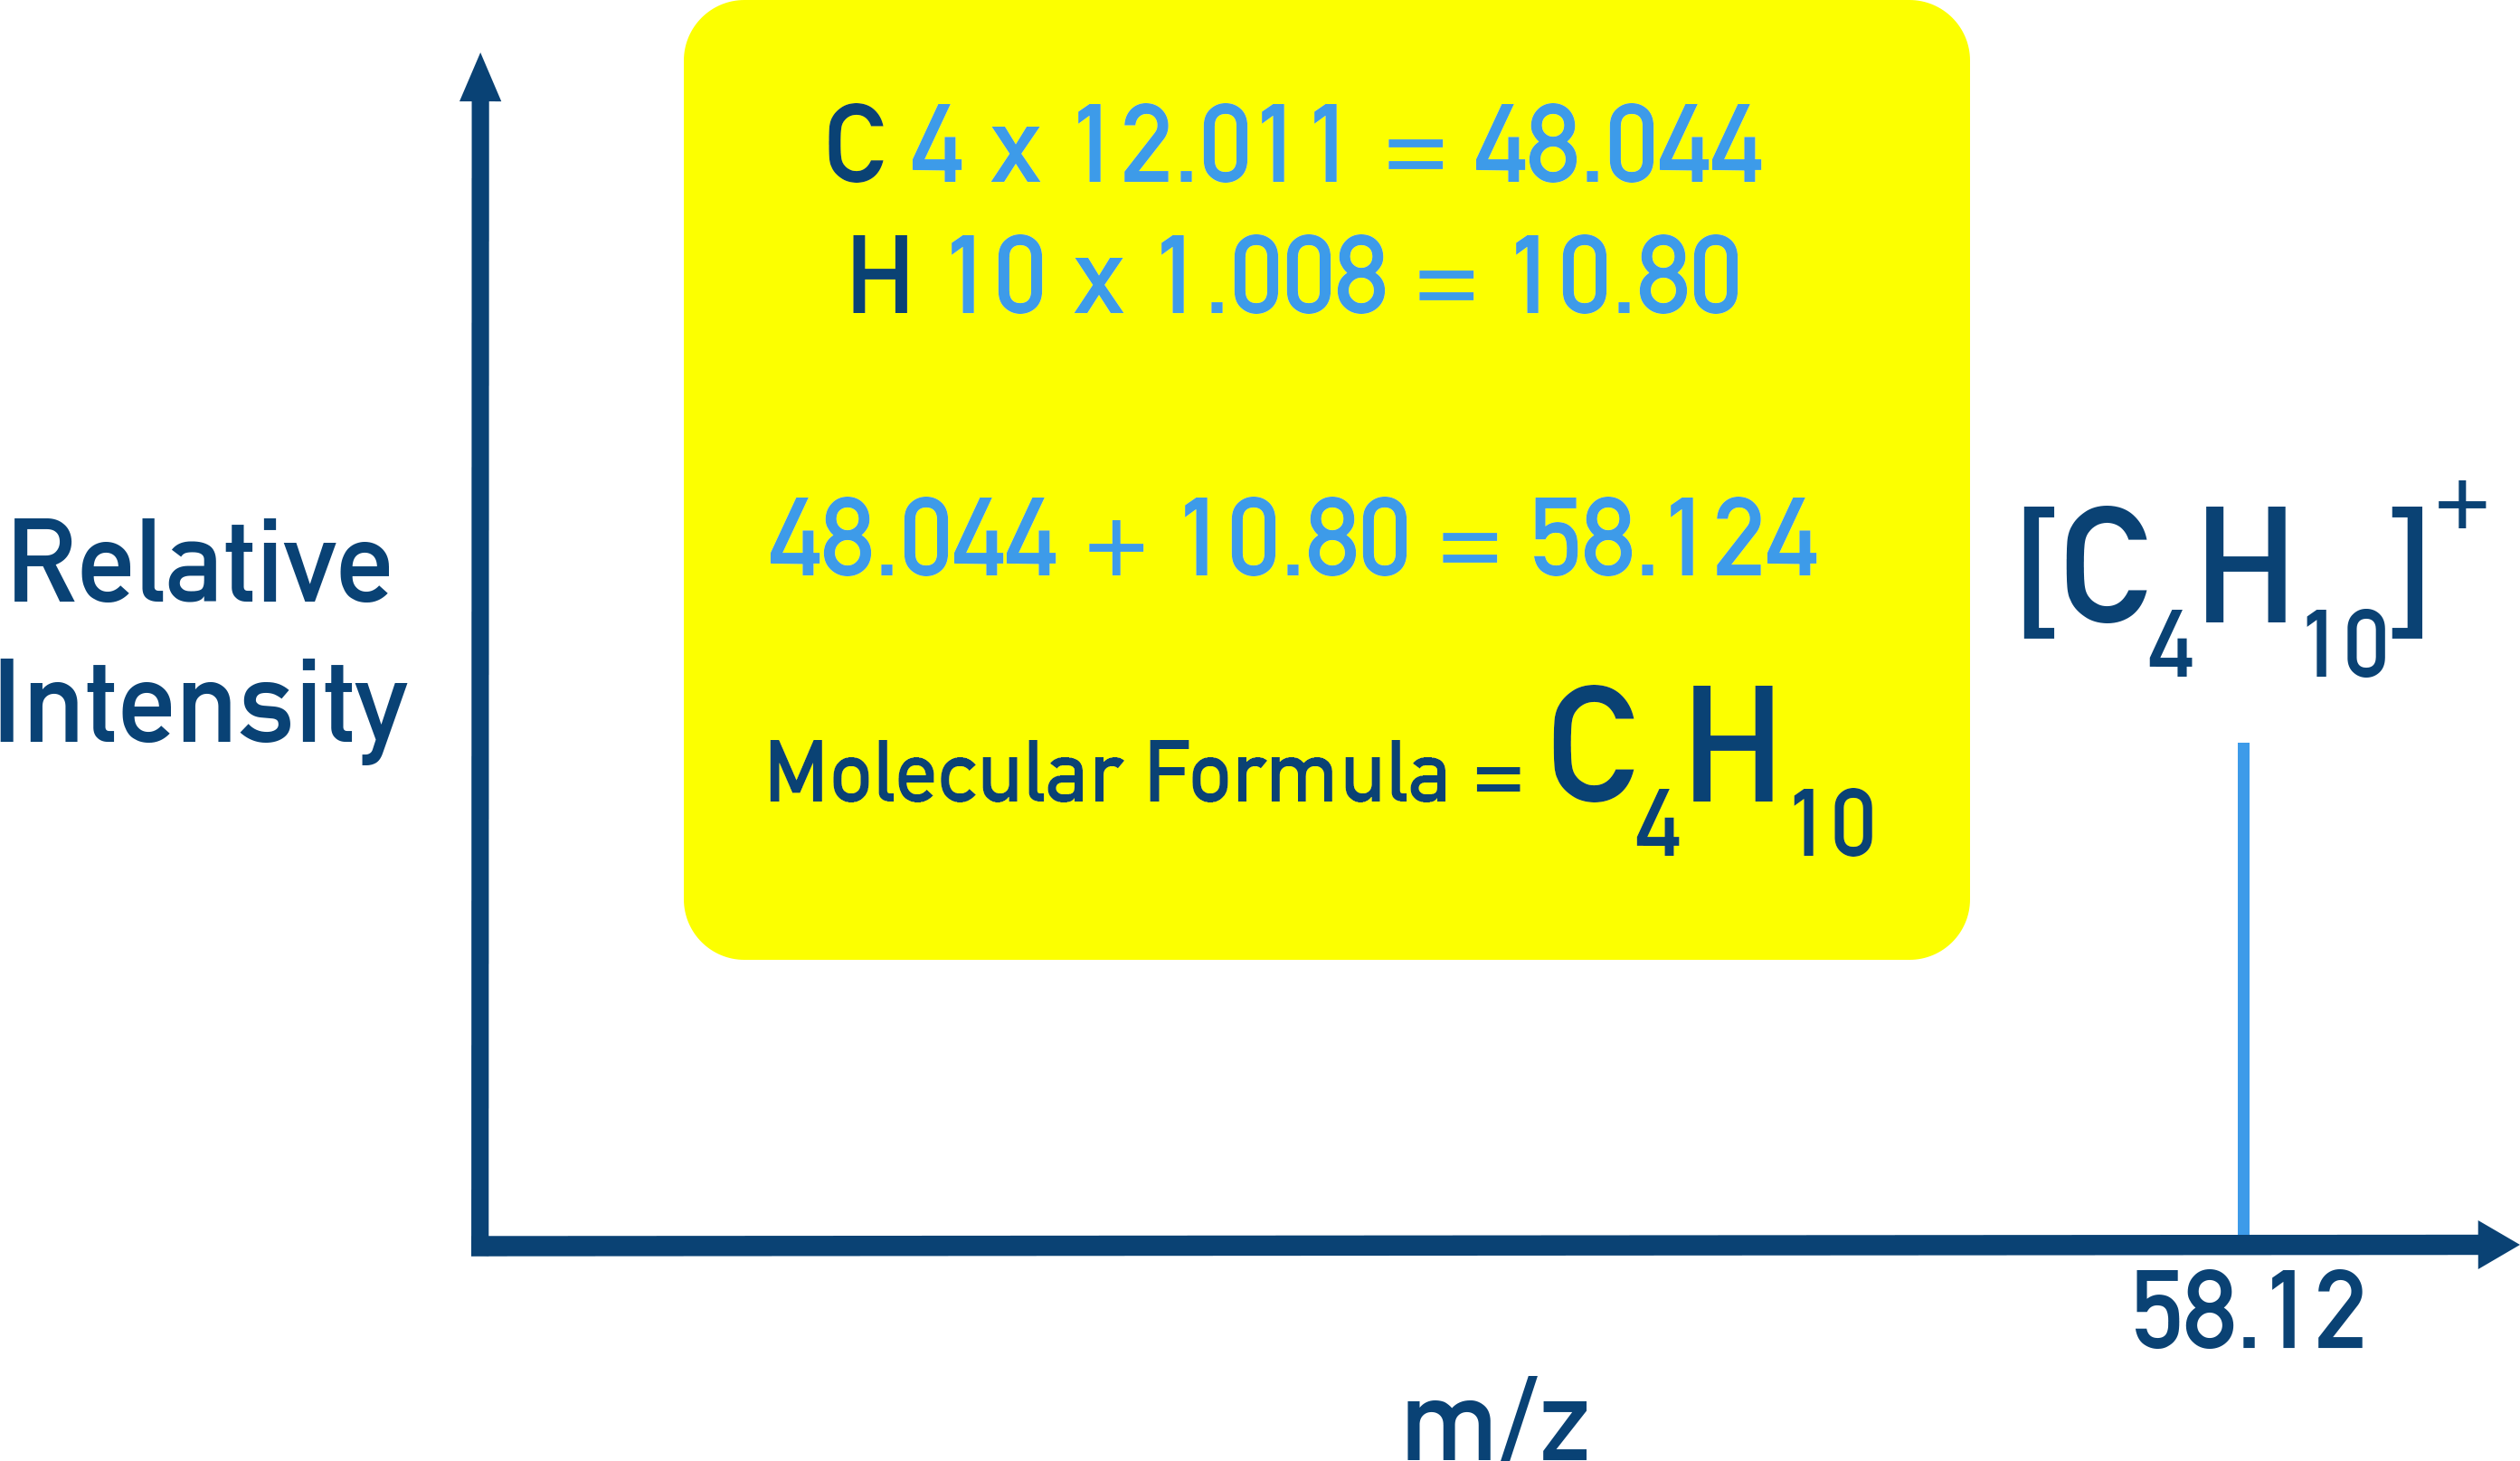
When analysing molecules, the M⁺ peak on a spectrum is the peak with the highest m/z (excluding isotope peaks) and shows the molecular mass of the compound.
We can use the molecular mass of a compound on a spectra to deduce the molecular formula.
Example M⁺ = 58.12
Fragmentation
Inside a mass spectrometer, molecular ions can break into fragments.
Each fragment forms a smaller ion and shows up as a peak at a lower m/z.
These peaks help identify parts of the molecule.
For example, Hydrocarbons A and B both have a molecular formula of C4H10 (same molecular ion peak), however they have different fragment patterns in their spectra, showing different structures,

Fragment peaks at 15 and 43 show a CH3 fragment and C3H7 fragment. However, no fragment at 29 means no C2H5 group. This means the likely possible structure is CH3CH(CH3)CH3

The extra peak at m/z 29 for Hydrocarbon B means it has a C2H5 group in its structure (as well as a CH3 and C3H7 group). This would indicate CH3CH2CH2CH3 as its structure.
Using the [M+1]⁺ Peak
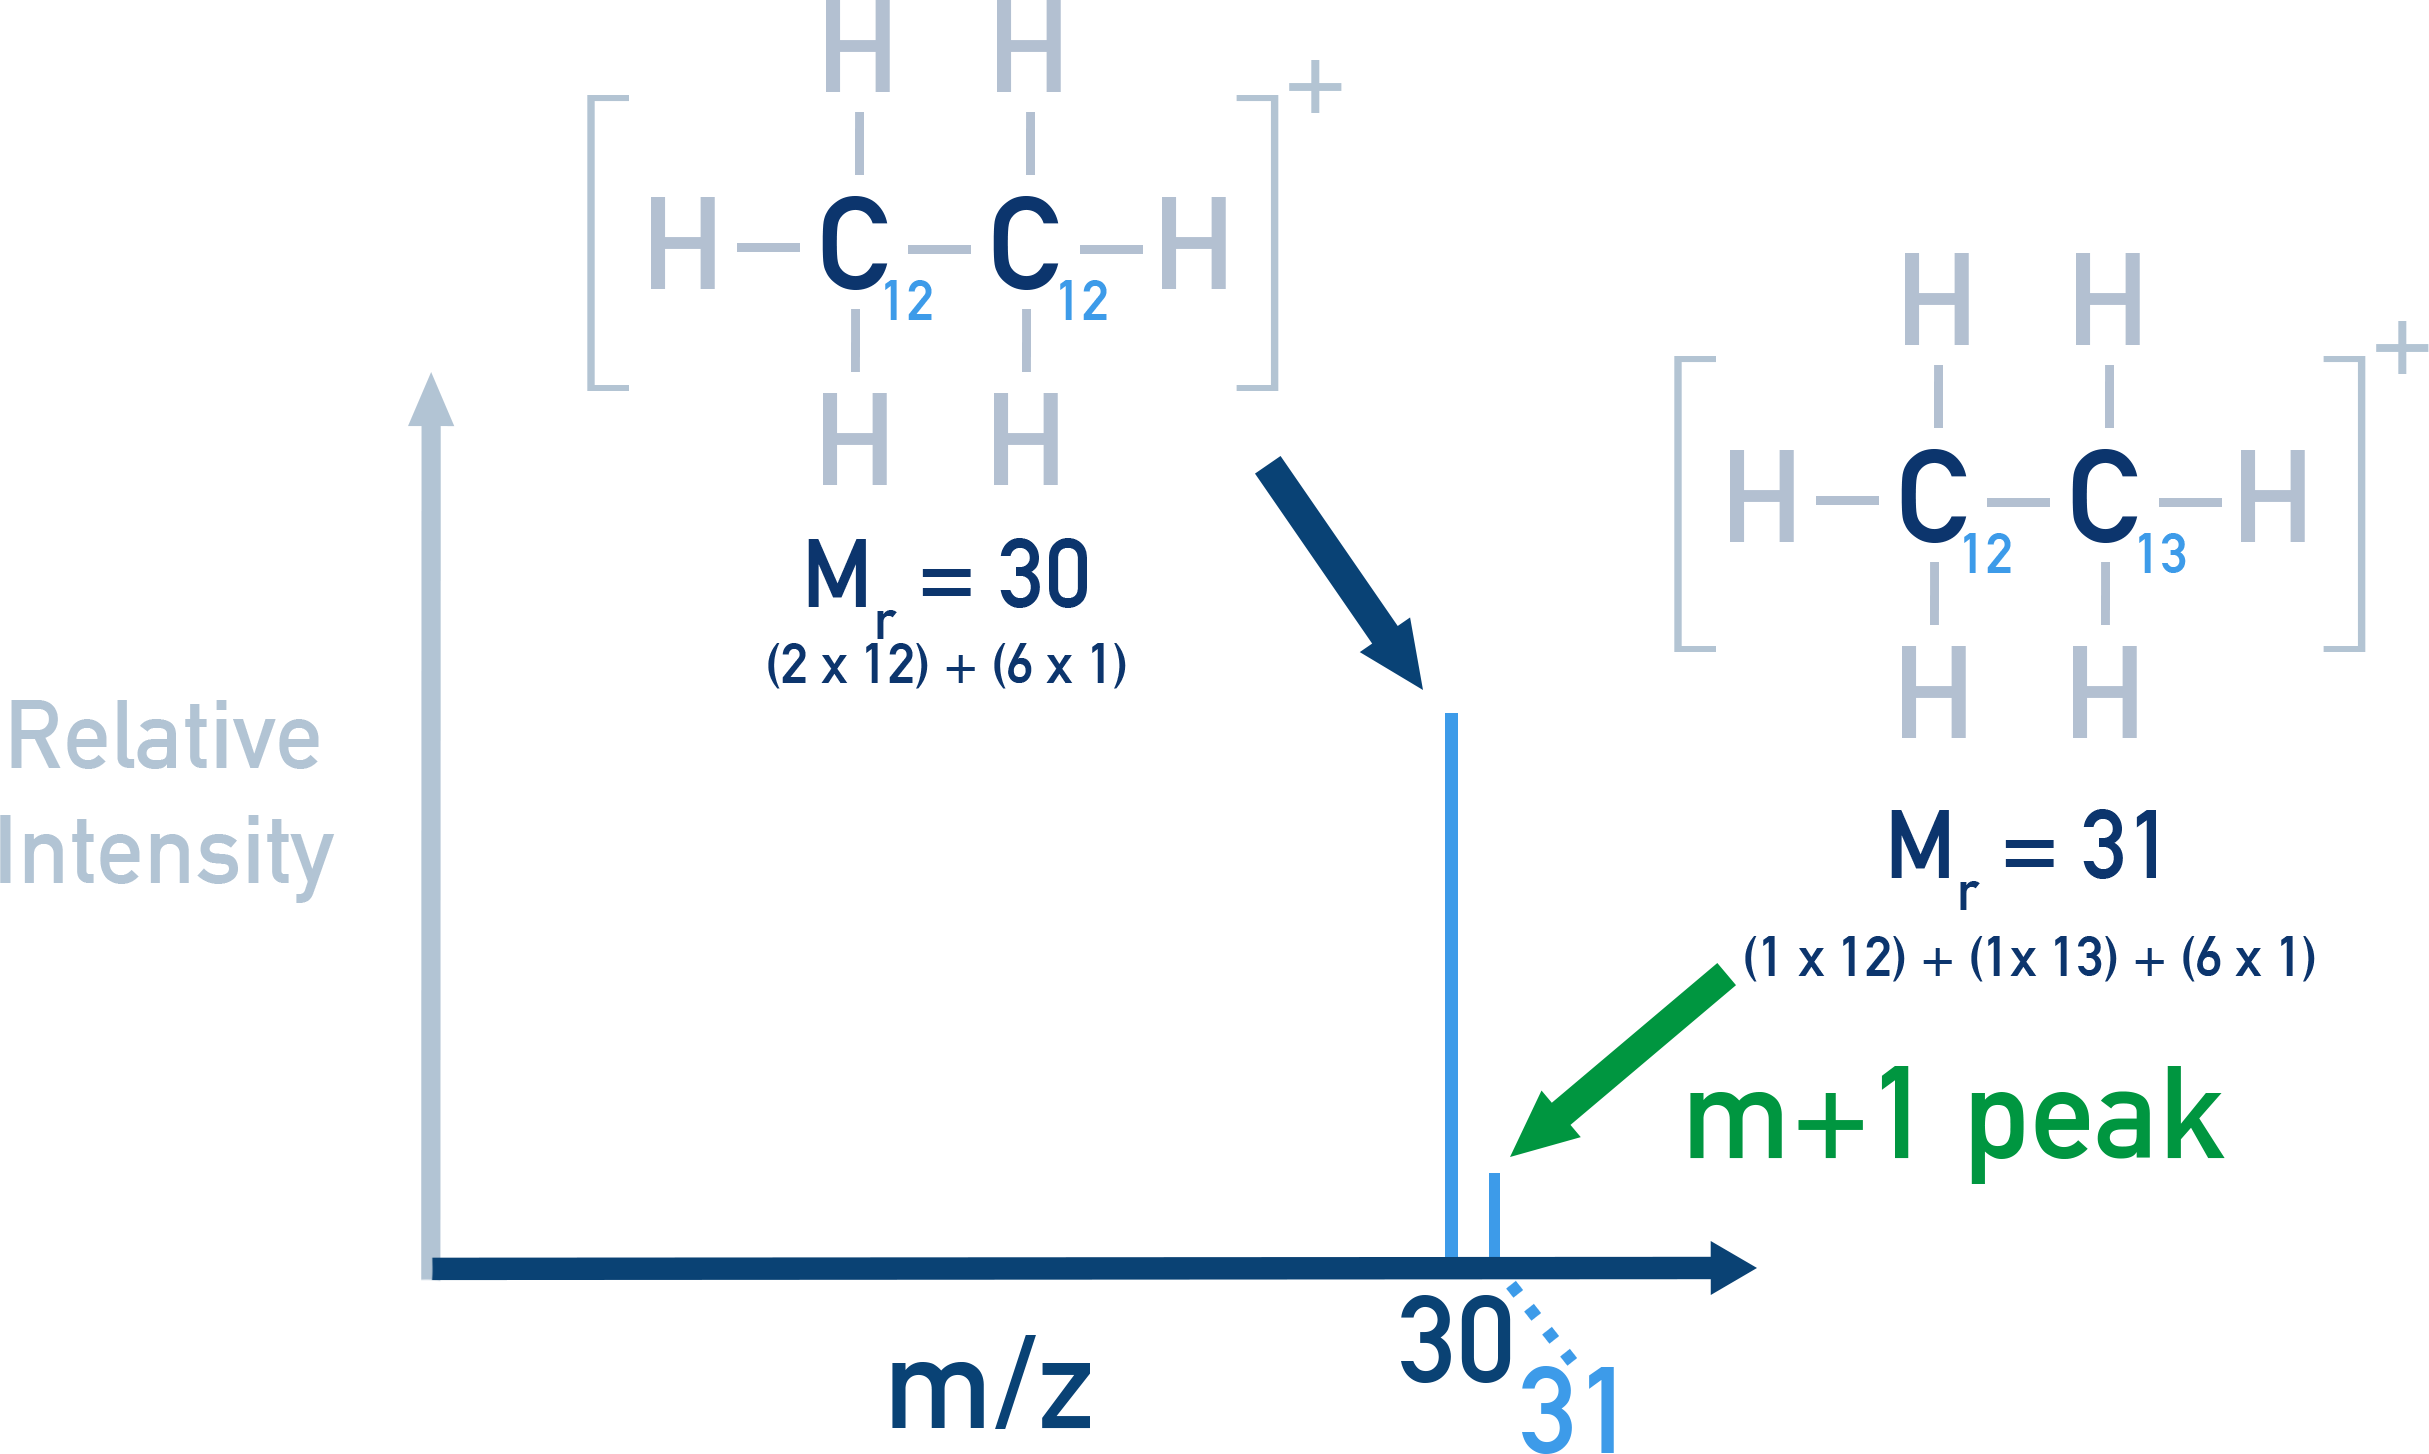
Mass spectra of organic compounds have a small peak 1 greater than the molecular ion peak, it is called the M+1 peak.
The [M+1]⁺ peak arises due to the presence of carbon-13 (¹³C), a naturally occurring isotope of carbon with approximately 1.1% abundance.
Because some molecules in a sample will contain one ¹³C atom instead of ¹²C, these molecules have a relative molecular mass (Mr) that is 1 unit higher, producing the [M+1]⁺ peak in the mass spectrum.
We can estimate the number of carbon atoms in a compound using the formula:
Number of C atoms = (100 × [M+1]⁺ abundance) / (1.1 × M⁺ abundance)
Identifying Cl and Br from [M+2]⁺ Peaks
Organic compounds that contain chlorine or bromine will have an M+2 peak.
This is because chlorine and bromine both have isotopes that differ by a mass number of 2 (Cl-35 and Cl-37 and Br-79 and Br-81).
For example, the mass spectra for chloromethane shows an M+2 peak.
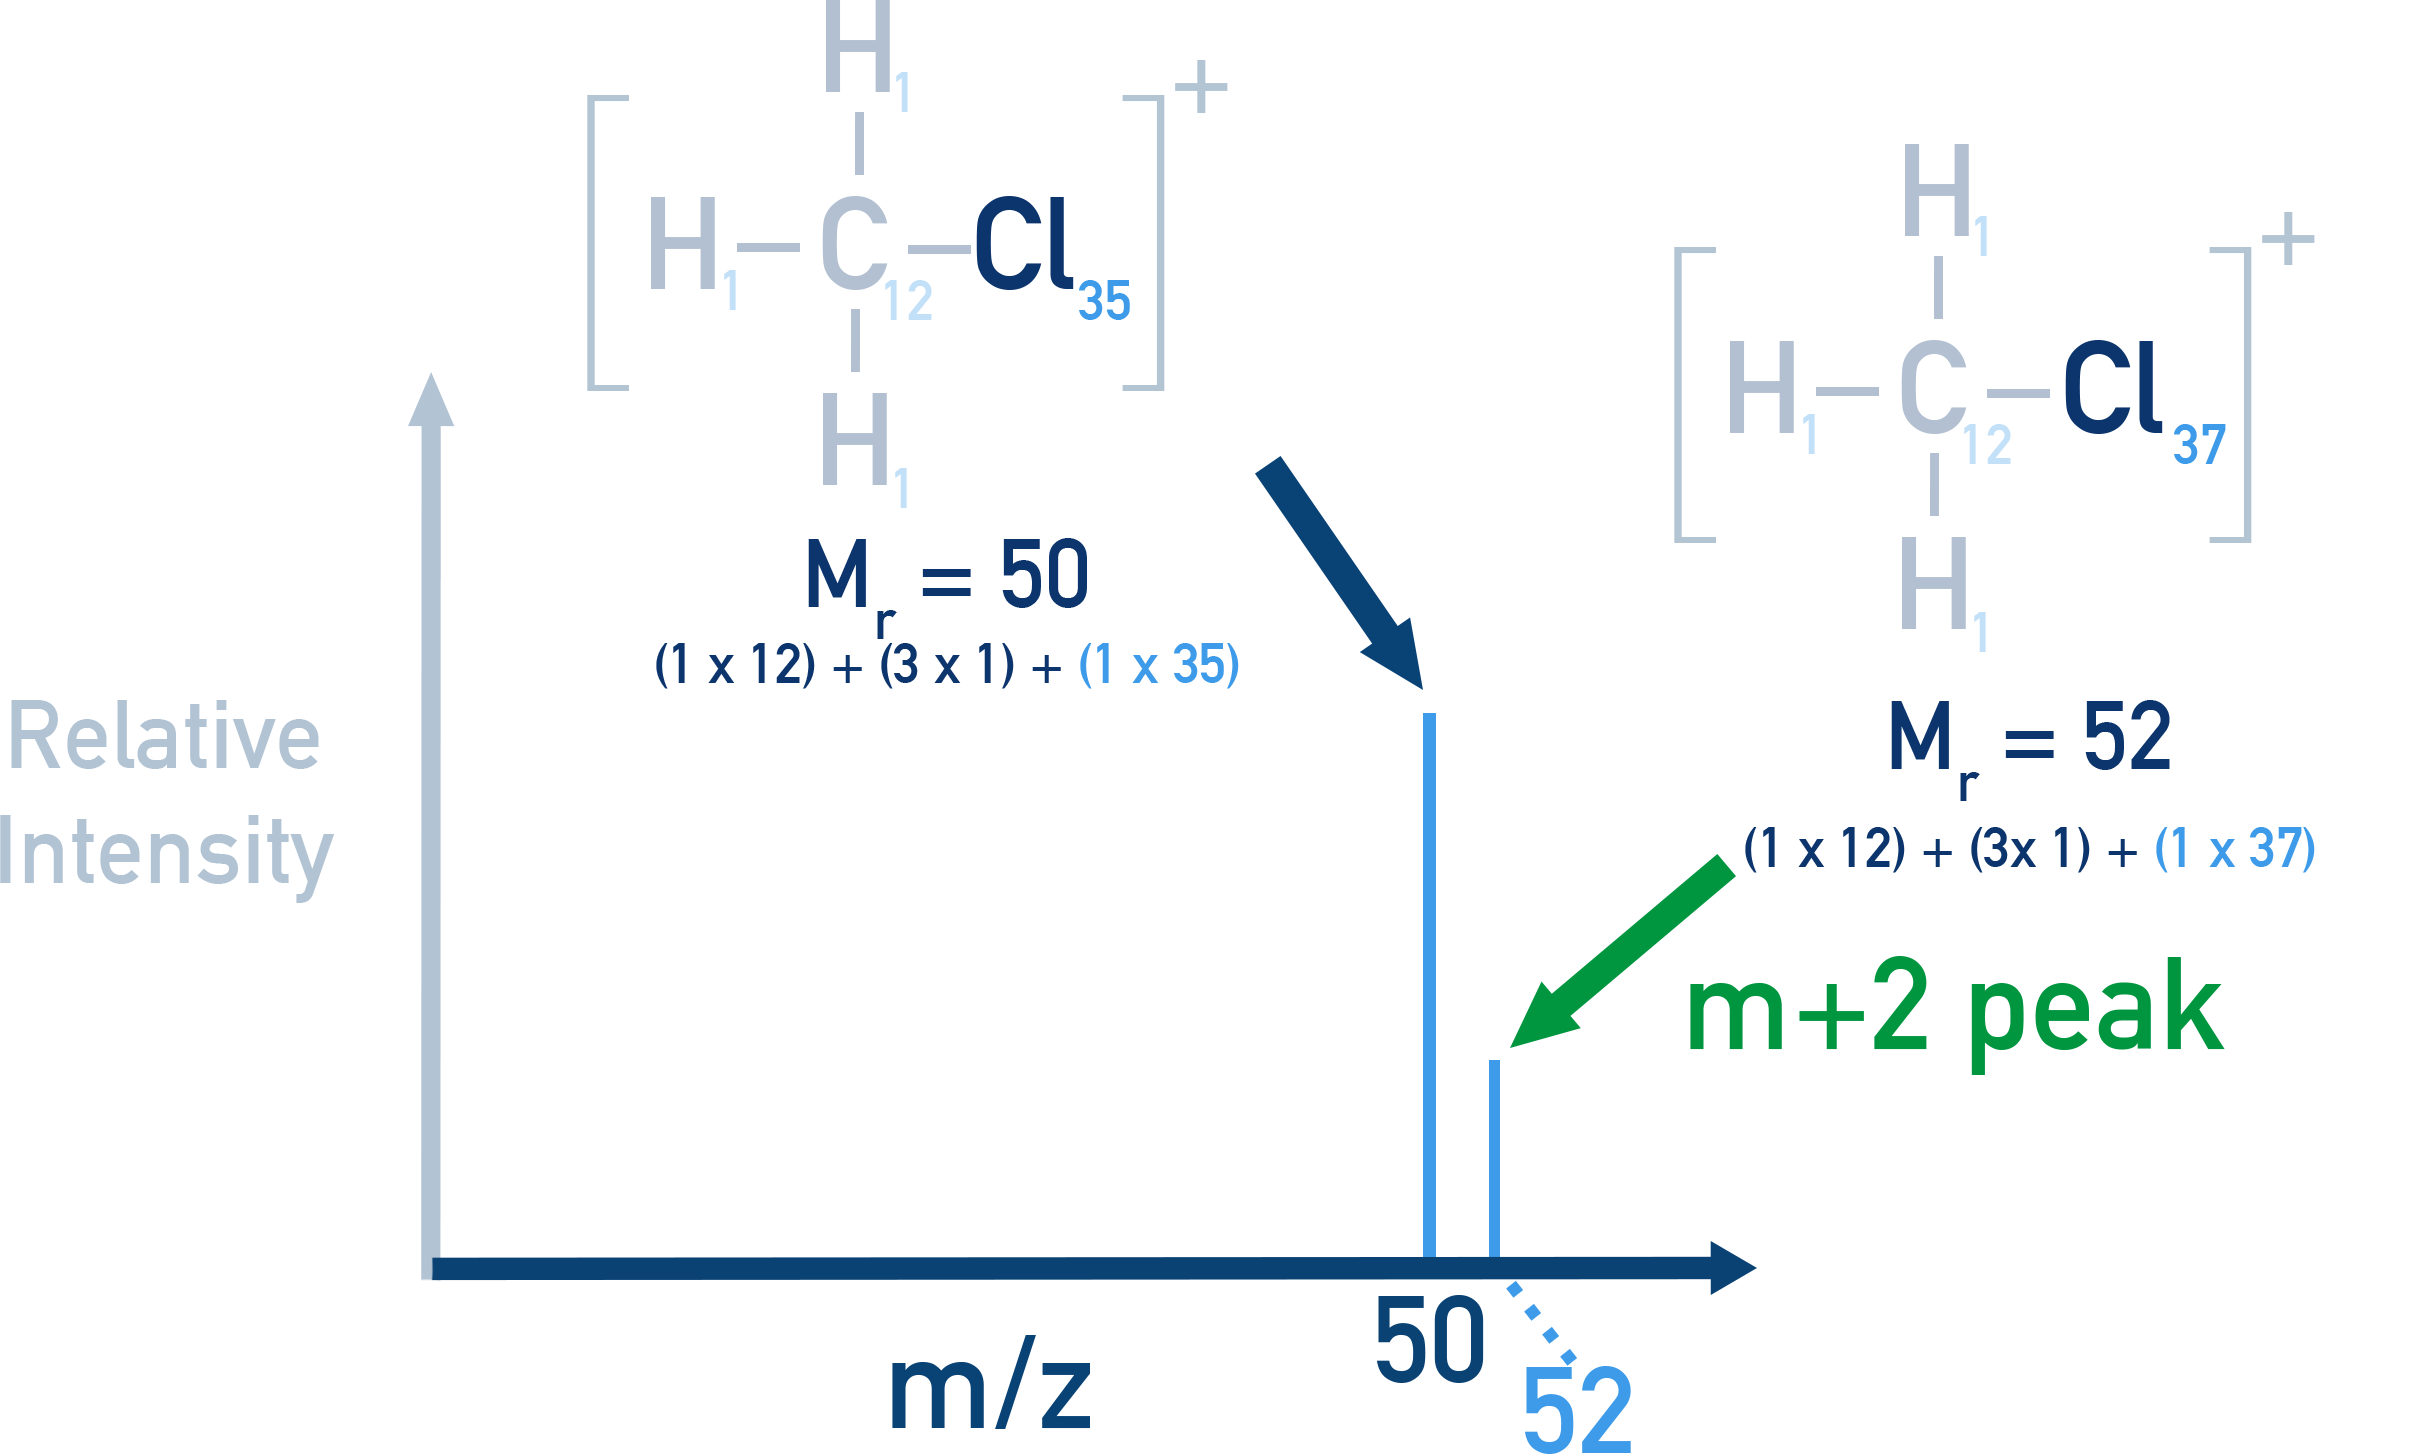 The main molecular ion peak is at 50 (contains the Cl-35 isotope) and 52 (contains the Cl-37 isotope).
The [M+2]⁺ peak helps detect chlorine and bromine.
For chlorine, the ratio of ³⁵Cl to ³⁷Cl is 3:1
if Cl is present in the compound, M⁺ and M+2⁺ peaks appear in a 3:1 ratio.
For bromine, The ratio of ⁷⁹Br to ⁸¹Br is 1:1
M⁺ and M+2⁺ peaks appear with equal height.
This helps confirm if Cl or Br is in the compound.
Summary
- Fragmentation patterns help distinguish isomers with the same molecular ion peak.
- The [M+1]⁺ peak arises from ¹³C isotopes and is used to estimate number of carbon atoms.
- The [M+2]⁺ peak identifies halogens: chlorine (3:1 ratio) and bromine (1:1 ratio).