
Infrared Spectroscopy
Quick Notes
- Bonds in molecules absorb infrared (IR) radiation at characteristic wavenumbers.
- Infrared spectra can identify functional groups in a molecule based on their absorption patterns.
- The ‘fingerprint region’ (below 1500 cm−1) allows identification of a specific molecule.
Full Notes
IR spectroscopy and how it works has been outlined in more detail here
This page is just what you need to know for CIE A-level Chemistry :)
How Infrared Spectroscopy Works
IR radiation is passed through a sample.
Bonds in the sample can vibrate in specific ways, absorbing IR radiation at characteristic wavenumbers (measured in cm−1).
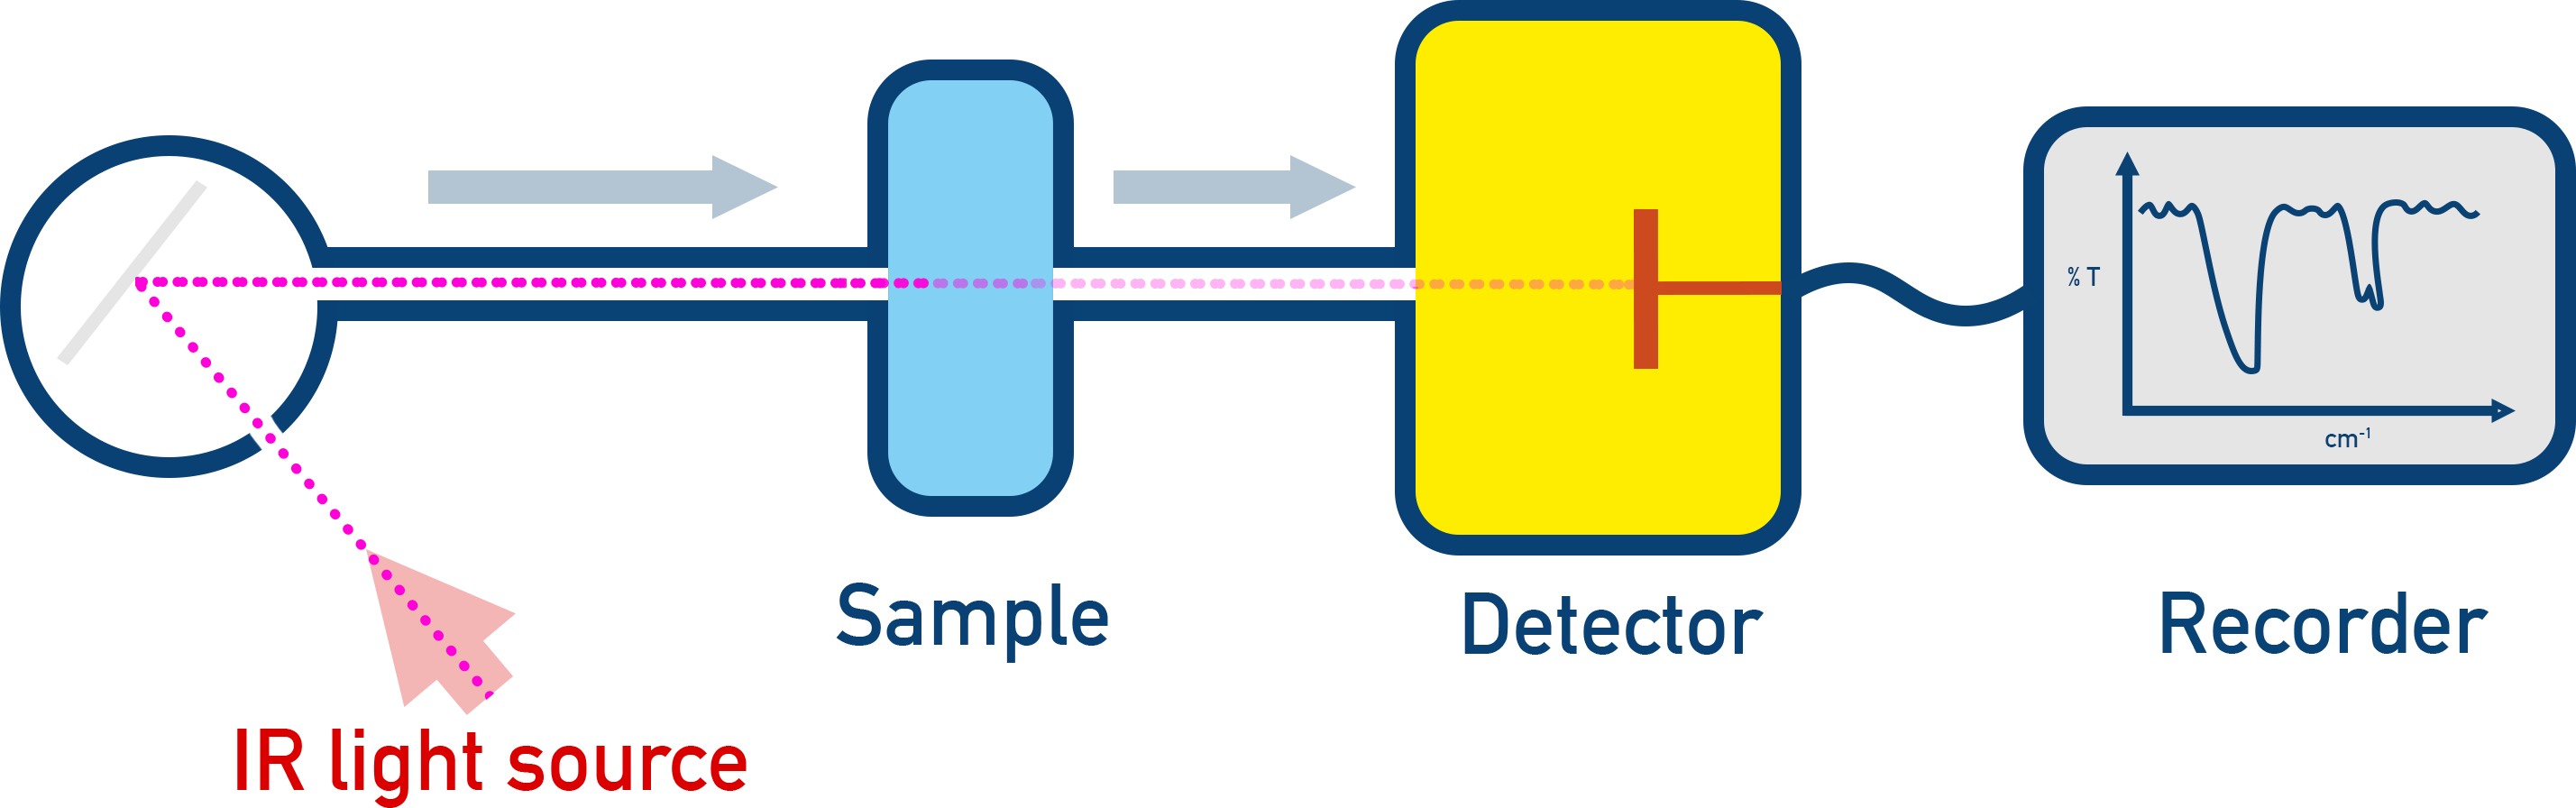
An infrared spectrum is produced, showing absorption peaks.

Identifying Functional Groups Using IR Spectroscopy
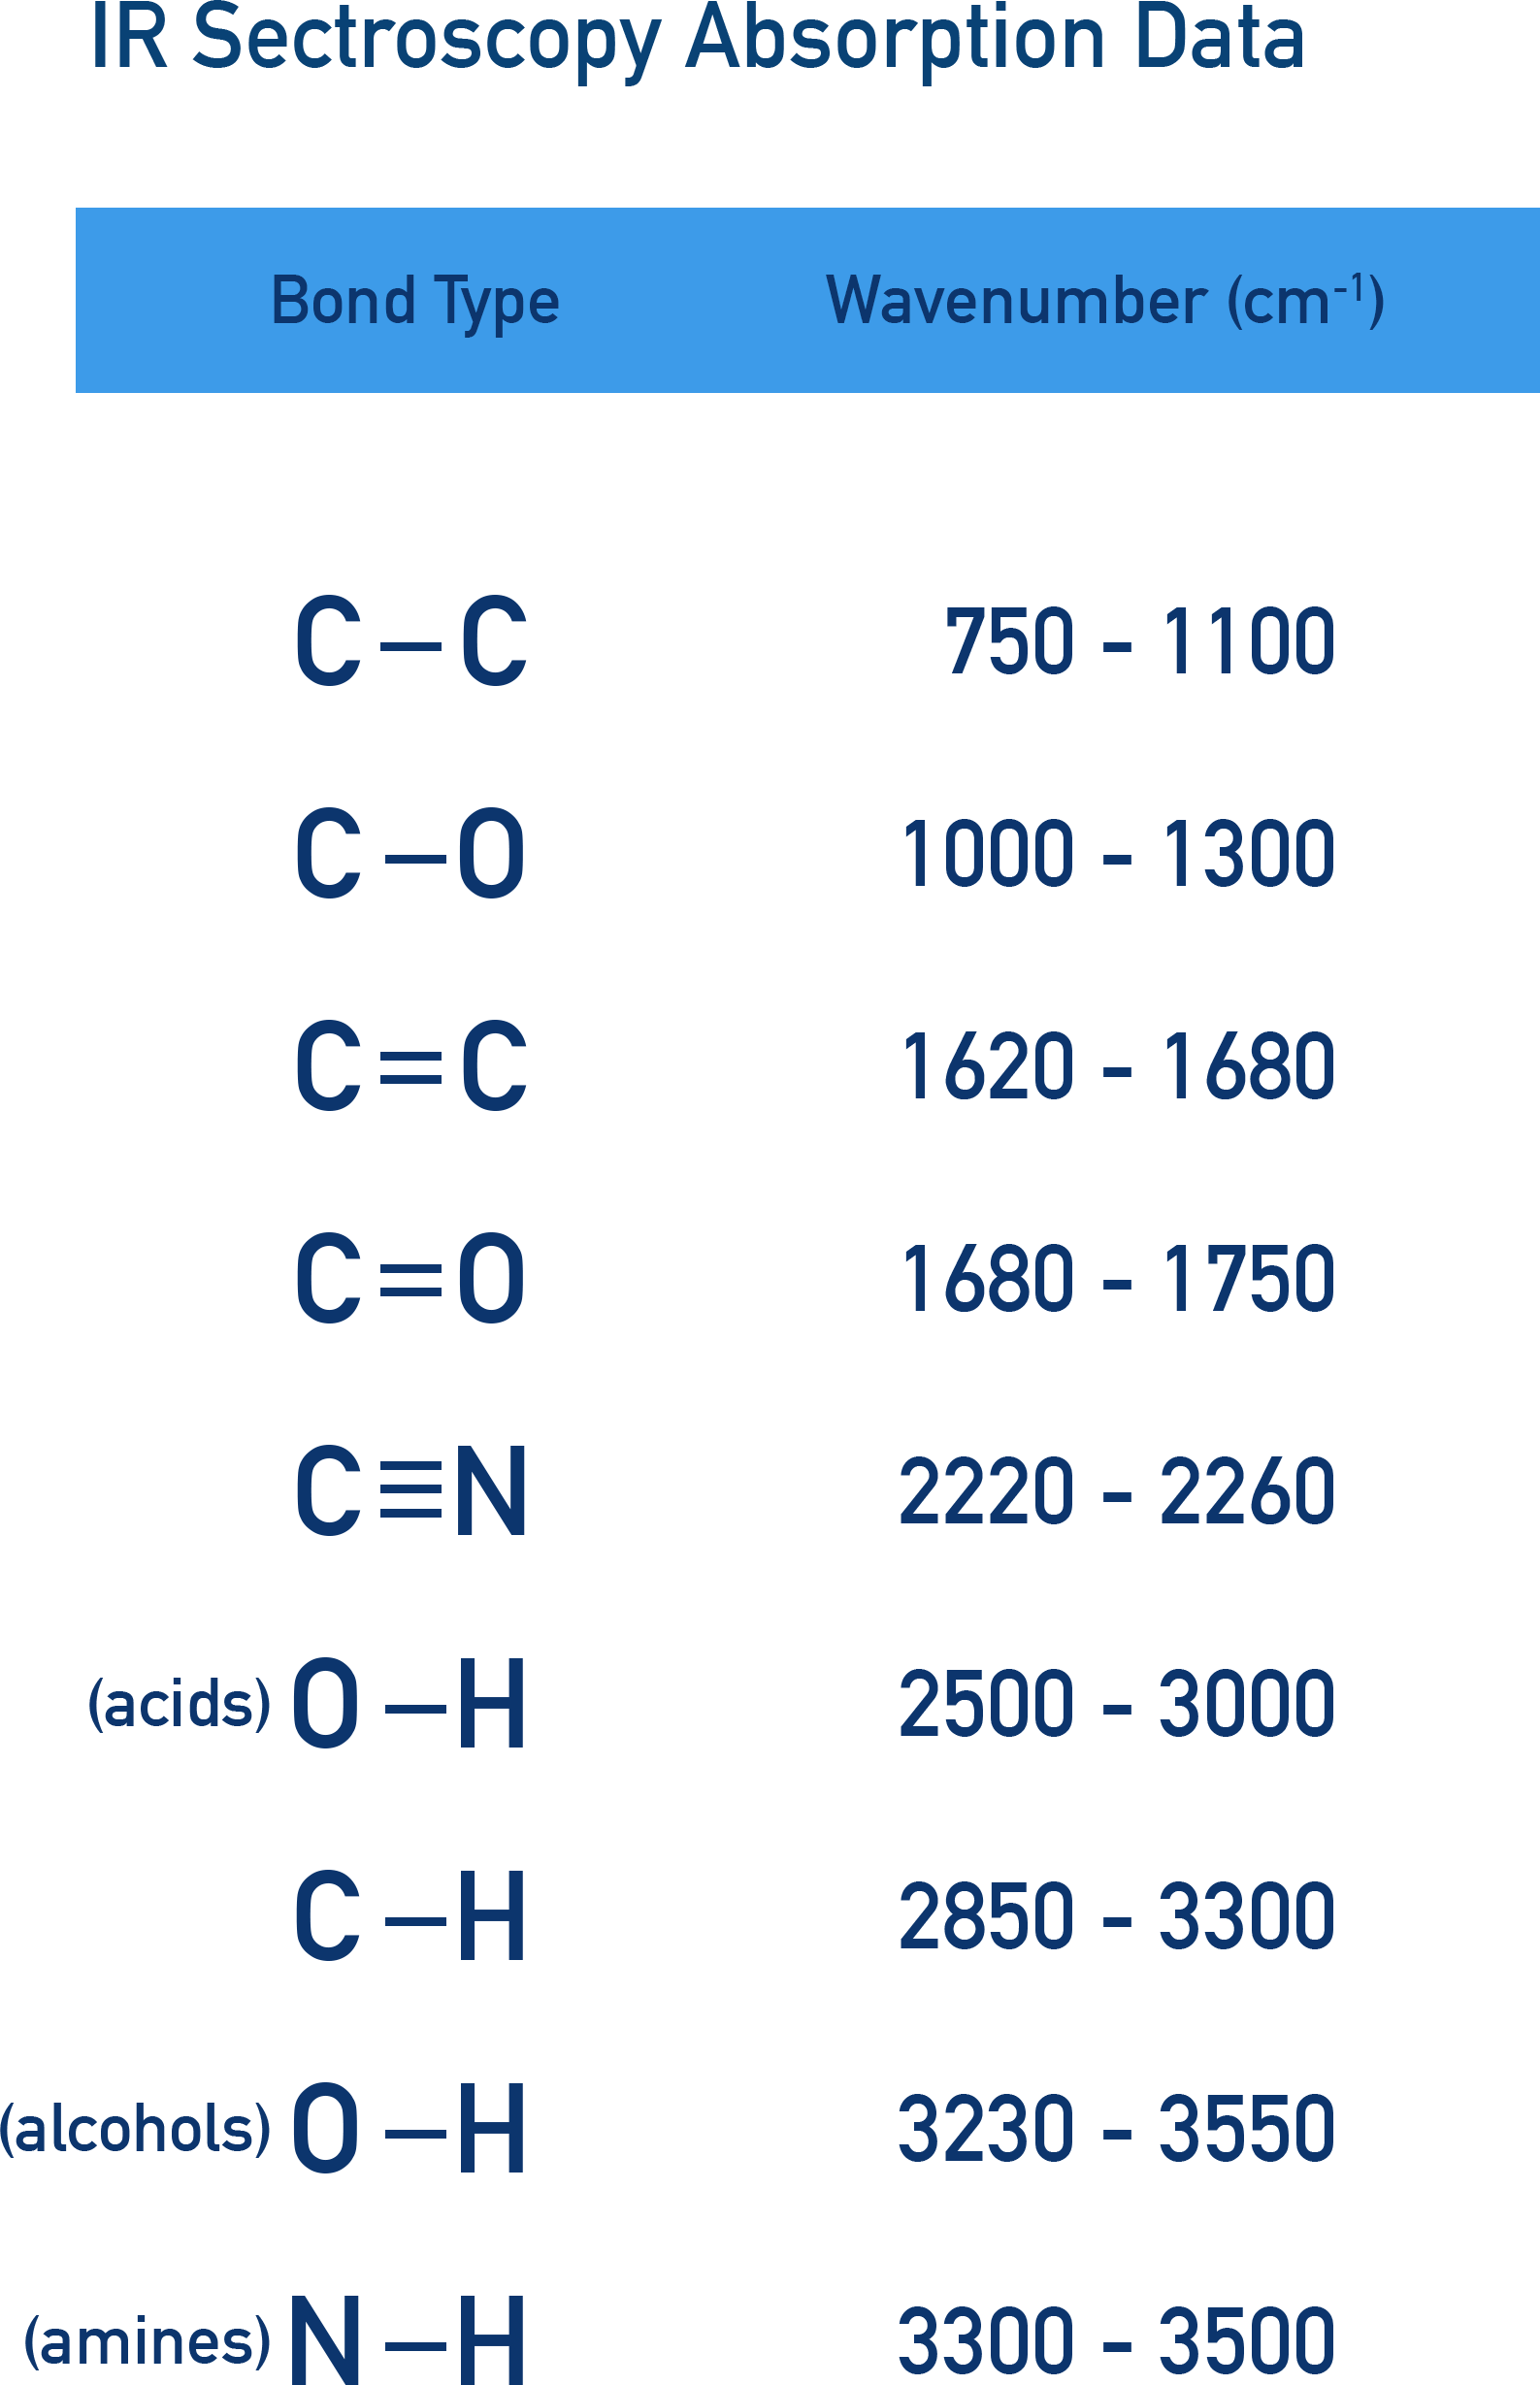
Different functional groups absorb IR radiation at specific wavenumbers.
Peaks in IR spectra correspond to bond vibrations in a molecule.
By comparing absorbances in an IR spectra to know data book values, we can determine bond types (and functional groups) in the molecule.
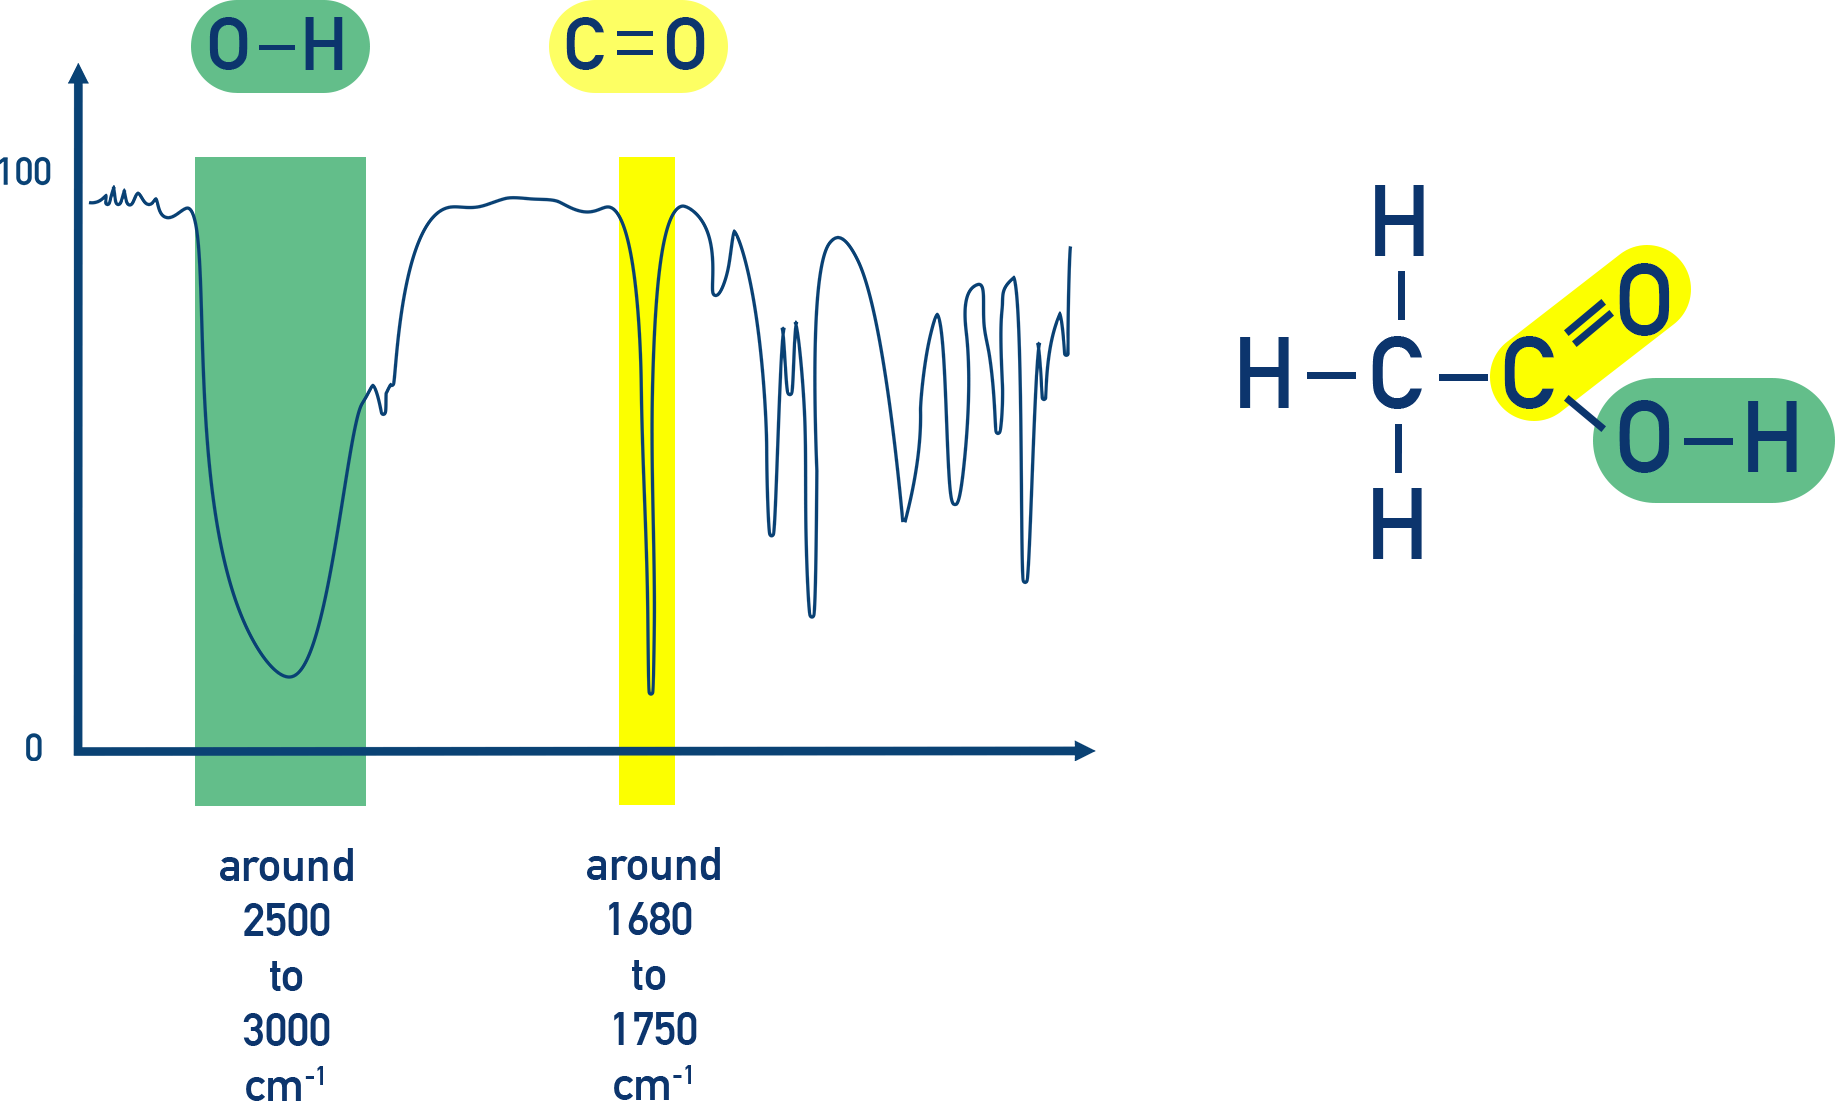
For Example: Ethanoic acid (CH3COOH) has two absorbances in its IR spectra that helps identify if. One for the O–H bond (2500 to 3000) and one for the C=O bond (1680 to 1750).
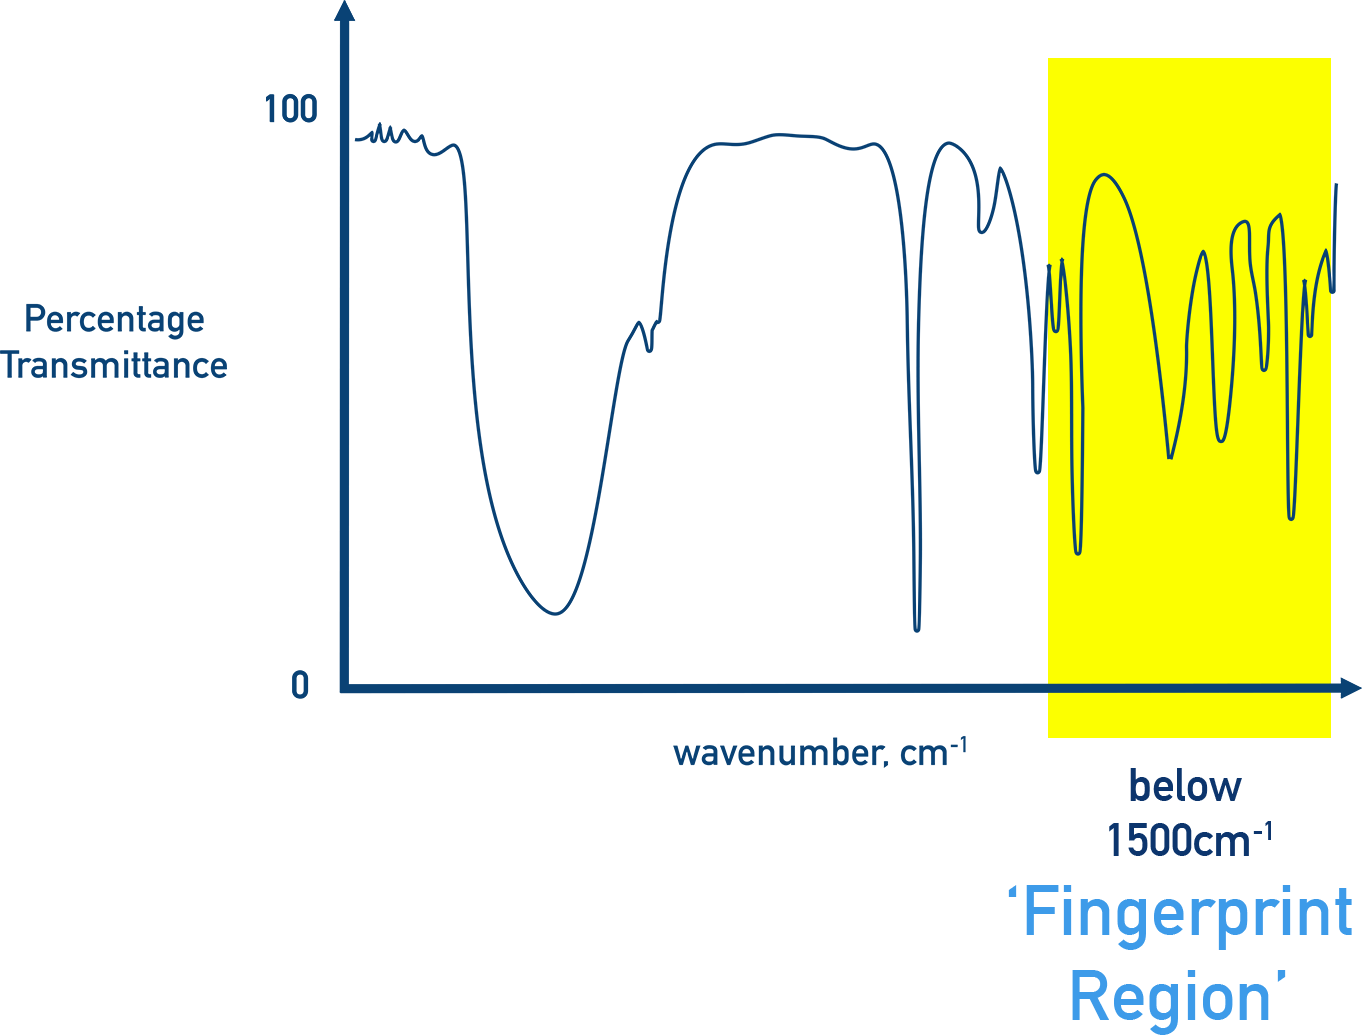
The ‘Fingerprint Region’ (Below 1500 cm−1)
The region below approximately 1500cm-1 on an IR spectra is unique to each molecule and is called the 'fingerprint region'.
As it is very complicated and associated with molecular vibrations (rather than just individual bonds) it is rarely studied in detail however can be used to identify a compound.
A sample's spectra is compared to to a database spectra for a given molecule to enable identification.
Summary
- IR spectroscopy measures absorption of IR by vibrating bonds at characteristic wavenumbers.
- Characteristic peaks reveal functional groups; the fingerprint region below 1500 cm−1 confirms a specific molecule.
- Interpreting key absorptions (e.g., broad O–H, sharp C=O) allows identification of functional groups such as alcohols, acids and carbonyls.