
Proton 1H-NMR Spectroscopy
Quick Notes
- 1H NMR shows the environments of hydrogen atoms in a molecule and gives information about neighbouring groups.
- Each peak = a different proton (¹H) environment.
- Chemical shift (δ, ppm) tells us the type of environment.
- Integration (peak area) = relative number of protons in each environment.
- Splitting pattern (multiplets) = number of adjacent non-equivalent protons using the n + 1 rule.
- TMS is used as a reference (δ = 0 ppm).
- Deuterated solvents (e.g. CDCl3) are used to avoid interfering peaks.
- O–H and N–H protons can be identified by proton exchange with D2O.
Full Notes
The background theory of carbon and hydrogen NMR has been outlined in more detail
here.
This page is just what you need to know for CIE A-level Chemistry :)
¹H NMR (proton nuclear magnetic resonance) is a powerful technique that provides detailed information about the hydrogen atoms (protons) in an organic molecule. Graphs (spectra) are produced that are analysed
The spectra can tells us:
- How many different hydrogen (proton) environments there are.
- The ratio of hydrogens in each environment.
- How the hydrogens are arranged relative to one another.
Key Features of a ¹H NMR Spectrum
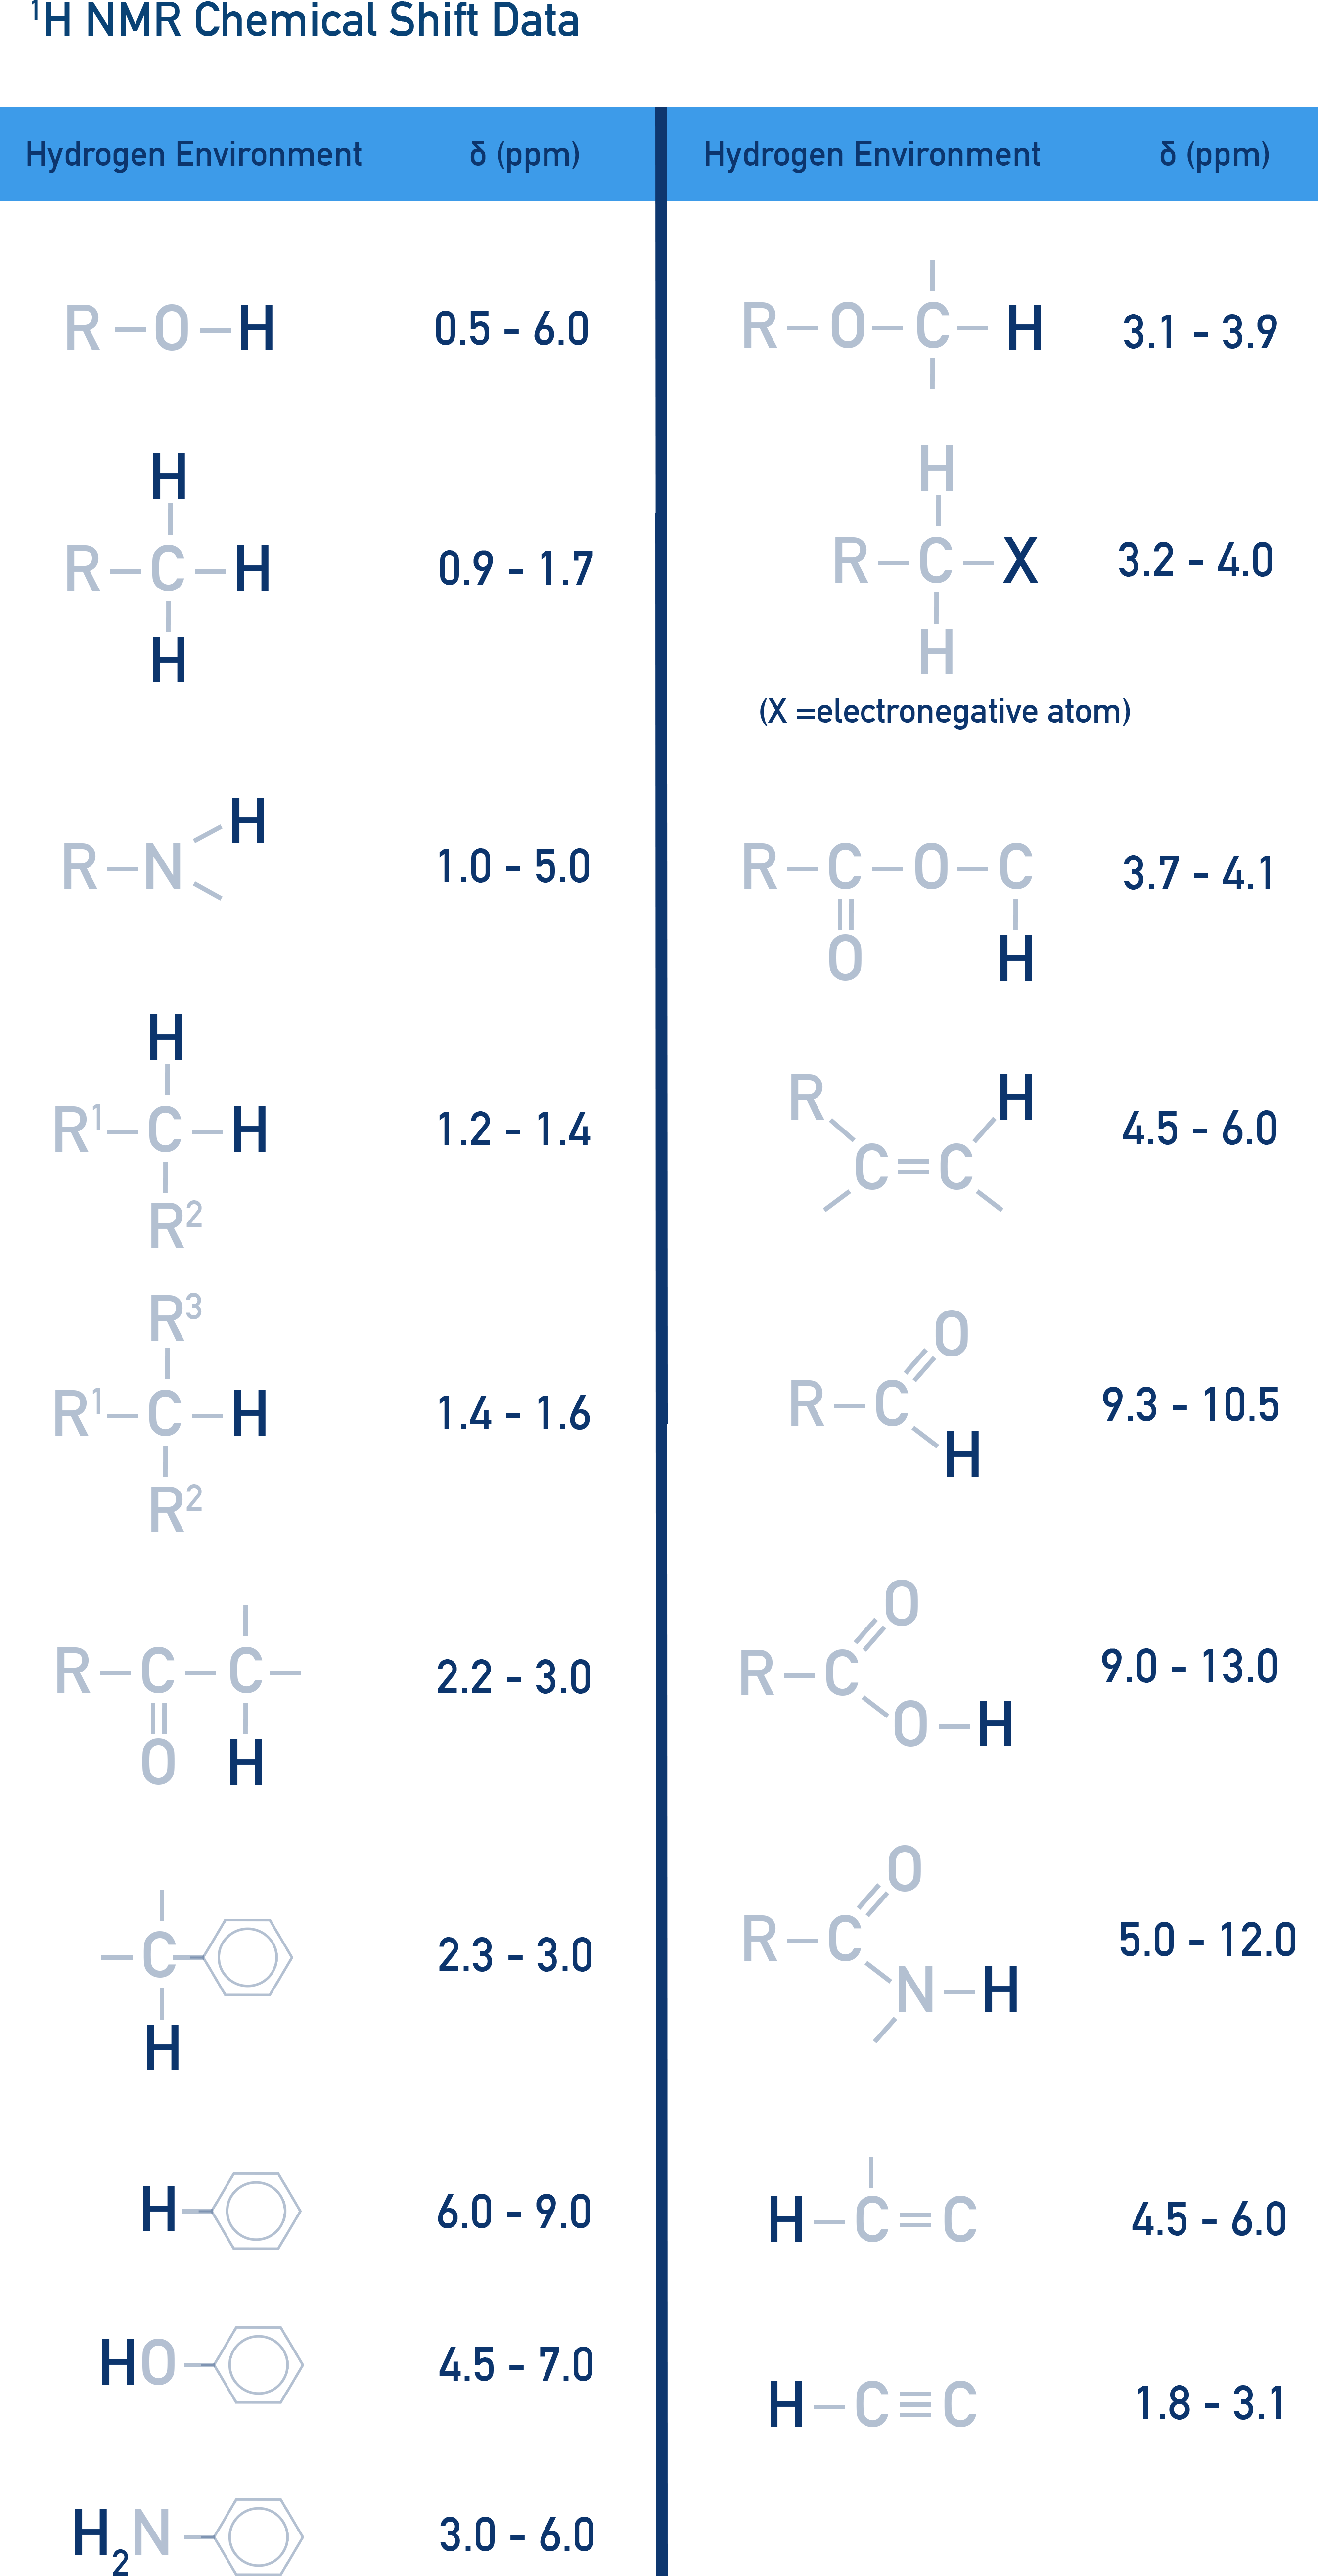
Chemical Shift (δ, ppm)
Each type of proton appears at a specific chemical shift depending on its chemical environment.
Generally, more electronegative groups shift peaks downfield (higher δ values).
Data book values are used to compare peaks to identify possible bonding groups within a sample.
Relative Peak Area (Integration)
Integration patterns (peak area) show the ratio of protons in each unique environment.
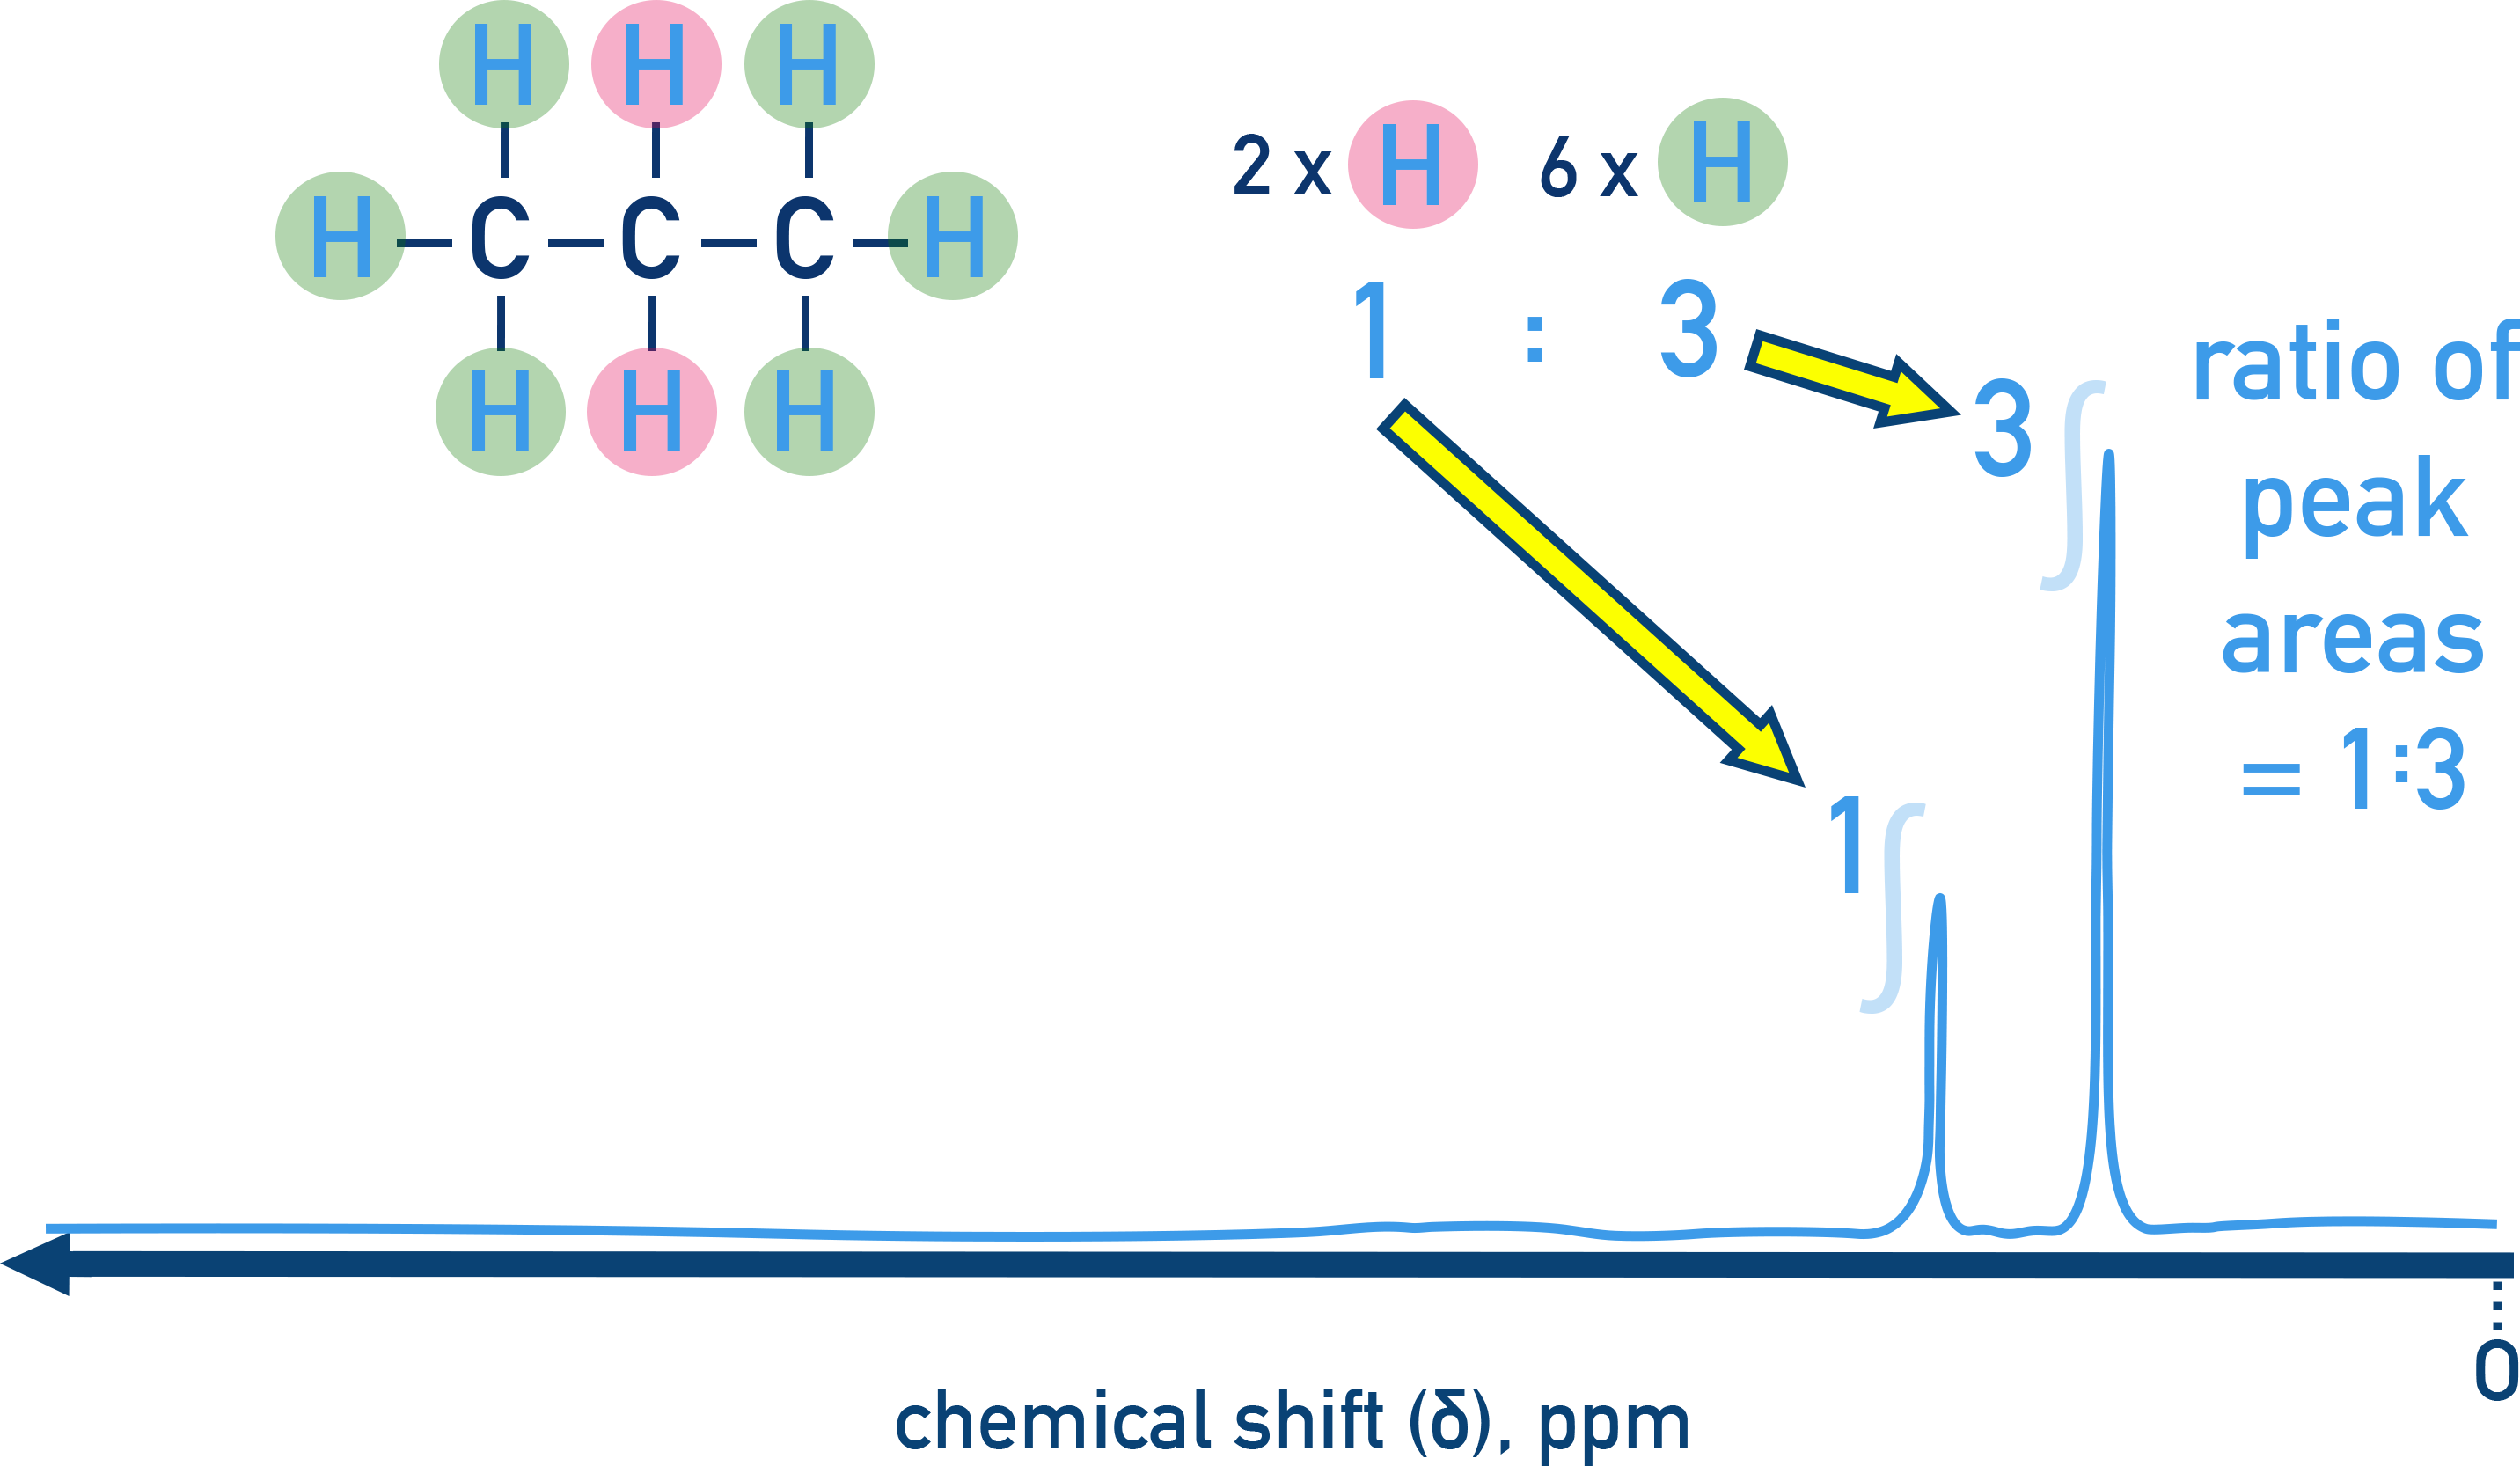

Be really careful, integration ratios aren’t necessarily the actual number of protons in each environment — just the ratio. For example, propane has 2Hs in one environment and 6Hs in another. The integration ratio is 1:3. With a molecular formula of C3H8, that ratio corresponds to 2H and 6H.
Spin-Spin Coupling and the n+1 Rule
Hydrogens bonded to adjacent, non-equivalent carbon atoms can cause a peak to be split.
The number of hydrogens bonded to adjacent, non-equivalent carbons determines how many times the peak is split. This is summarised by the n + 1 rule.
Where n is the number of protons bonded to adjacent, non-equivalent carbon atoms and n+1 is the number of times a peak will be split.
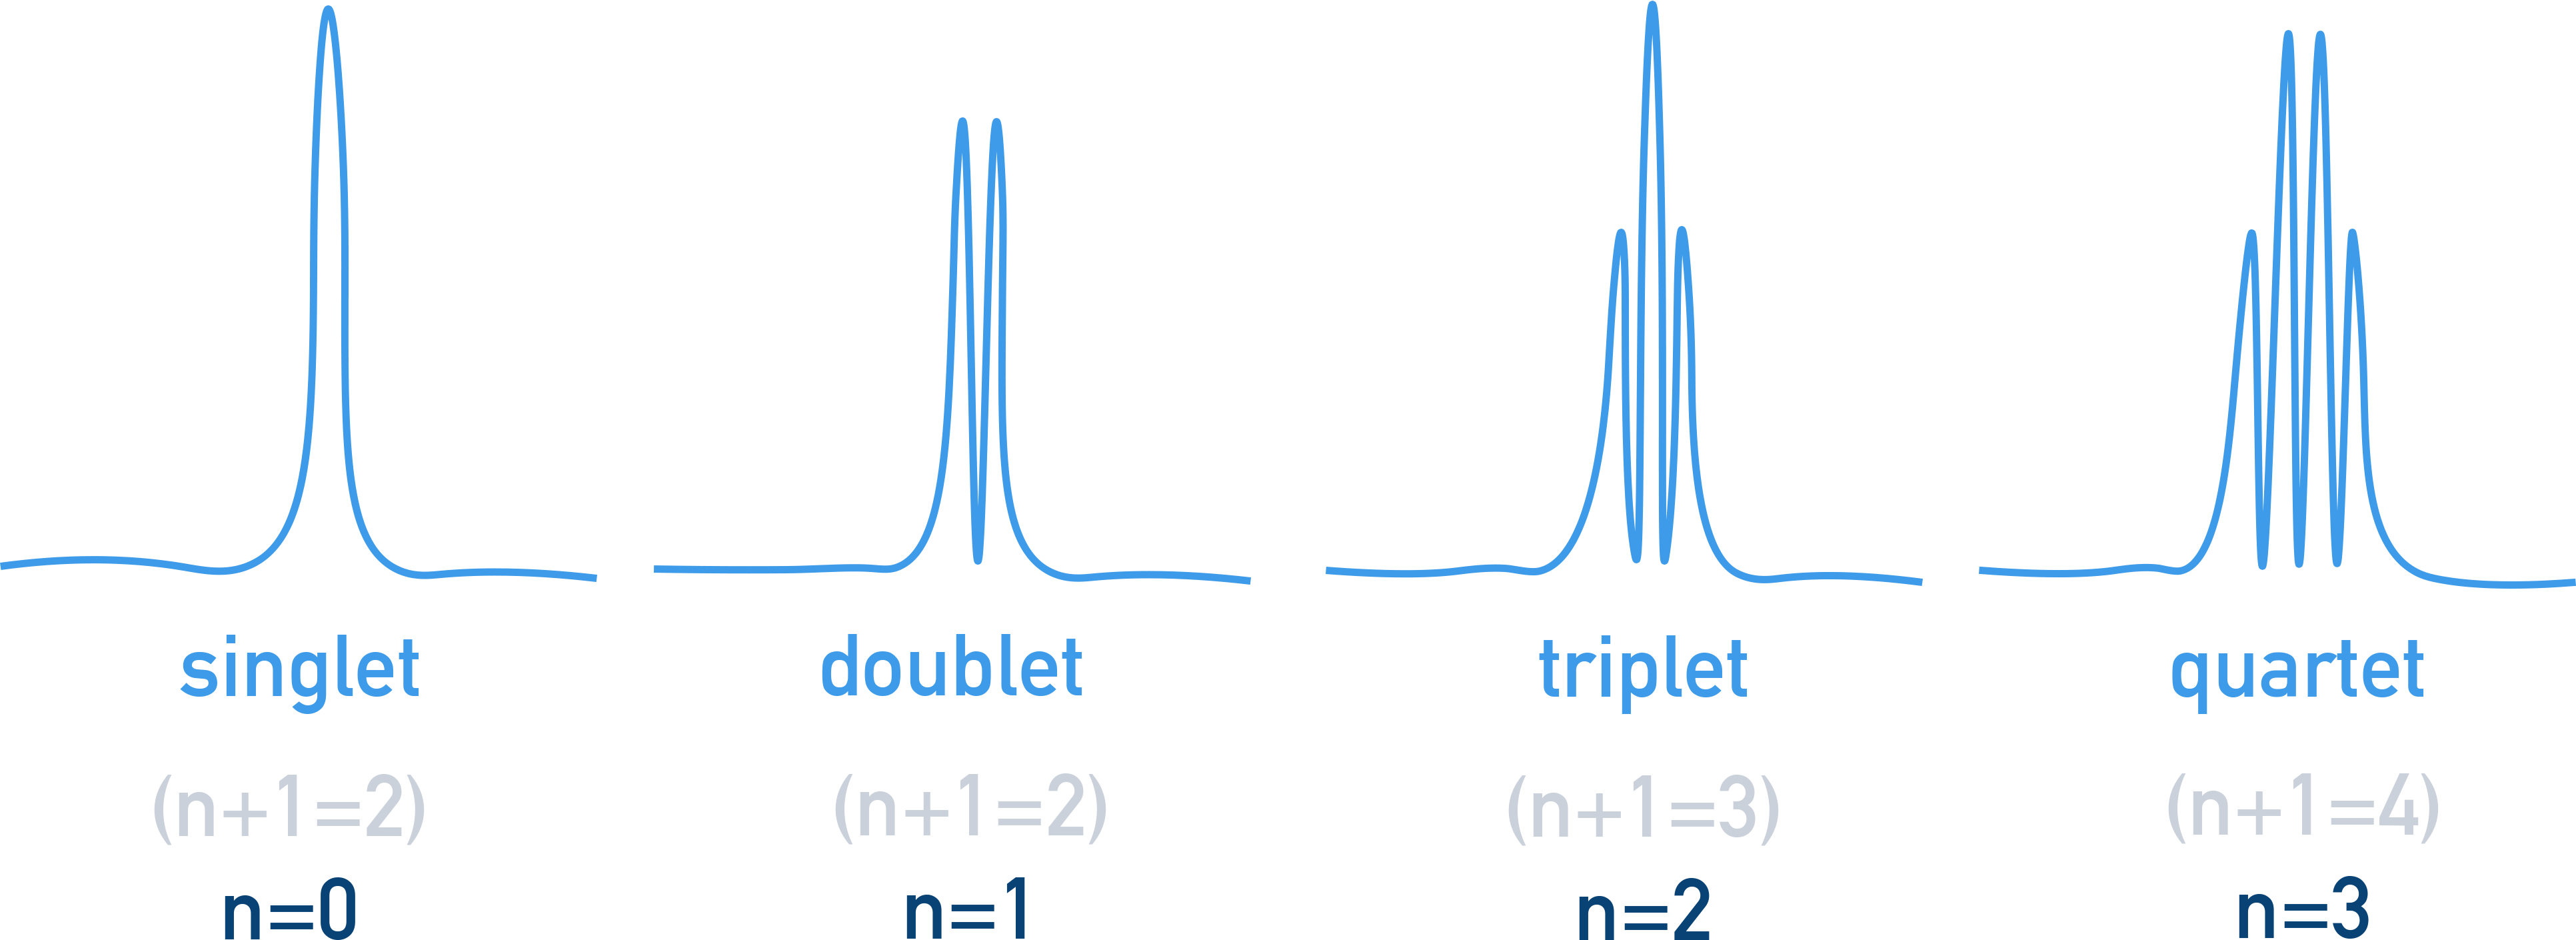
This is useful to know when analysing spectra as it means the number of hydrogen atoms bonded to adjacent, non-equivalent carbon atoms can be determined from peak splitting.
Example Ethanol (CH3CH2OH)1H NMR Spectra
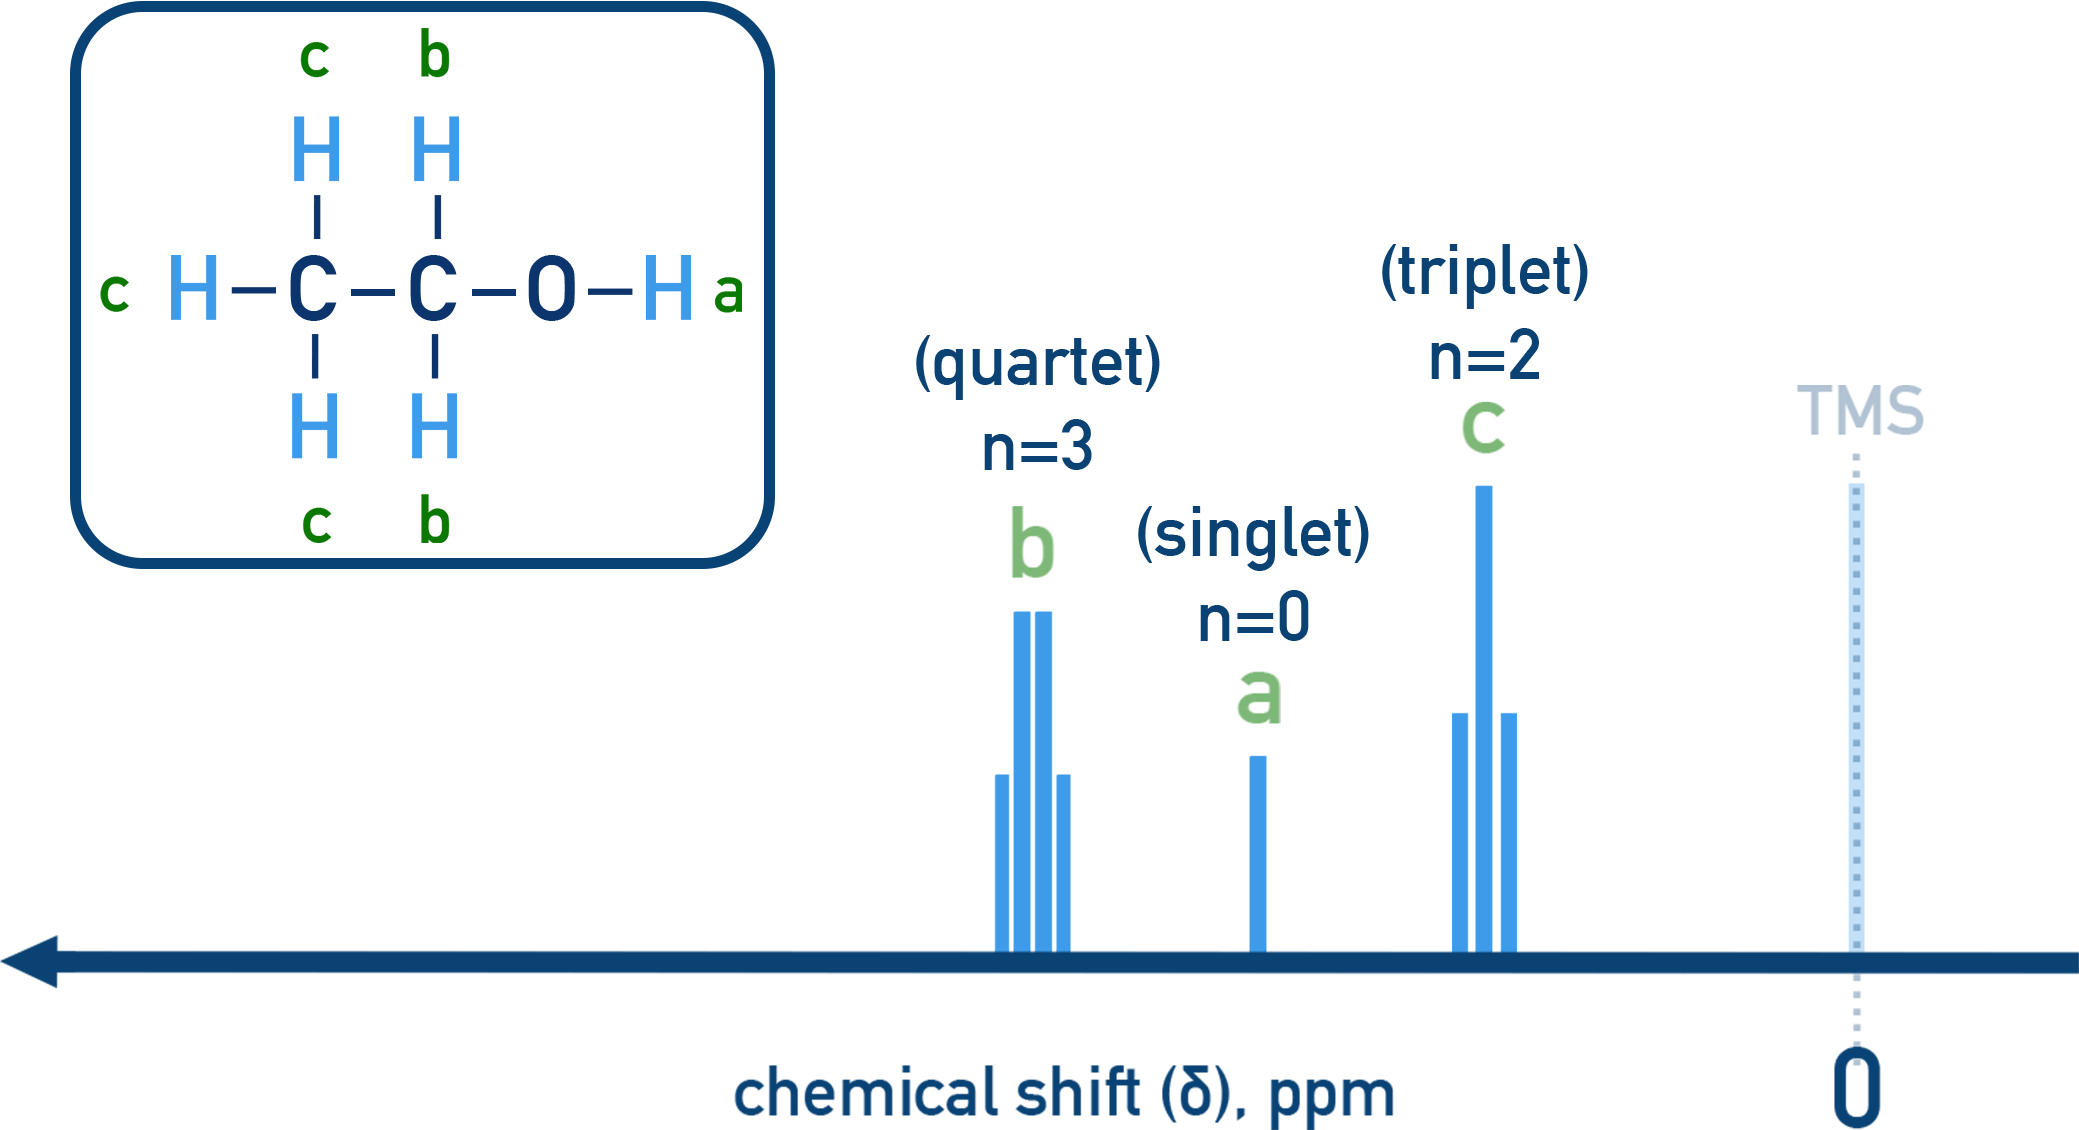
- CH3 group shows a triplet (next to CH2).
- CH2 group shows a quartet (next to CH3).
- OH appears as a singlet (no splitting).
Predicting and Interpreting Spectra
You’ll often be asked to match a molecule to its ¹H NMR spectrum.
Some steps to follow:
- Count and identify unique H environments.
- Predict δ values for each.
- Use integration to match peak areas.
- Use splitting patterns to identify neighbouring Hs.
- Match or deduce the structure.
The Role of TMS (Tetramethylsilane)
Tetramethylsilane, TMS, (CH3)4Si, is used as an internal standard (δ = 0 ppm). This allows peaks to be compared to reference values.
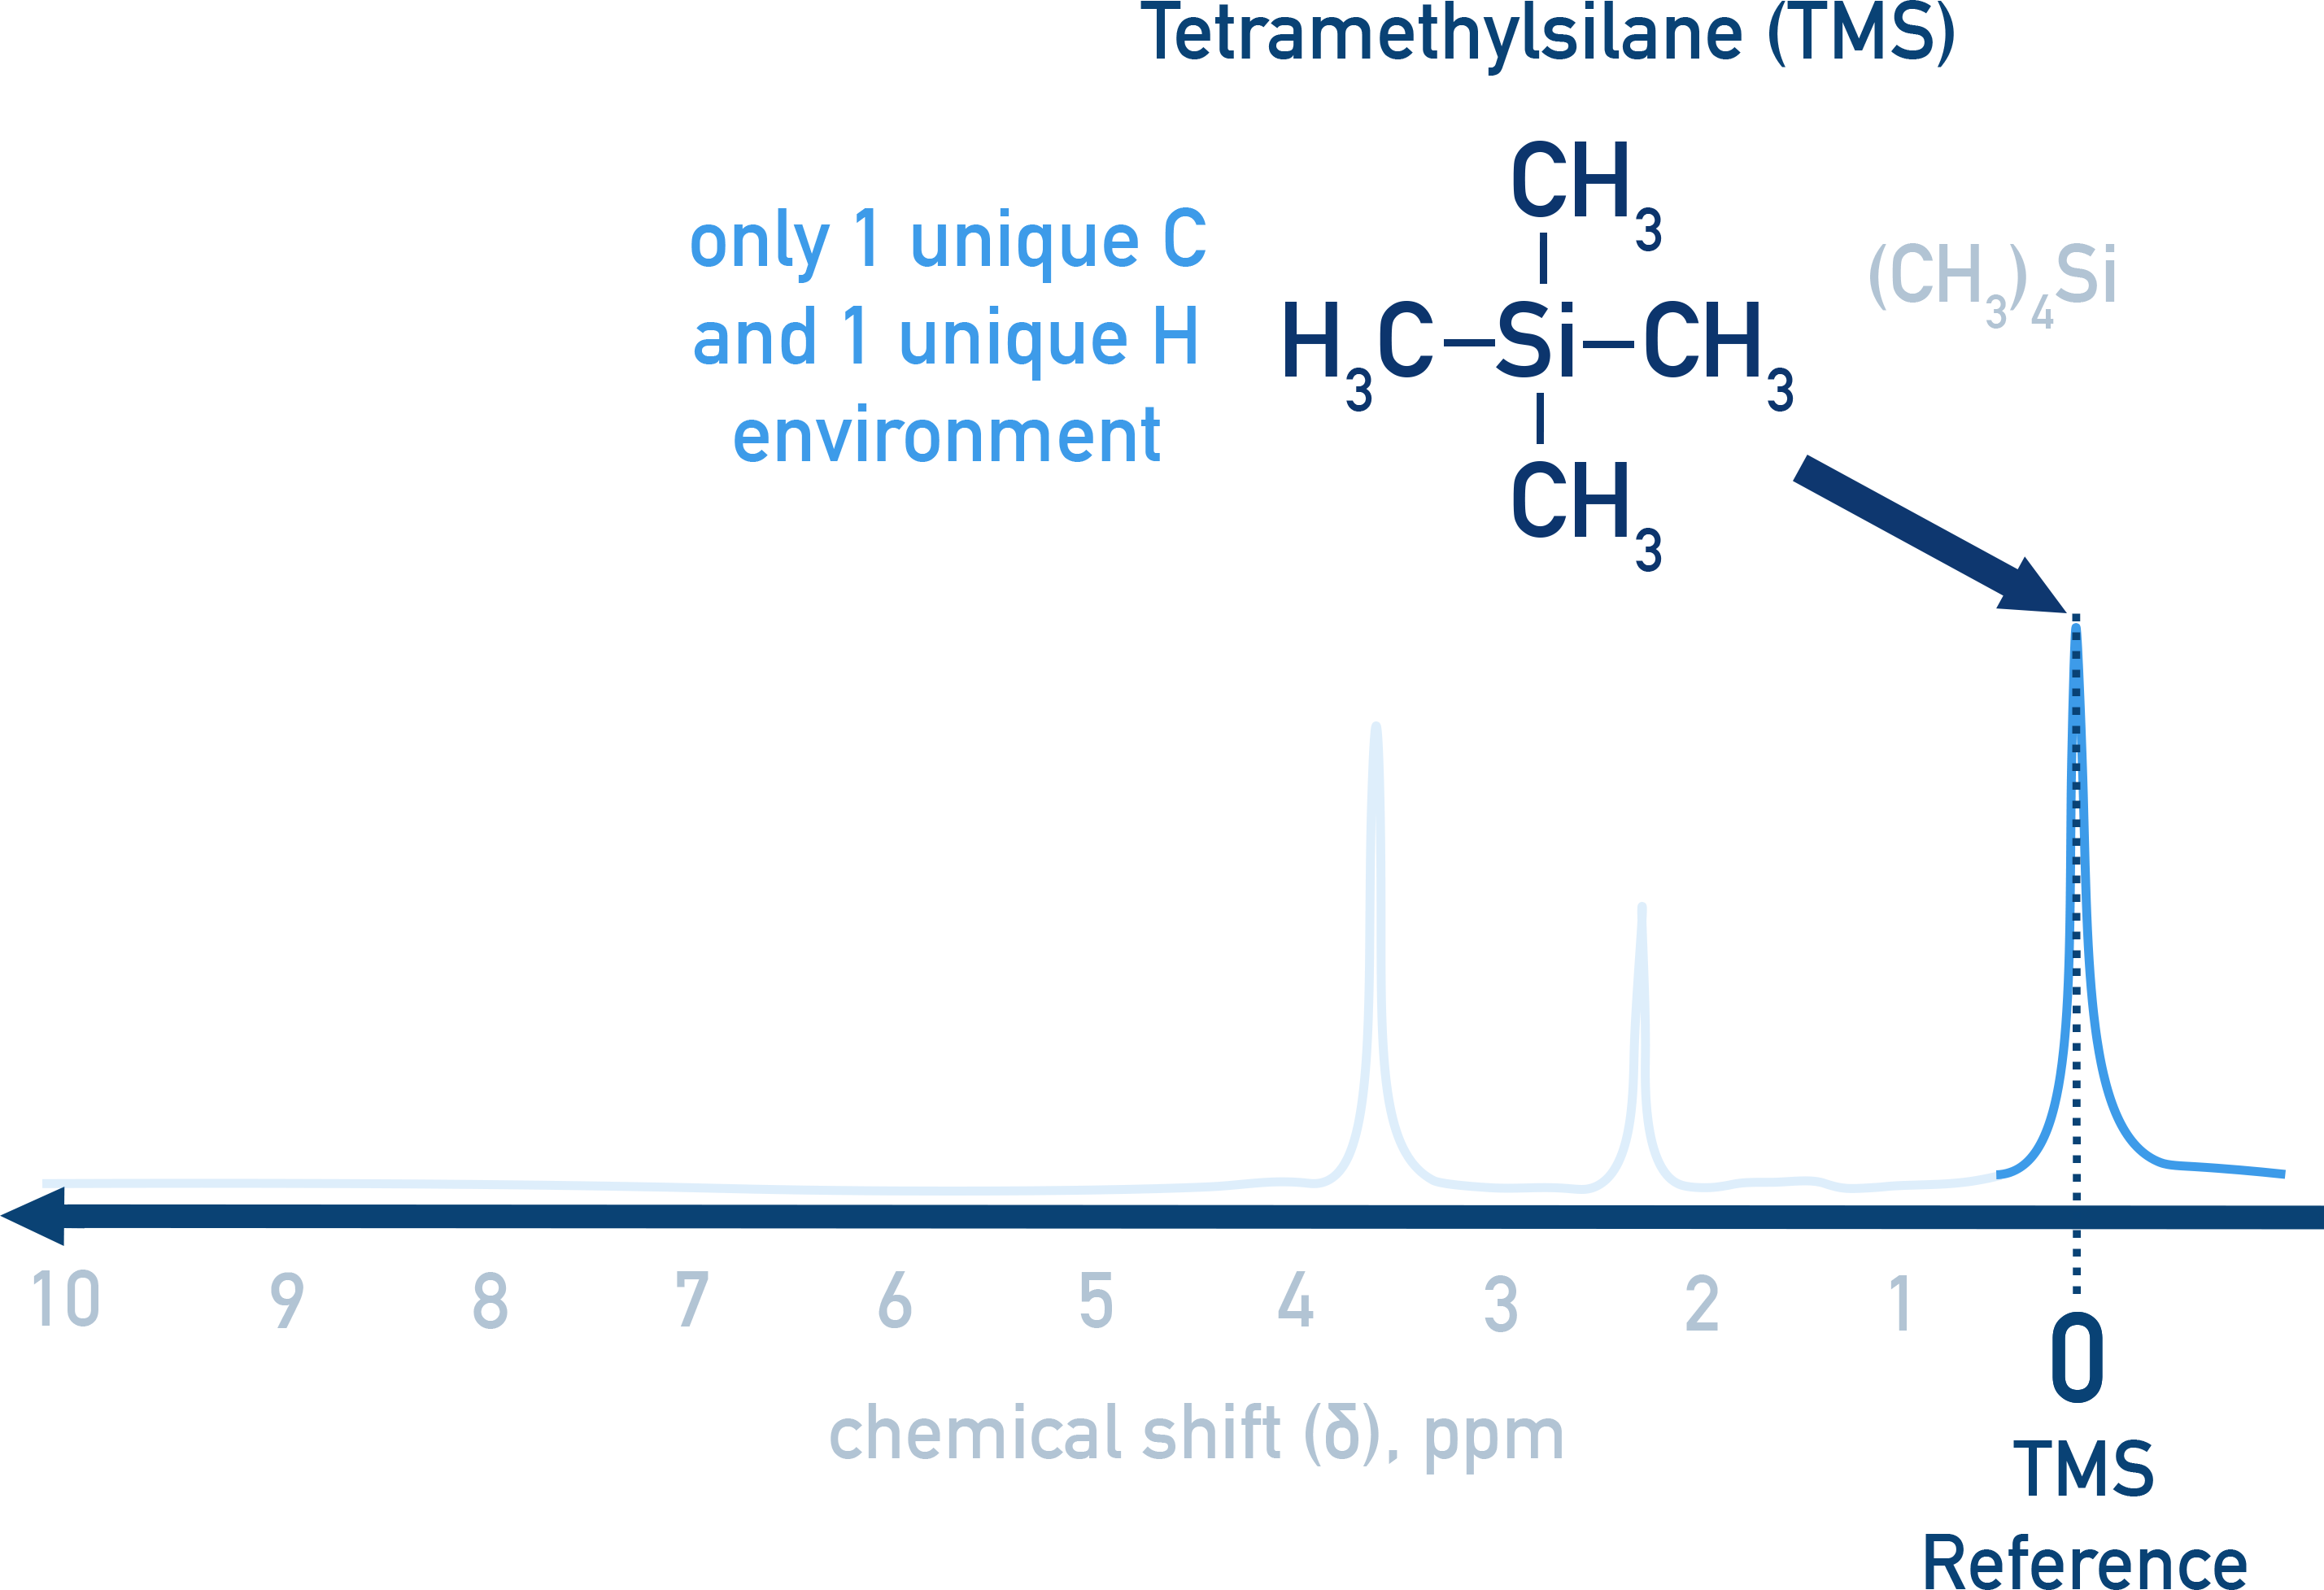
Why is TMS used?
- Produces a single peak (all protons equivalent).
- Non-reactive and volatile (easily removed).
- Low chemical shift (does not interfere).
Deuterated Solvents
For H-NMR, samples must be dissolved in deuterated solvents (contain only isotopes 2H that don’t have an overall spin) or solvents that have no hydrogens in, such as tetrachloromethane, CCl4.
Why not just use normal solvents like H₂O or CHCl₃?
- Protonated solvents interfere with the ¹H NMR signal.
- Deuterated solvents contain deuterium (²H), which does not show up in ¹H NMR.
Identifying O–H and N–H Protons with D₂O Exchange
D2O (deuterated water) contains ²H isotopes of hydrogen, which do not appear in ¹H NMR spectra.
If a sample contains O-H or N-H bonds and is dissolved in a D2O solvent, the H in the O-H bond will be exchanged with deuterium atoms from the D2O. Because the deuterium doesn’t show on a NMR spectra, no peak will appear for the O-H or N-H environment now.
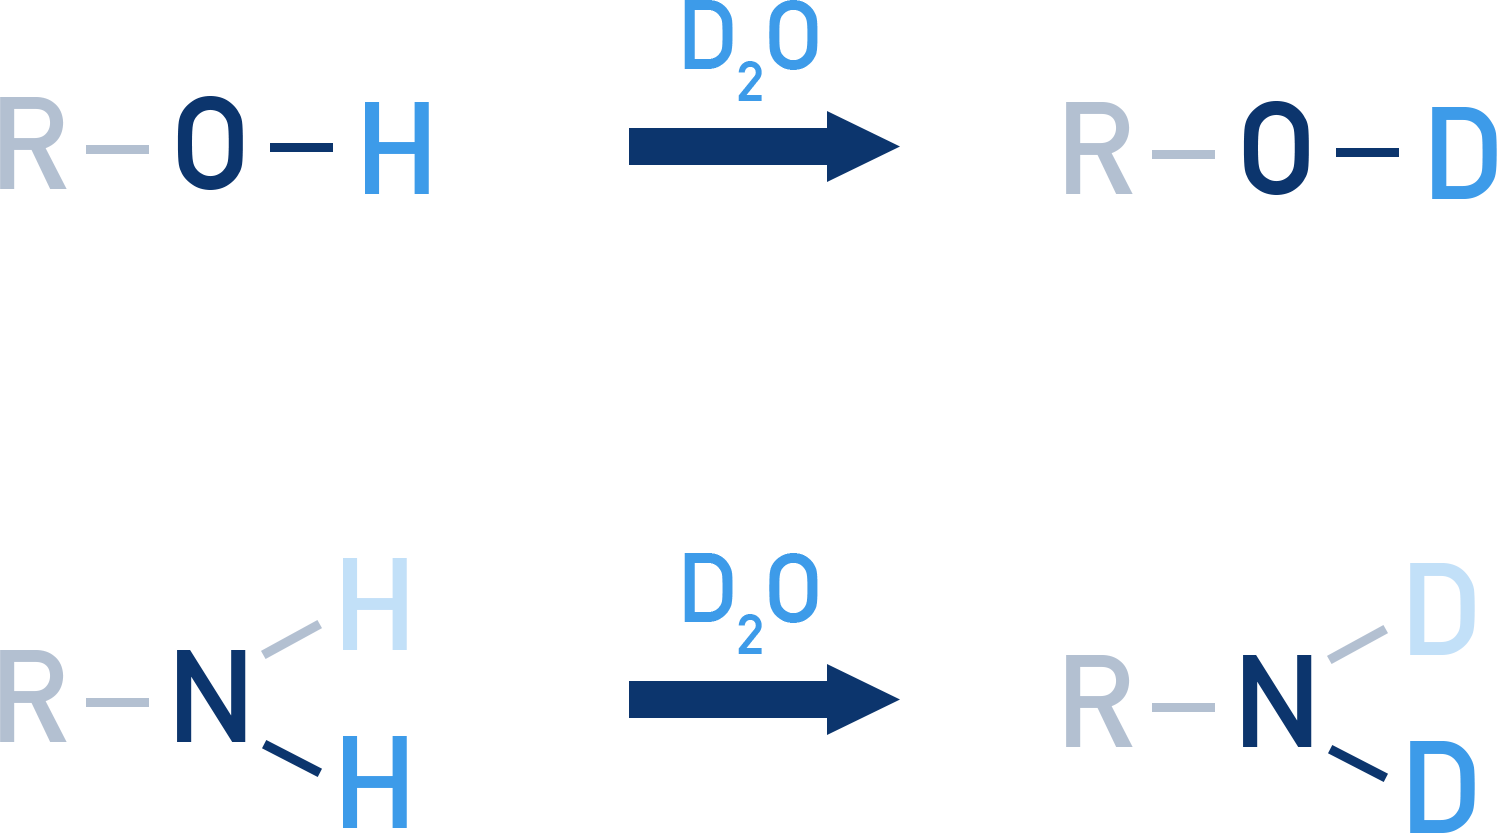
To confirm O-H environments in a compound, we can run an NMR without D2O and then repeat with D2O as the solvent. If any peaks in the spectra disappear, we know they must be O-H groups.
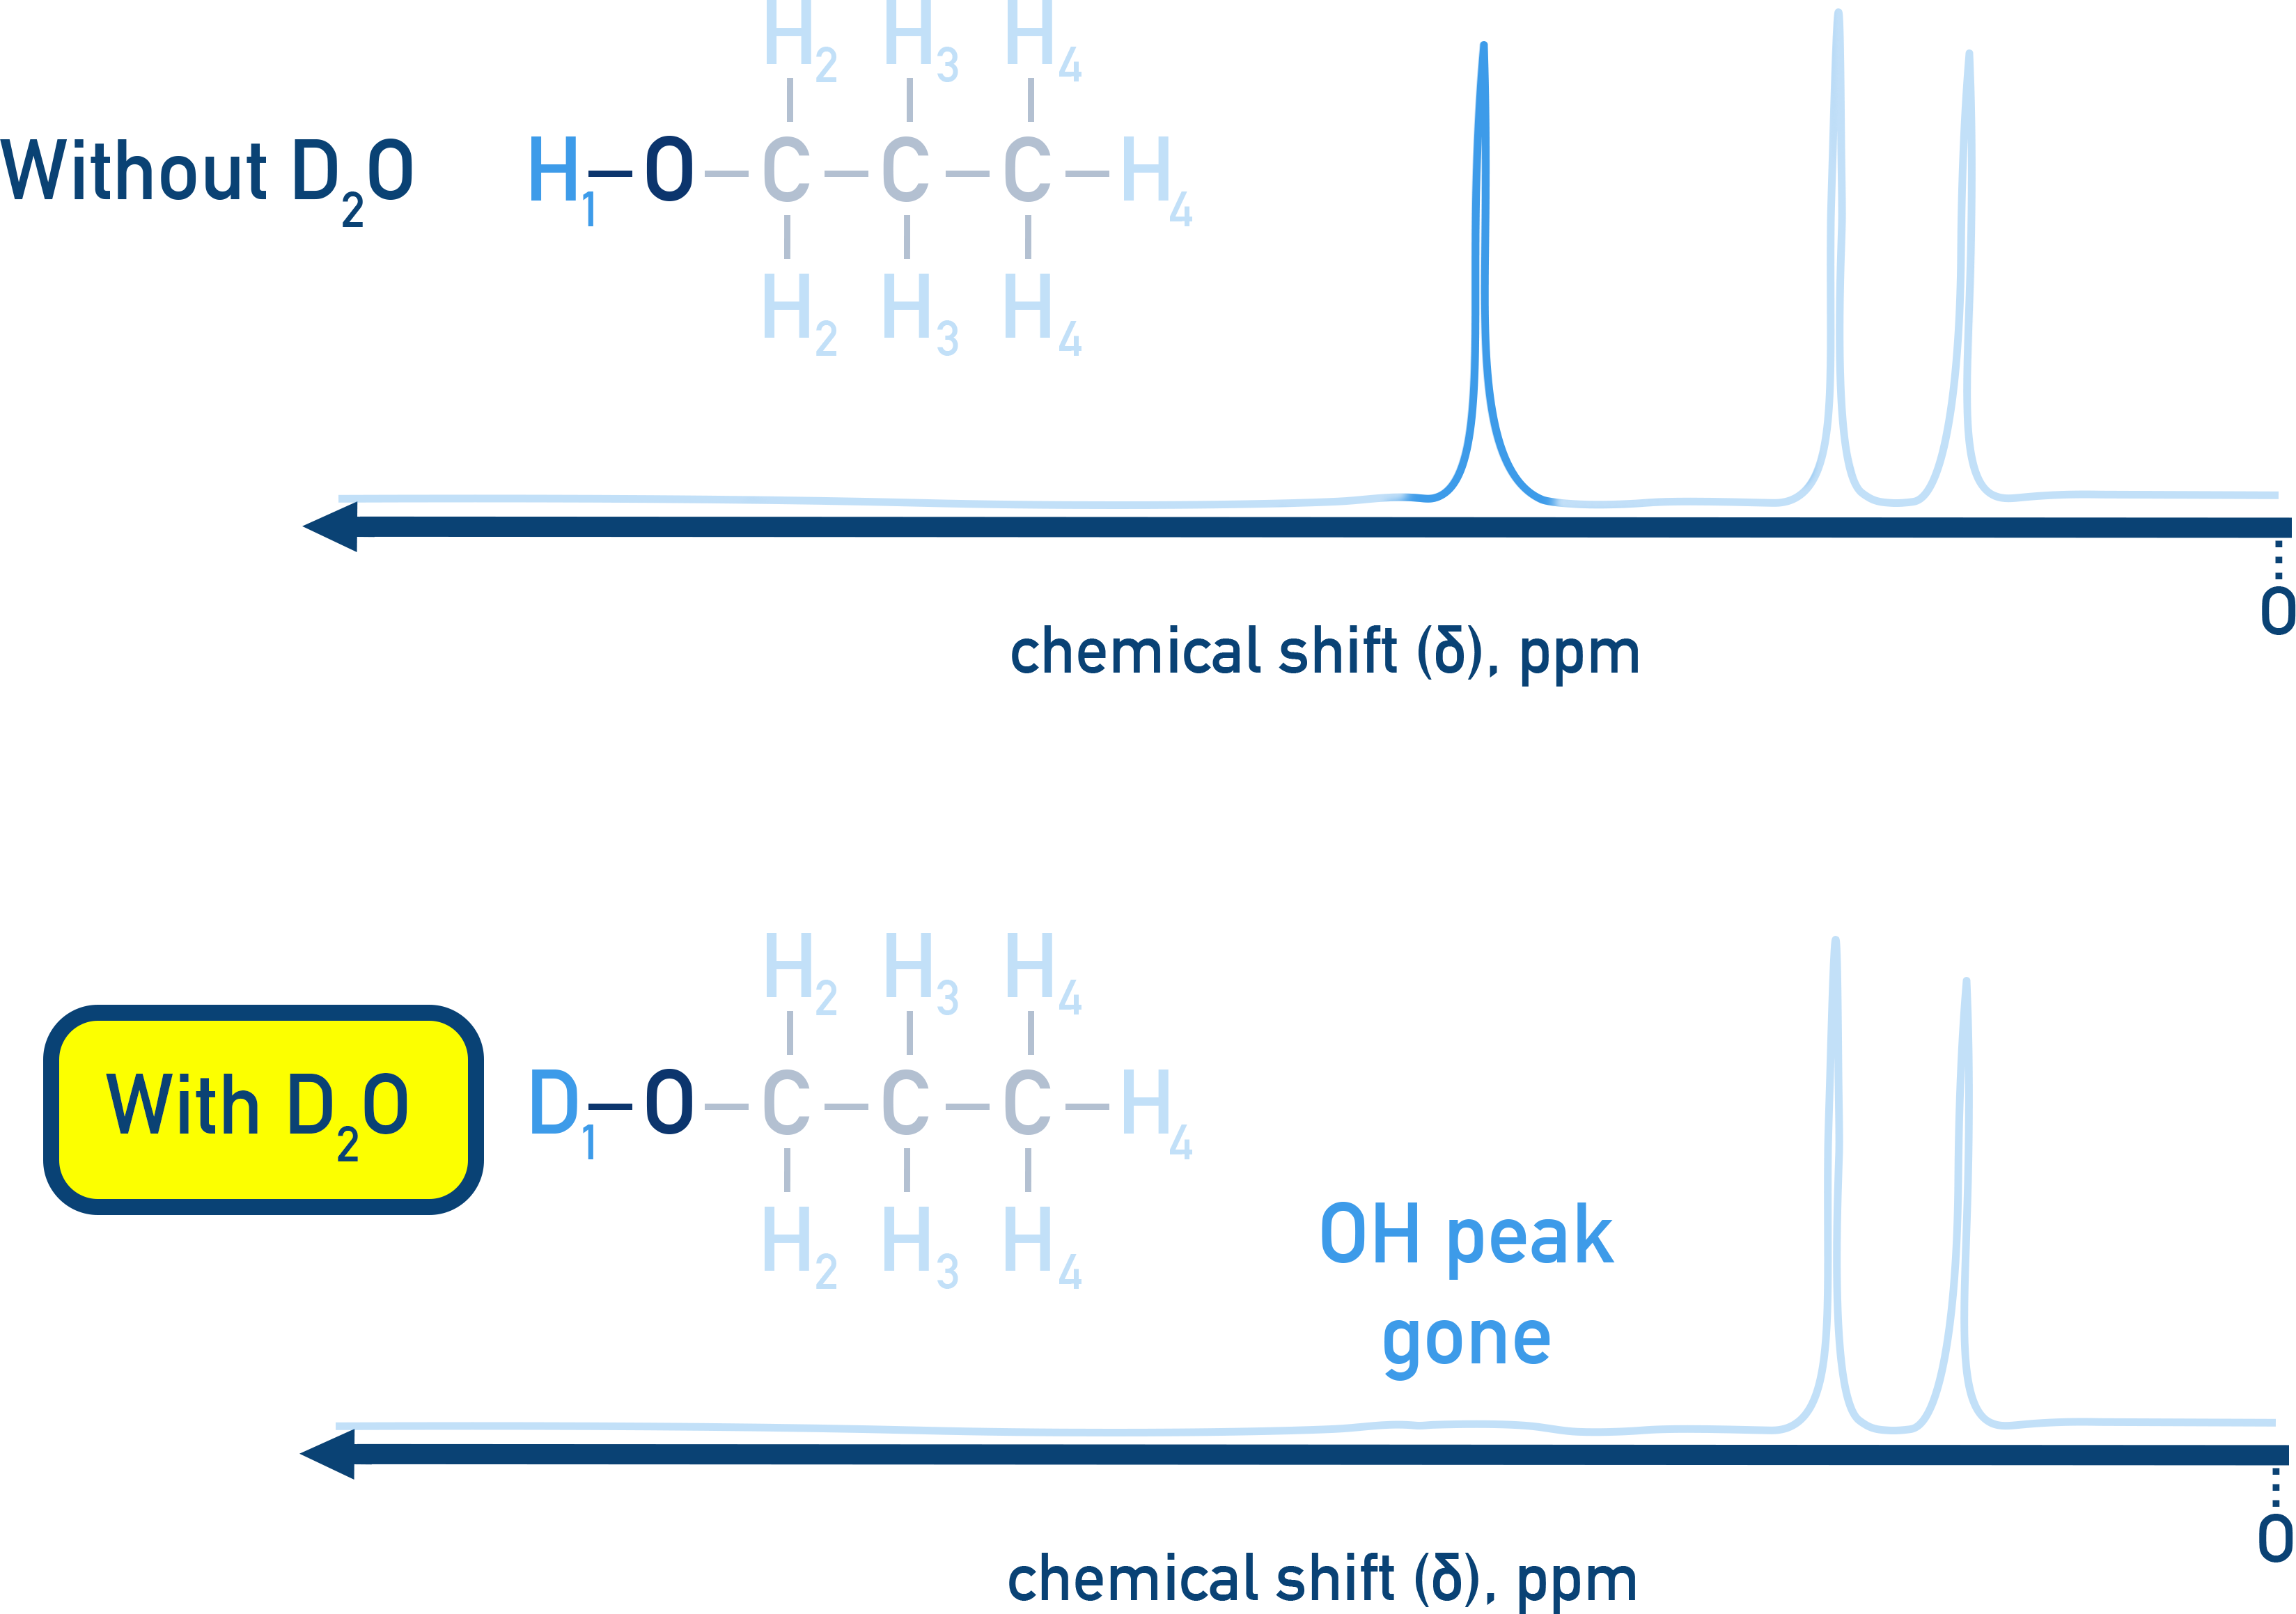
The O–H or N–H protons are replaced with deuterium, and the corresponding peak disappears from the spectrum.
Summary
- ¹H NMR spectra show hydrogen environments in organic molecules.
- Chemical shift (δ) identifies environments.
- Integration shows relative numbers of protons.
- Splitting (n+1 rule) shows neighbouring protons.
- TMS is the reference at 0 ppm.
- Deuterated solvents avoid solvent peaks.
- D₂O exchange helps confirm O–H and N–H protons.