
Titration Curves and Indicators
Quick Notes
- Titrations can be used to determine the concentration of an acid or base.
- Titration curves show how pH changes during a titration.
- Key regions of a pH curve:
- Initial pH (before titration starts).
- Gradual pH change (as titrant is added).
- Vertical equivalence point region (rapid pH change).
- Final pH (excess titrant added).
- Titration curves have slightly different shapes depending on if strong or weak acids and bases are used.
- Equivalence point is where acid and base are in exact stoichiometric proportions.
- For weak acids with a strong base the pH at half-neutralisation = pKa.
- Choice of indicator depends on the titration curve — the indicator needs to change colour at a pH that occurs in the vertical part of a pH curve:
- Strong acid vs. strong base: Phenolphthalein or Methyl Orange.
- Strong acid vs. weak base: Methyl Orange.
- Weak acid vs. strong base: Phenolphthalein.
- Weak acid vs. weak base: No suitable indicator, use pH meter.
- Indicator Colour Changes:
- Methyl Orange: Red (acid) and Yellow (base) (pH ~3.5 – 4.5).
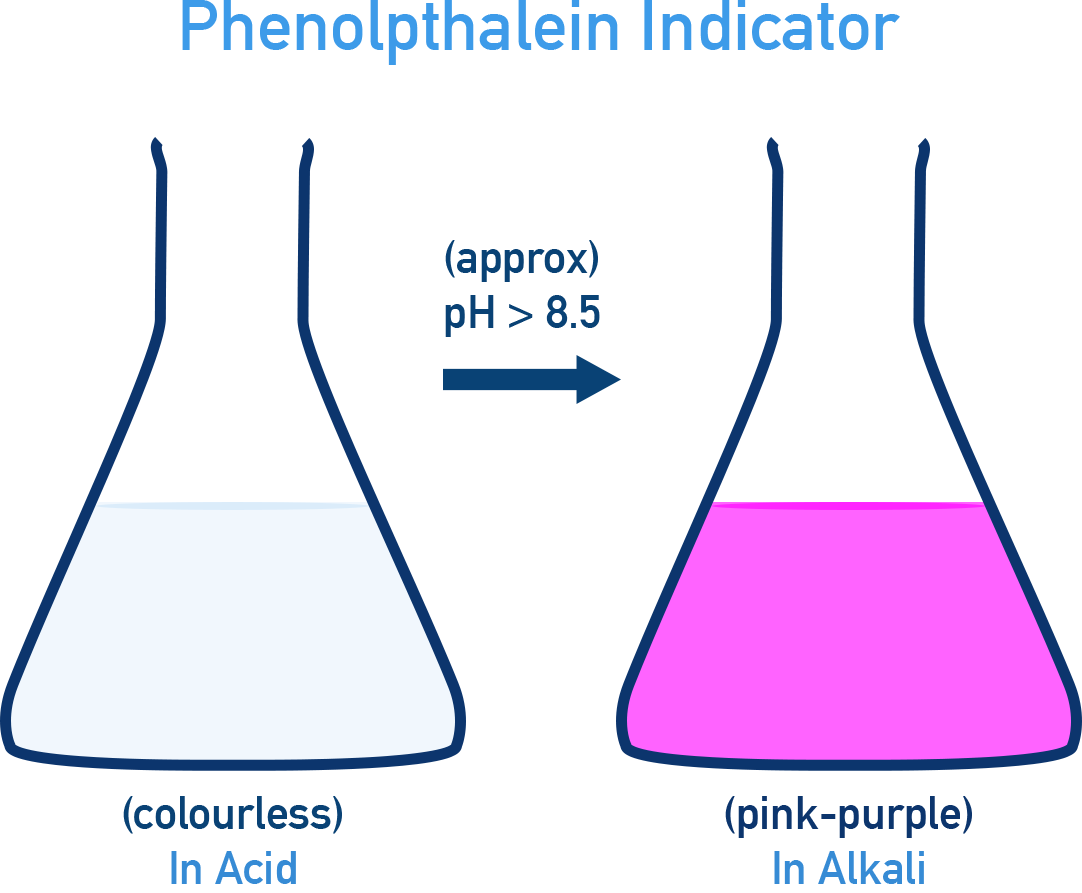
- Phenolphthalein: Colourless (acid) and Pink (base) (pH ~8.3 – 10).
Full Notes
What Is a Titration Curve?
A titration or pH curve is a graph showing how the pH of a solution changes as a reagent (acid or base) is gradually added.
On the x-axis: Volume of acid or base added
On the y-axis: pH of the solution
The equivalence point is where the amount of added acid exactly reacts with the base (or added base reacts exactly with acid).
Different combinations of acids and bases produce different curve shapes.
Types of Titration Curves
Here’s a breakdown of the common acid–base titrations you need to know:
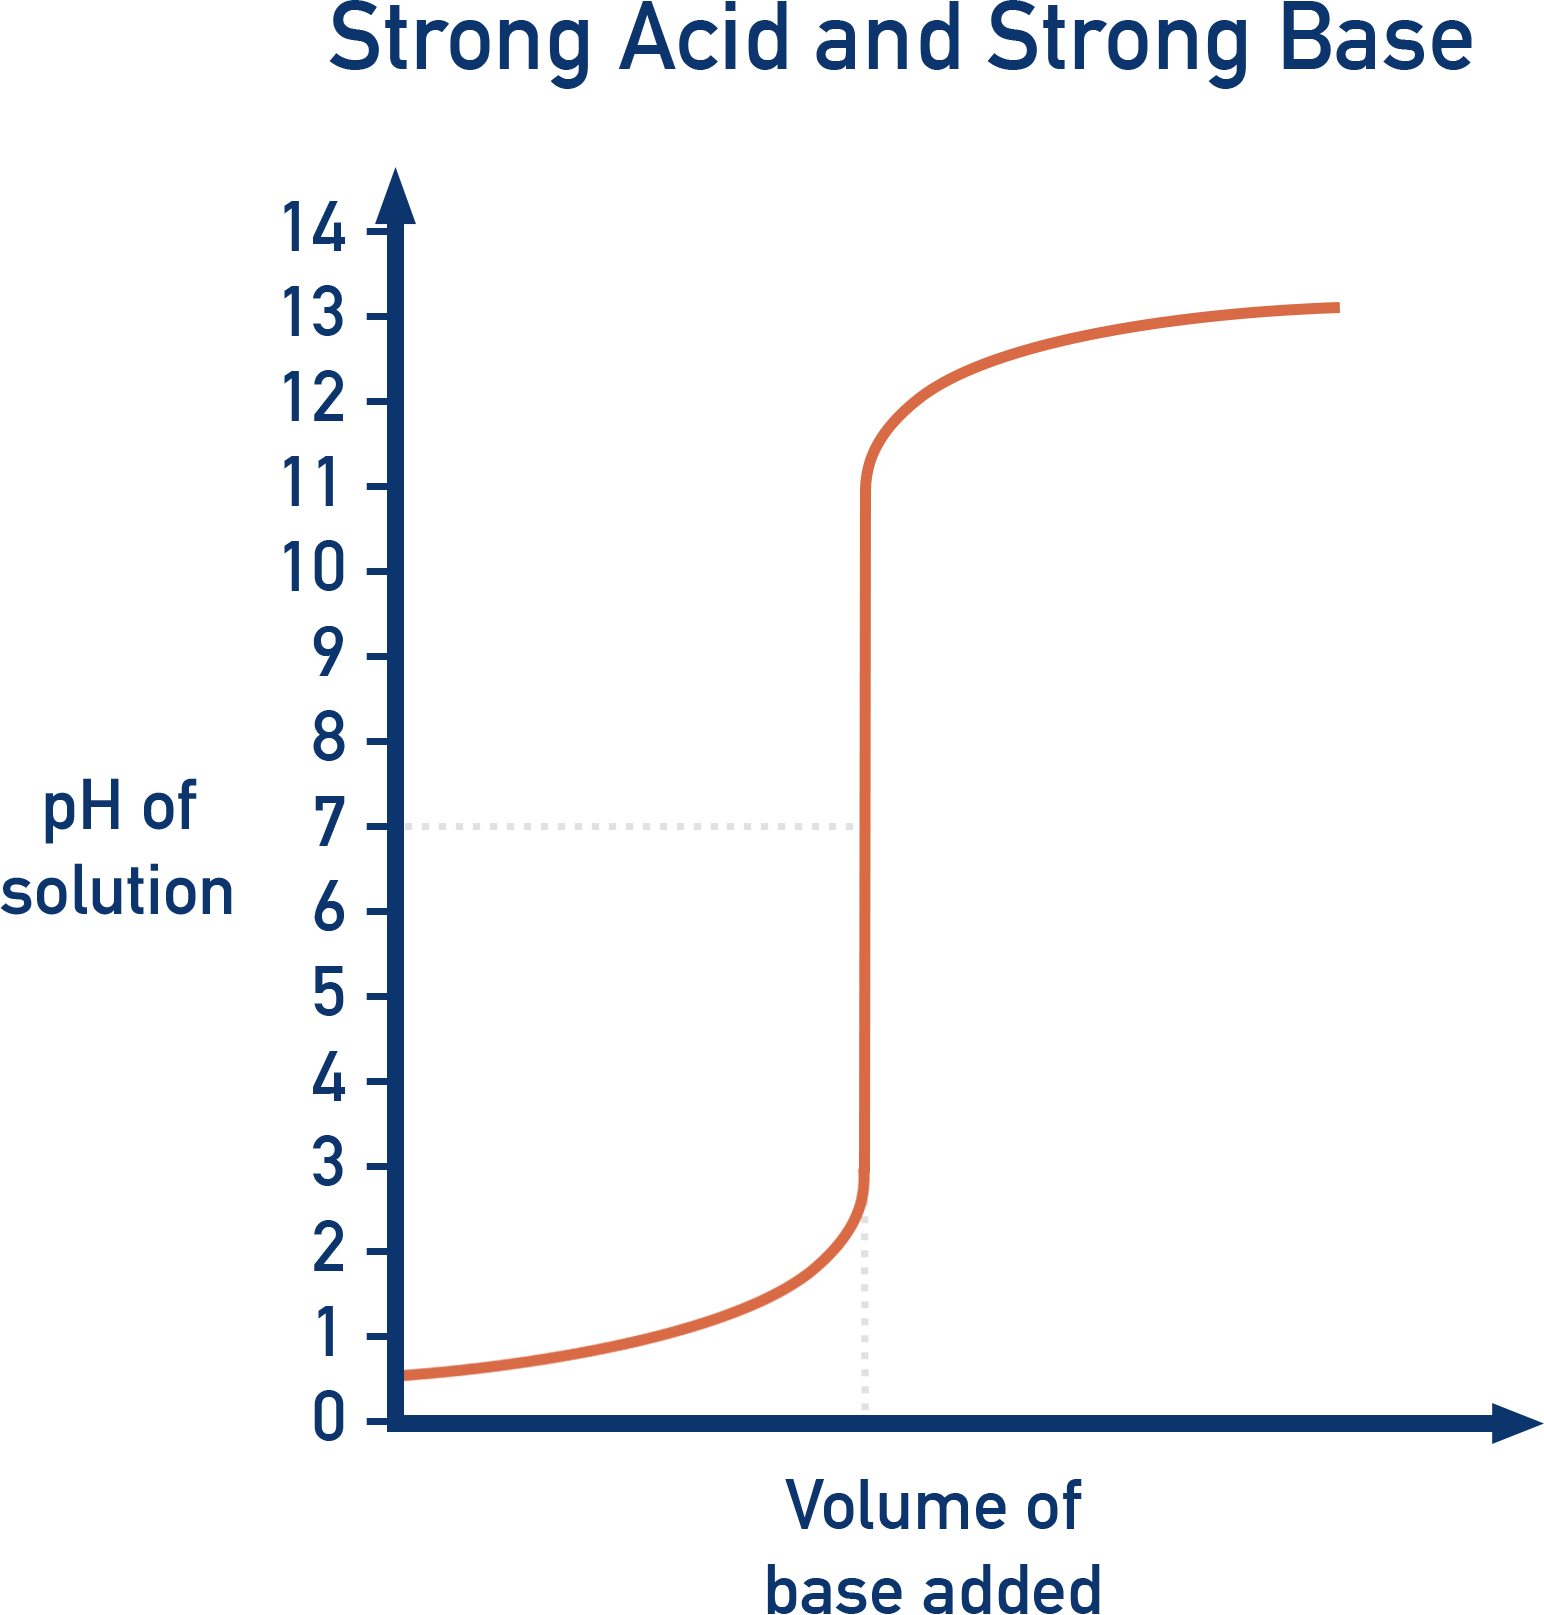
Strong Acid vs. Strong Base (e.g. HCl + NaOH)
- Initial pH: Very low (~1, strong acid).
- Rapid rise around pH 7 (equivalence point).
- Final pH: Very high (~13, strong base).
- Suitable indicators: Phenolphthalein or Methyl Orange.
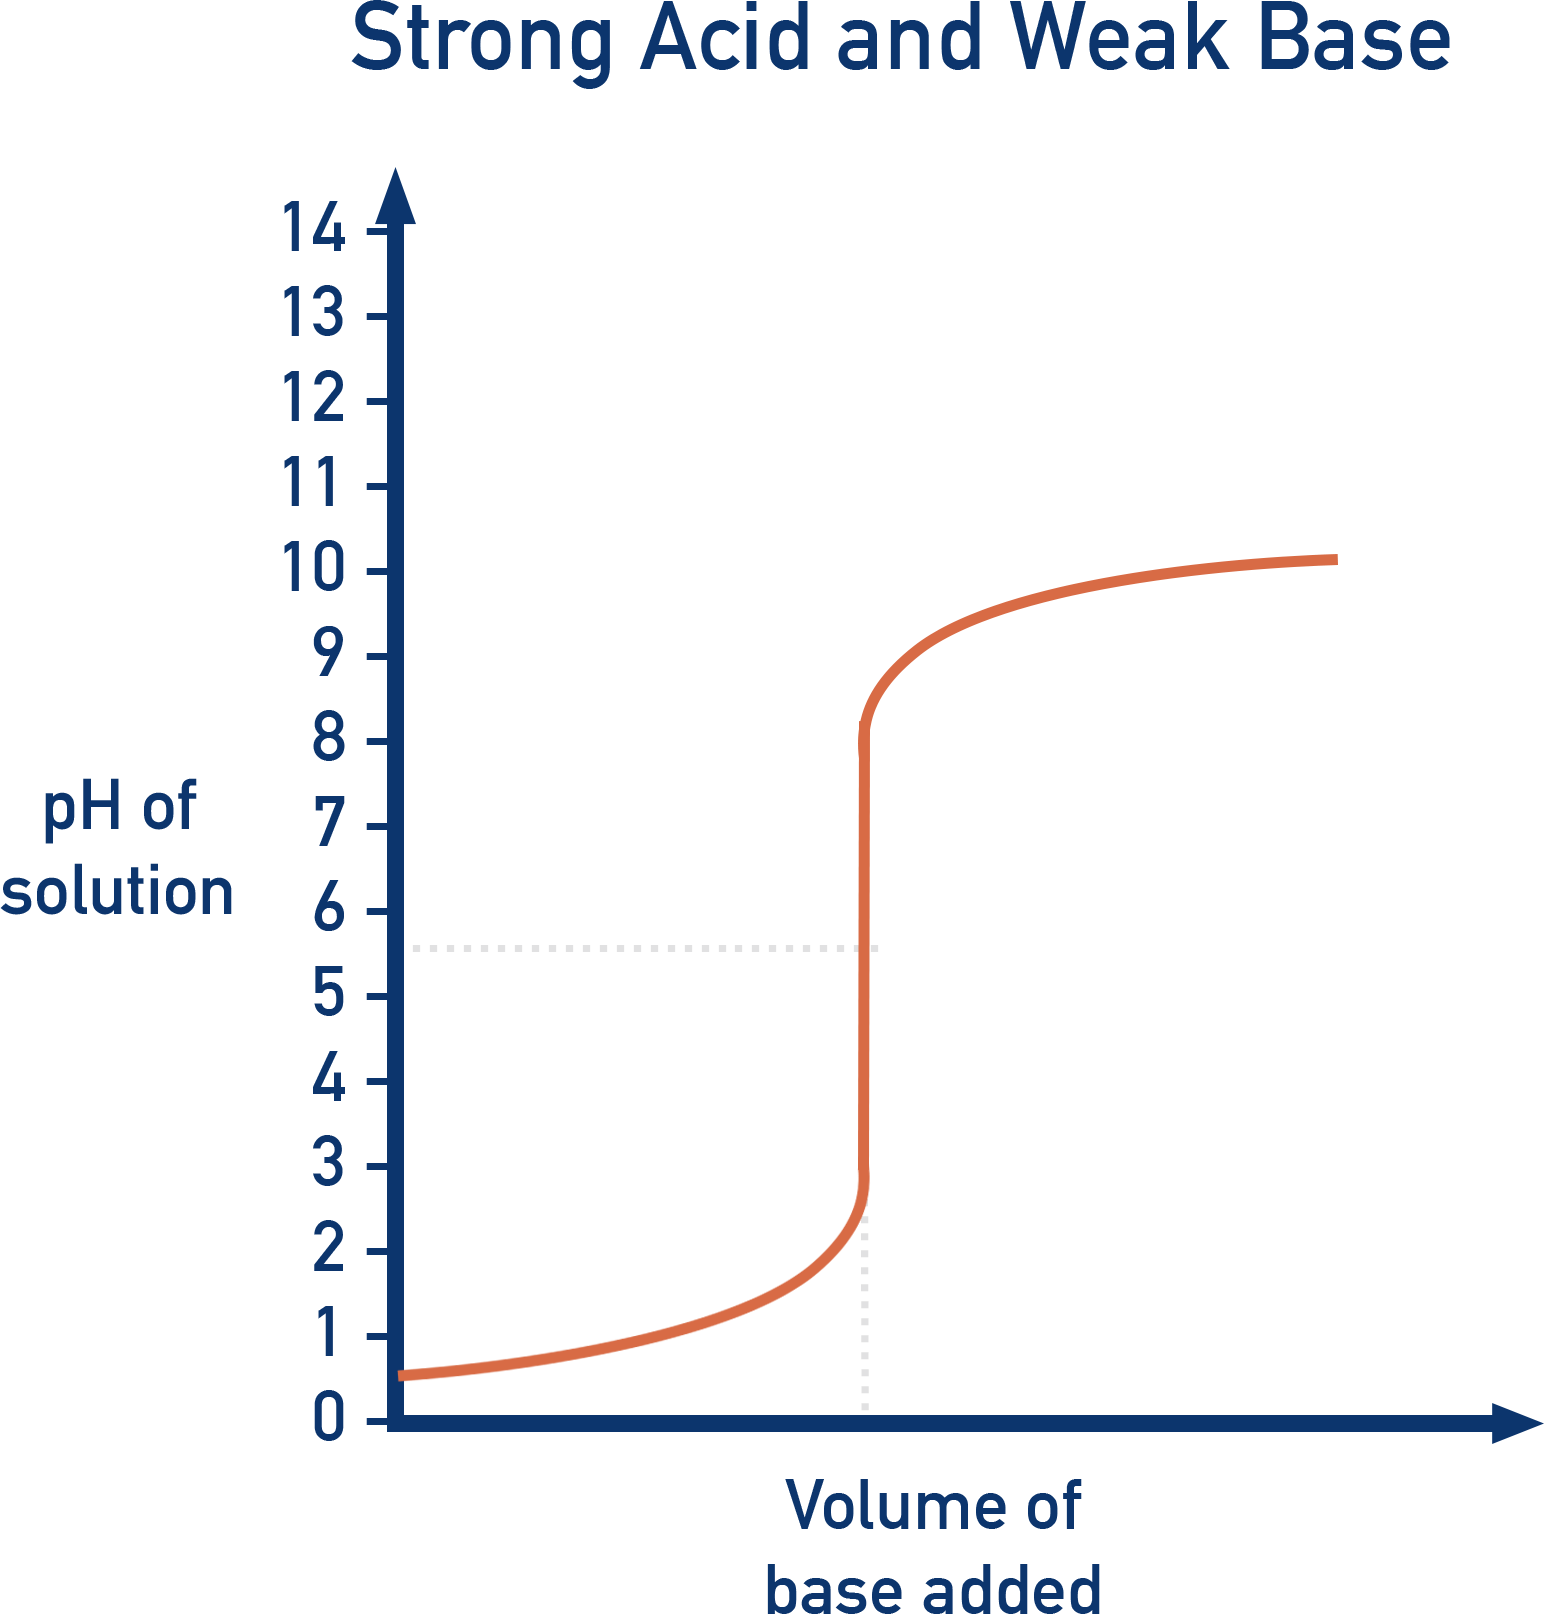
Strong Acid vs. Weak Base (e.g. HCl + NH3)
- Initial pH: Very low (~1, strong acid).
- Equivalence point: Below pH 7 (~5).
- Final pH: ~9 to 10, weak base.
- Suitable indicator: Methyl Orange.
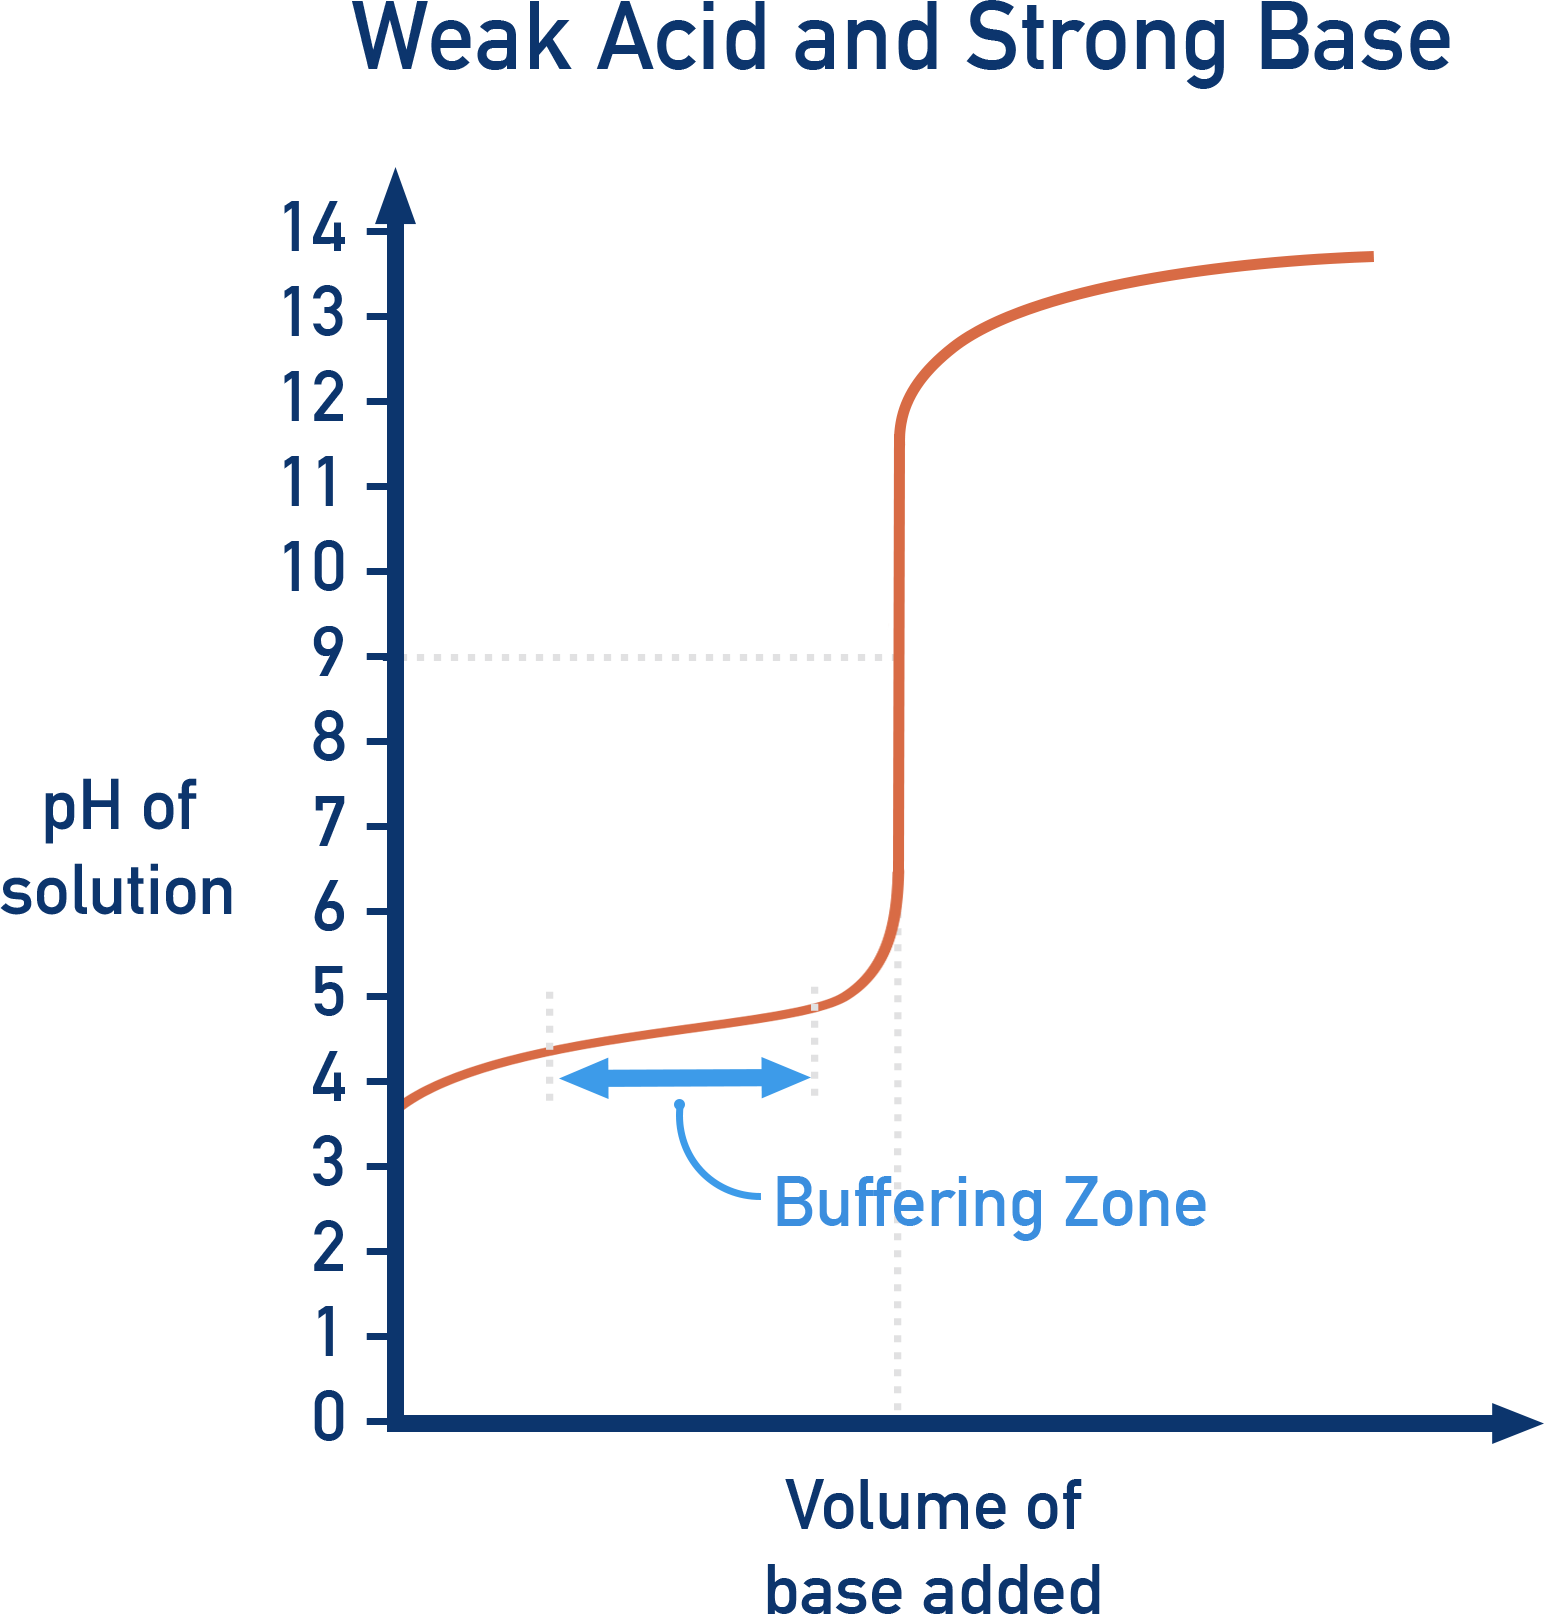
Weak Acid vs. Strong Base (e.g. CH3COOH + NaOH)
- Initial pH: Moderate (~4, weak acid).
- Buffer zone: After a small quantity of base is added, a buffer system is formed meaning the pH change is minimised until overwhelmed.
- Equivalence point: Above pH 7 (~9).
- pH at half-neutralisation = pKa
- Final pH: Very high (~13, strong base).
- Suitable indicator: Phenolphthalein.
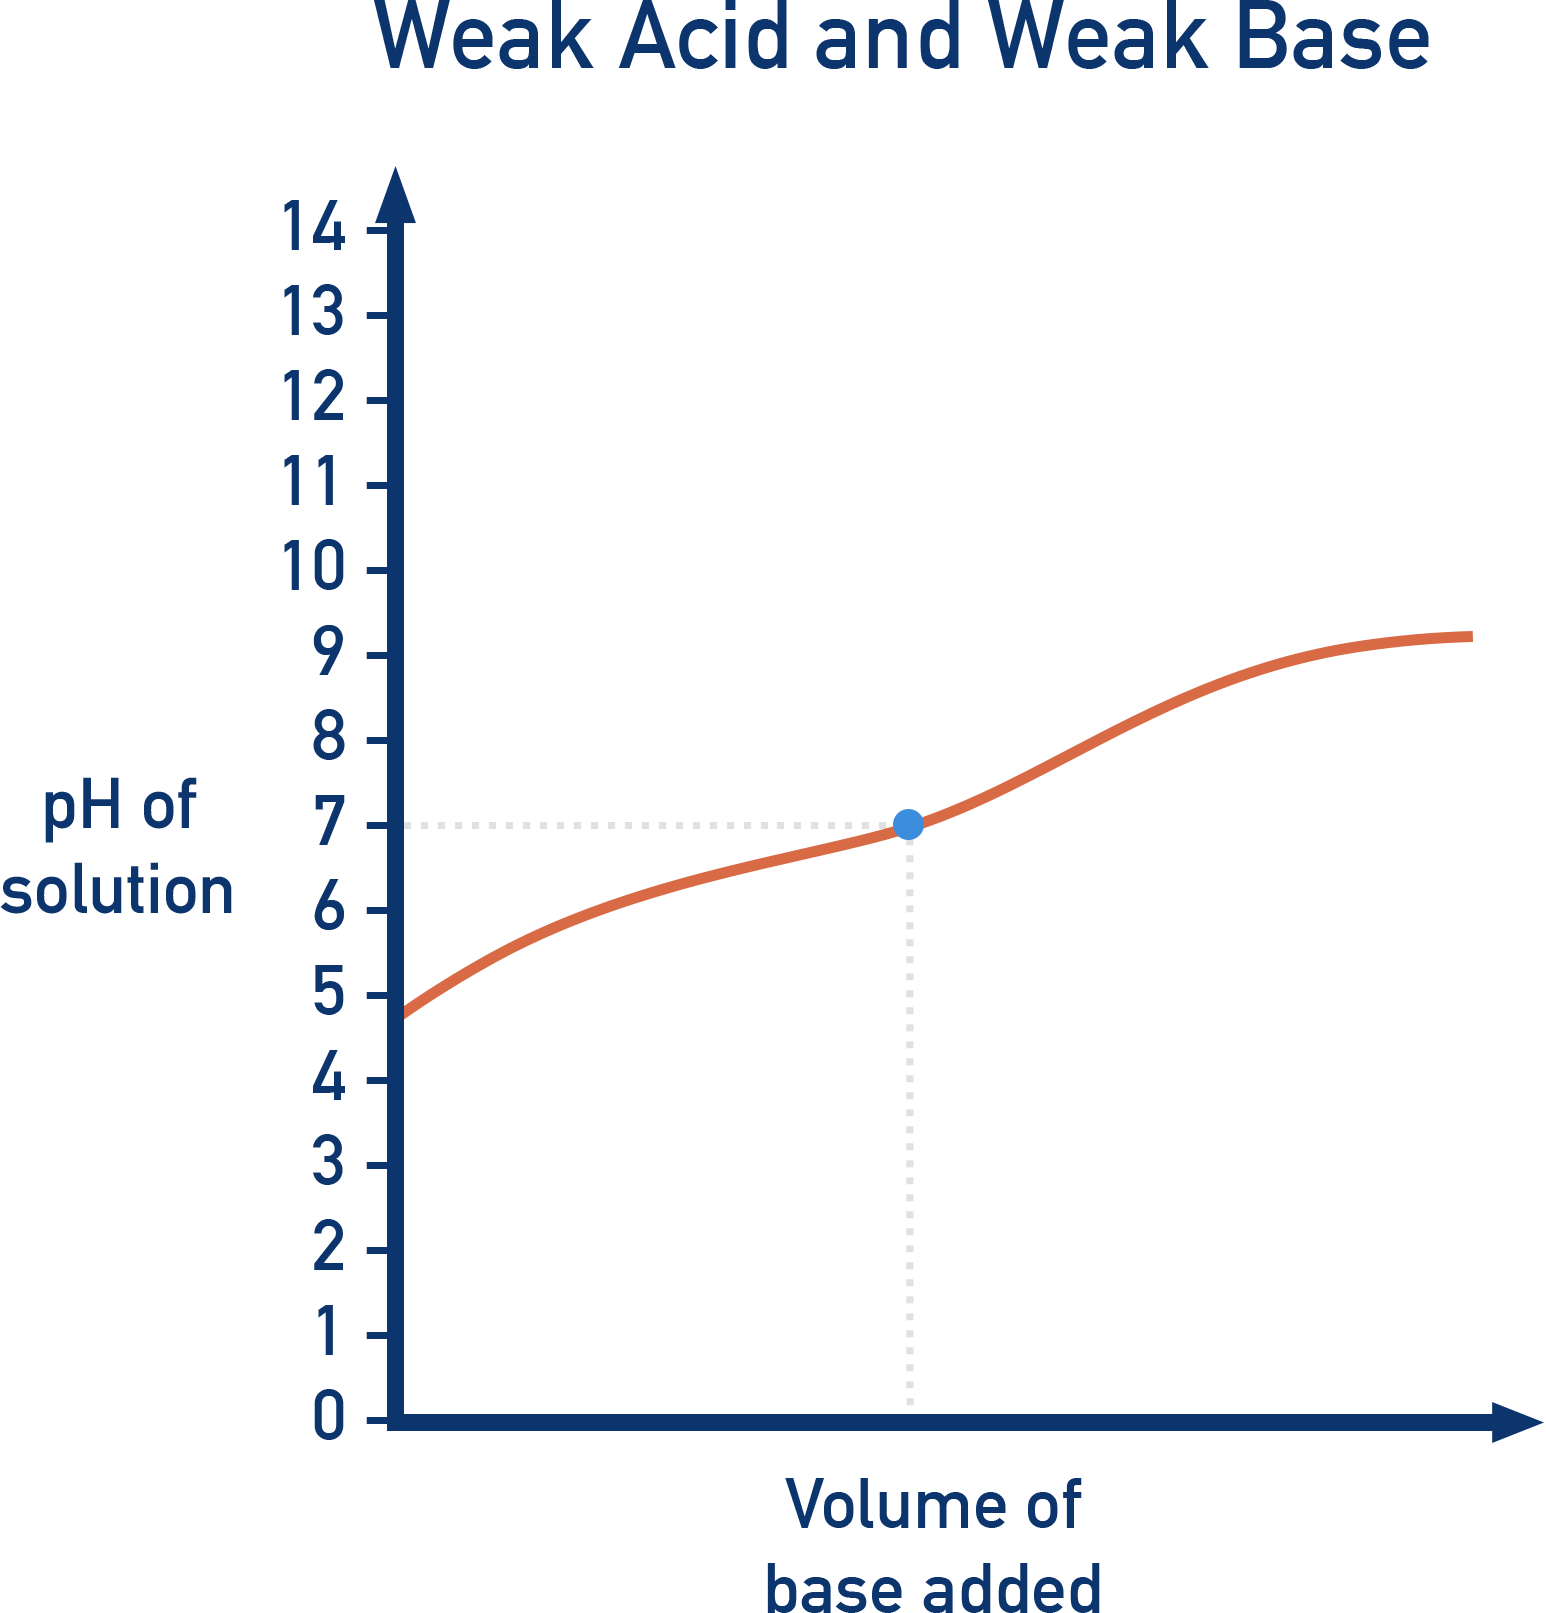
Weak Acid vs. Weak Base (CH3COOH + NH3)
- Initial pH: Moderate (~4, weak acid).
- No sharp pH change: No clear equivalence point.
- pH meter required (no suitable indicator).
How to Interpret Curve Shapes
- Initial pH: Depends on strength of acid or base.
- Buffer region (in weak acid + strong base): Gradual pH rise due to partial neutralisation.
- Vertical section: Where the pH rises/falls rapidly — this marks the equivalence point.
- Final pH: Set by the excess base or acid added.
Choosing an Indicator
During a titration, an indicator is used that changes colour at a certain pH.
When the solution reaches this pH, the indicator changes colour — this is how the person carrying out the titration knows it is ‘complete’.
The end point of a titration is when enough titrant has been added to make the indicator change colour.

What is the difference between the end point and the equivalence point? The end point is simply when a colour change occurs as the solution in a titration gets to a particular pH. The equivalence point refers to the point at which chemically equivalent amounts of acid and base have been mixed in the solution, not the pH of the solution.
Indicator Colour Changes
Different indicators can change colour at different pH values, this is why the same indicators aren’t always used for different titrations.
Indicators should be chosen that change colour at a pH that falls within the sharp peak area of a titration curve.
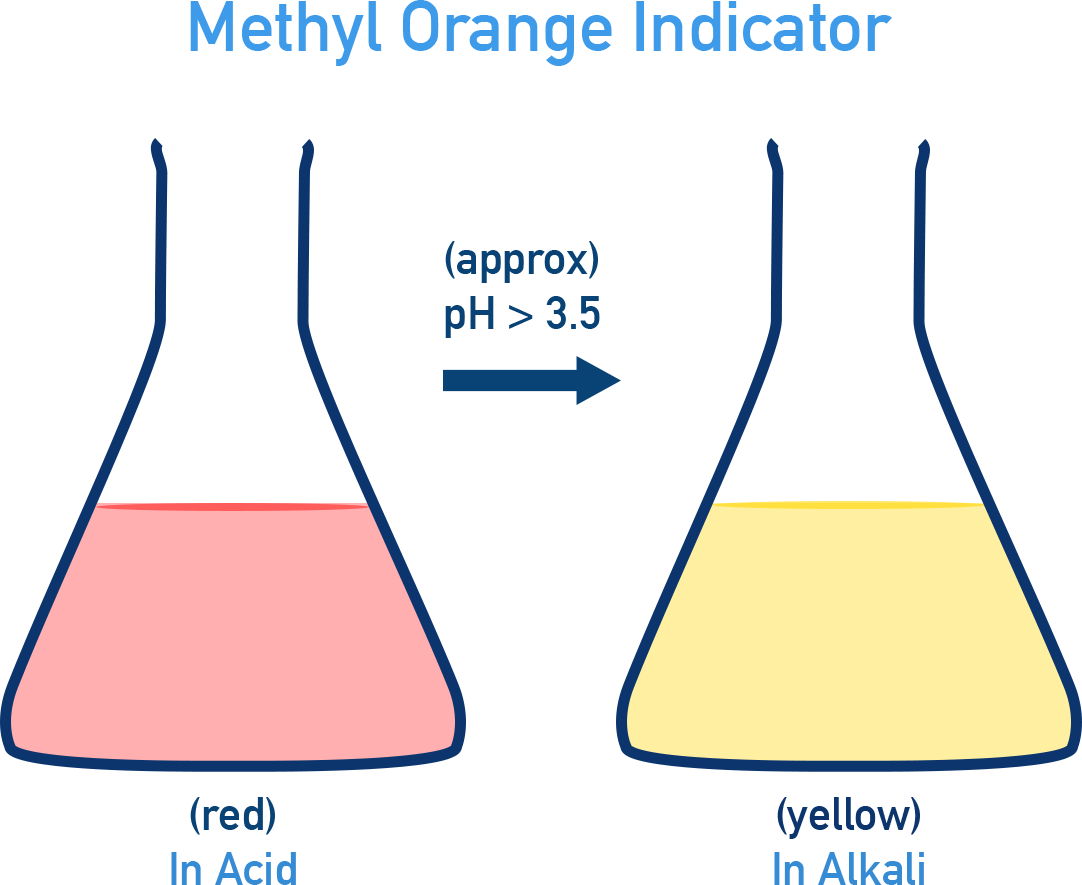
- Methyl Orange: Red (in acid) and Yellow (in base) (changes colour around pH ~3.5 – 4.5).
- Phenolphthalein: Colourless (in acid) and Pink (in base) (changes colour around pH ~8.3 – 10).
| Titration | Equivalence Point pH | Suitable Indicator |
|---|---|---|
| Strong acid vs. strong base | pH 7 | Phenolphthalein or Methyl Orange |
| Strong acid vs. weak base | pH < 7 | Methyl Orange |
| Weak acid vs. strong base | pH > 7 | Phenolphthalein |
| Weak acid vs. weak base | No sharp equivalence | pH meter required |
Determining Ka using a Titration Curve
The Ka of a weak acid can be found from its titration curve with a strong base (e.g. NaOH).
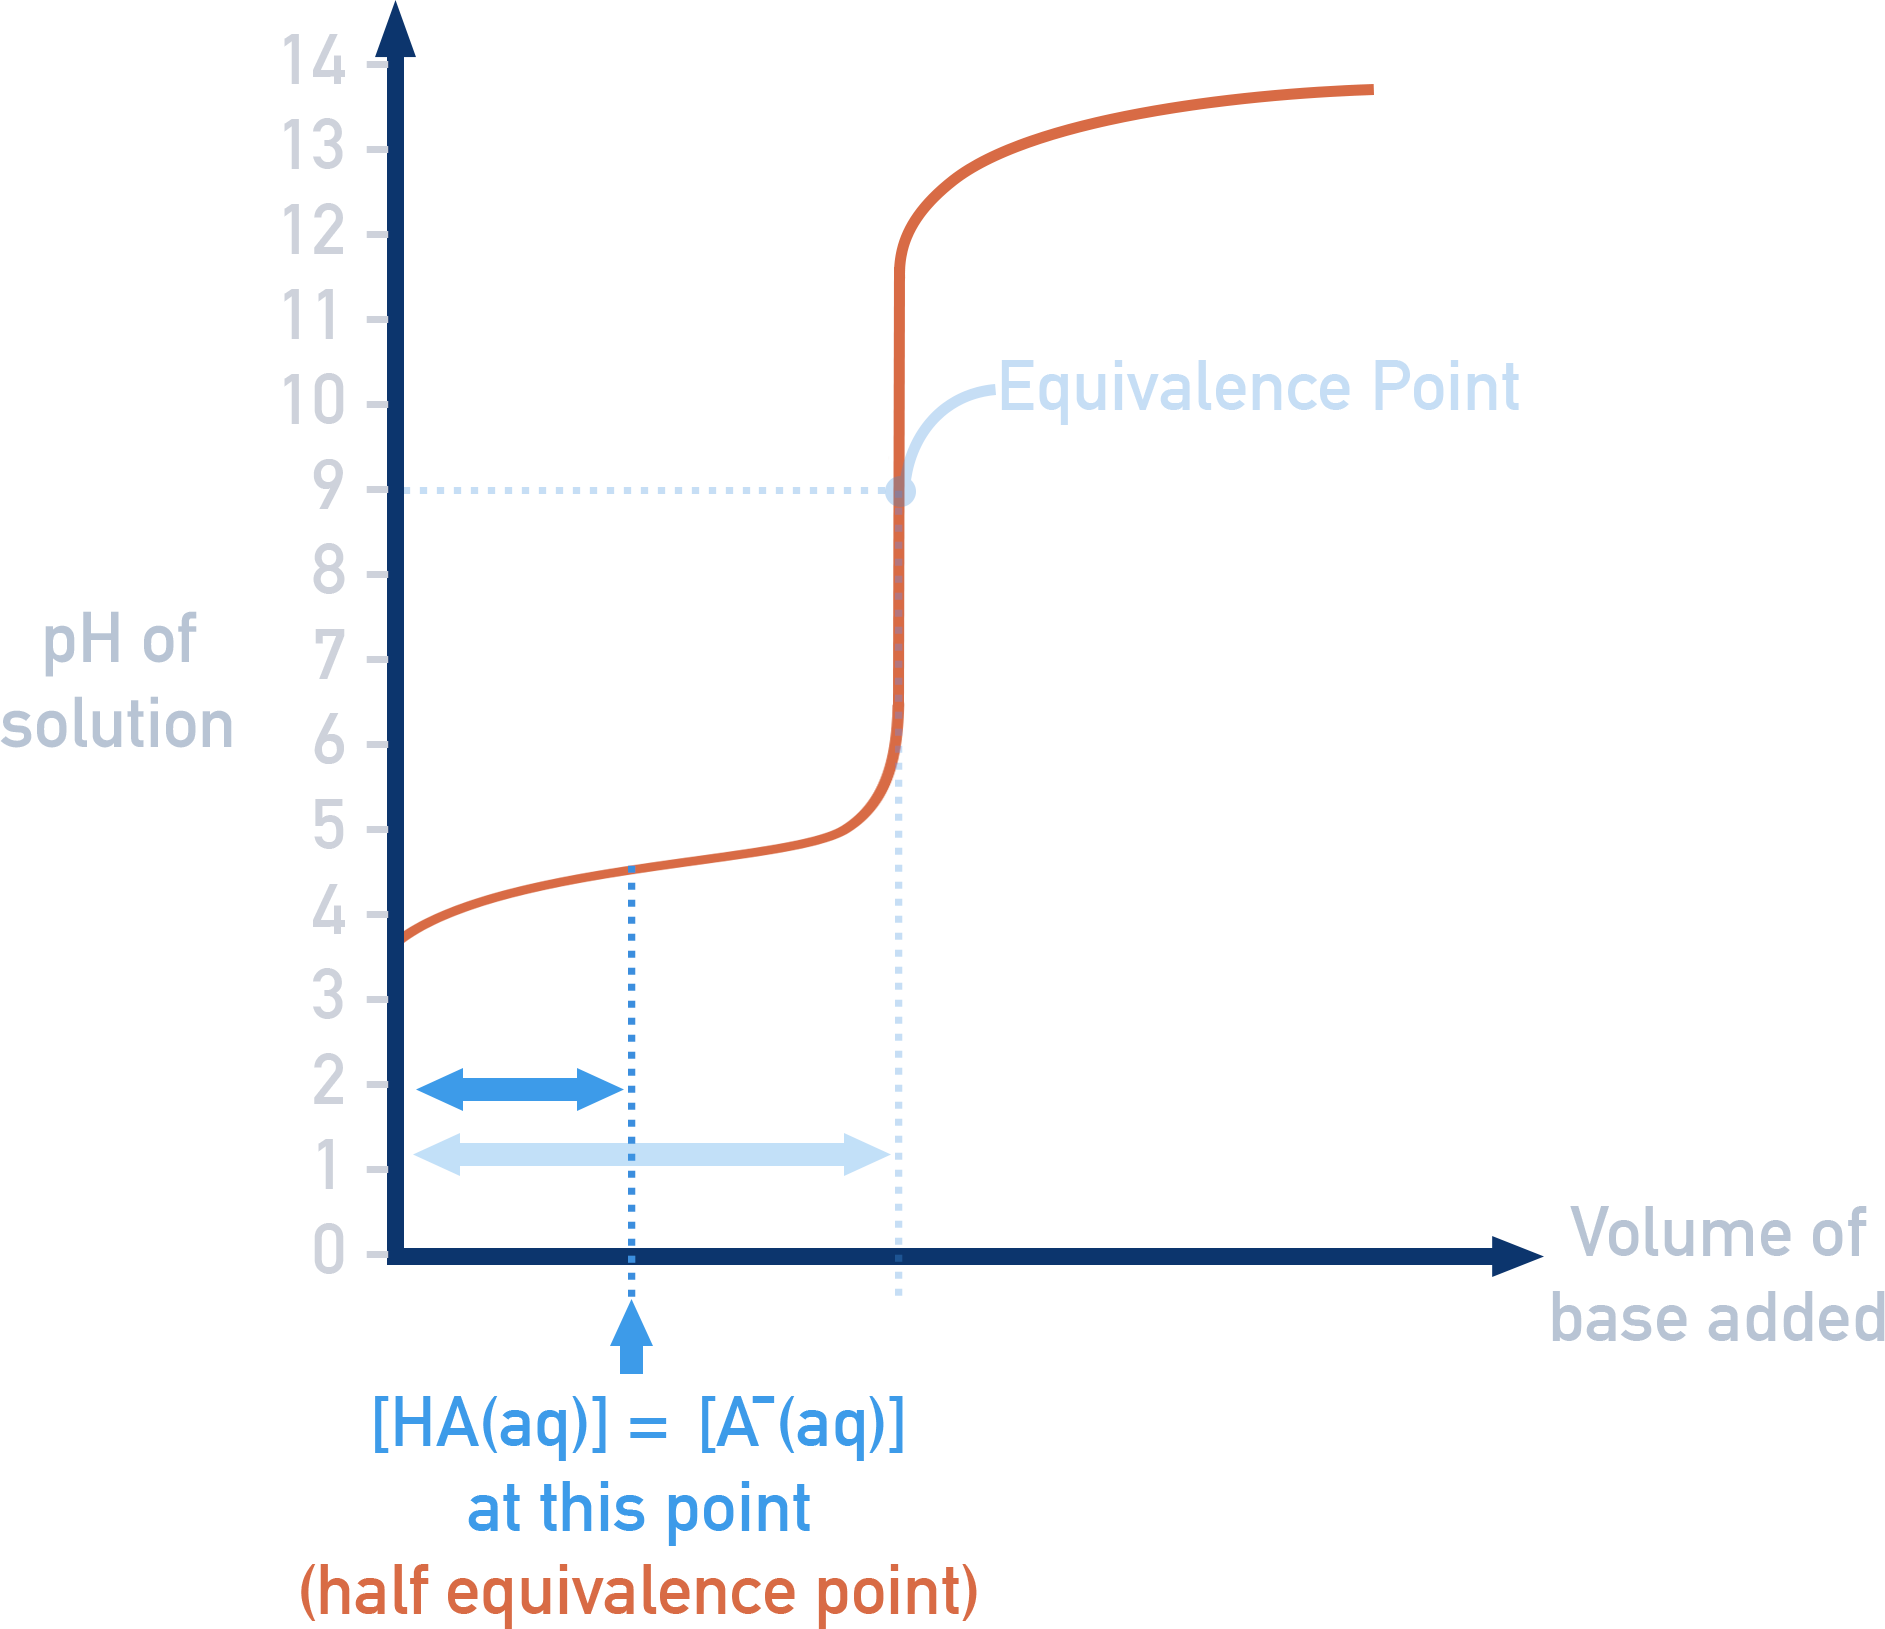
At the half-equivalence point, half of the acid has been neutralised, so:
[HA] = [A⁻]
At this point, the Ka expression simplifies to:
Ka = [H⁺]
![Edexcel A-Level Chemistry worked example showing how Ka equals [H⁺] at half-neutralisation.](images/katitration.png)
So:
Ka = 10^(–pH)
and
pKa = pH
This makes the half-equivalence point a useful way to determine Ka or pKa directly from a titration curve.
Summary
- Titration curves show how pH changes as acid or base is added.
- Different acid–base combinations give distinct curve shapes.
- Indicators must change colour in the steep part of the curve.
- Methyl Orange and Phenolphthalein are the main indicators used.
- Weak acid/weak base titrations require a pH meter.
- At half-equivalence, pH = pKa, which allows Ka to be determined.