
Kinetics II
Quick Notes
- Rate of reaction: how quickly a chemical change takes place, units mol dm−3 s−1.
- Rate equation: rate = k[A]m[B]n — shows how rate depends on concentration.
- Order: Tells us how changes in concentration affect the rate.
- Overall order: Add up the powers (orders) in the rate equation.
- Methods to determine orders of reaction:
- Initial Rate Method – Measures how rate changes with concentration.
- Continuous Monitoring – Plots concentration vs. time to determine order graphically.
- Half-life: Time it takes for a reactant’s concentration to halve.
- Rate-determining step (RDS): The slowest step in a multistep reaction and limits the overall rate.
- Activation energy (Ea) is the minimum energy particles need to react.
- Catalysts provide alternative pathways with lower activation energy.
- The Arrhenius equation links rate constant with temperature and activation energy.

Full Notes
The rate of a reaction measures how quickly a chemical change takes place. It’s usually expressed as the change in concentration of a reactant (or product) per unit time, e.g. mol dm−3 s−1.
The rate equation is a mathematical expression linking rate to concentrations of reactants:
rate = k[A]m[B]n
k is the rate constant, which varies with temperature.
m and n are the orders of reaction with respect to each reactant.
Orders of a reaction
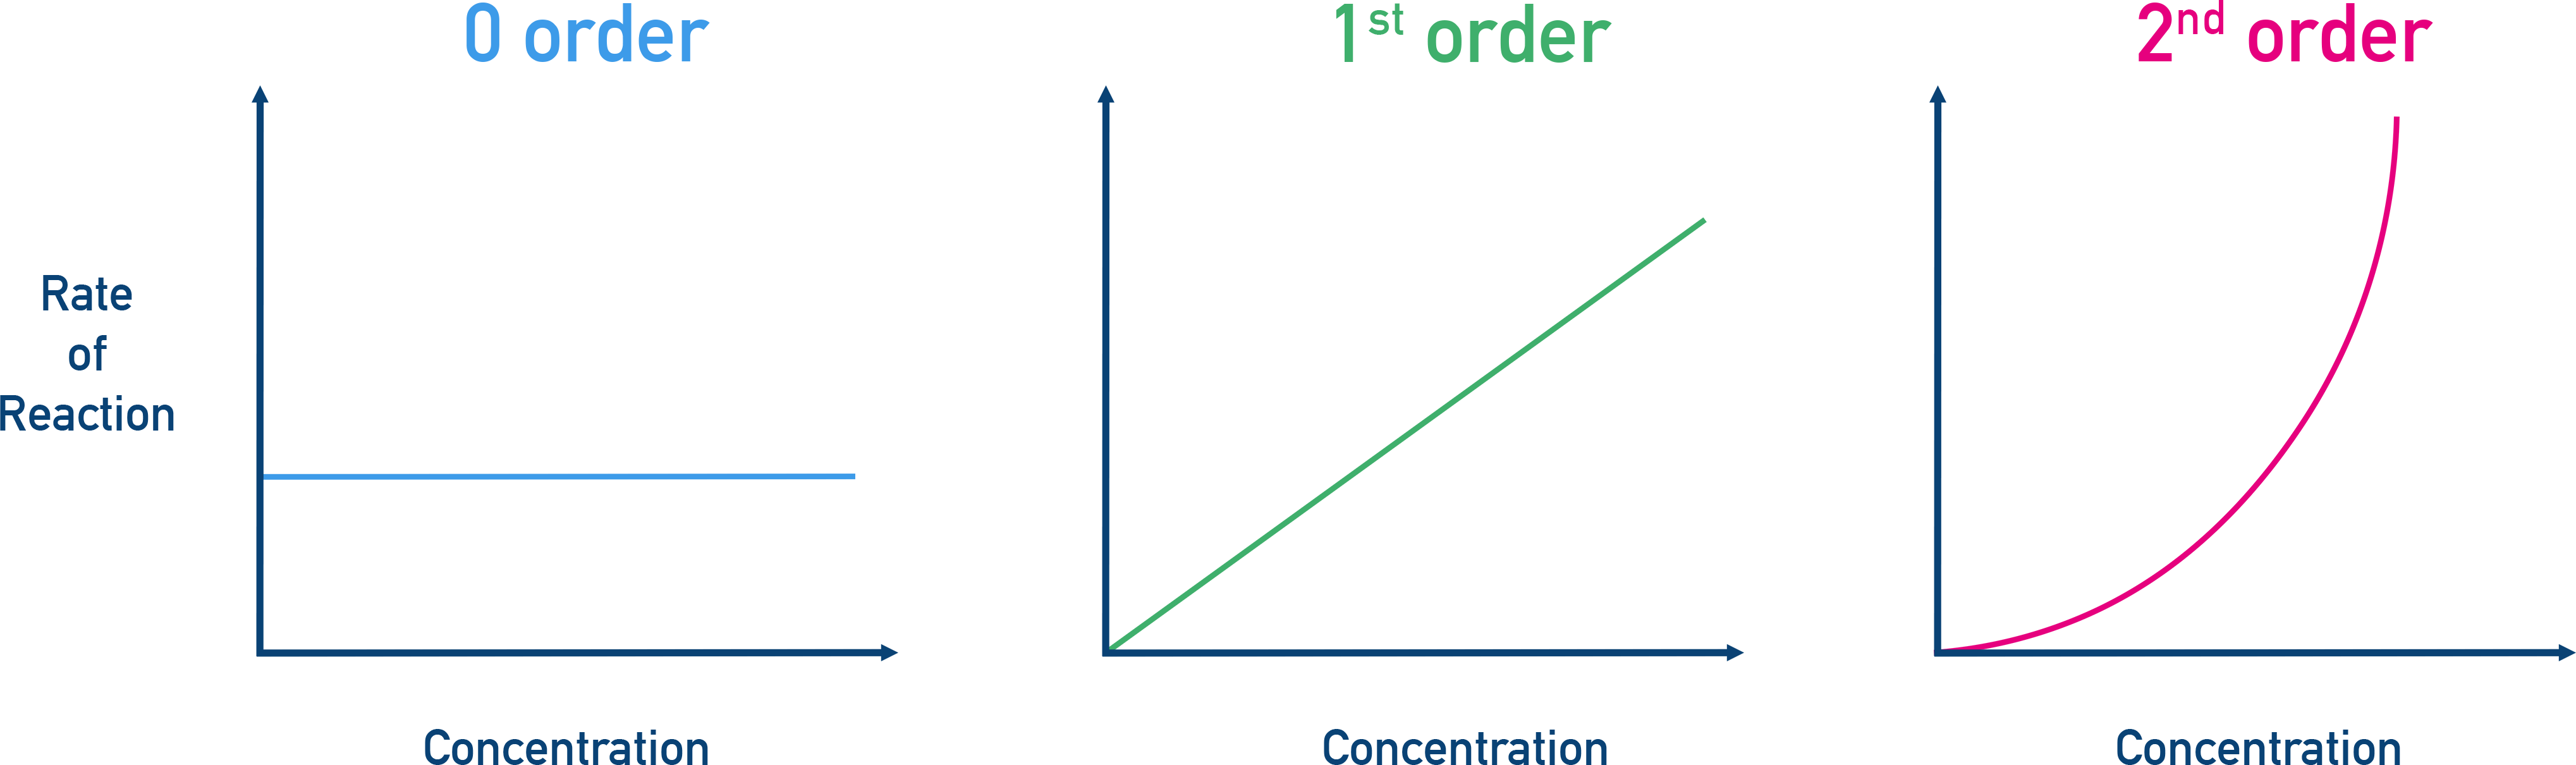
Order of reaction tells us how the rate responds to changes in concentration of a reactant:
- 0 Order: changing the concentration of the reactant doesn’t affect the rate.
- 1st Order: changing the concentration of the reactant changes the rate by the same factor (for example, rate doubles if concentration doubles).
- 2nd Order: changing the concentration of the reactant changes the rate by the same factor squared (for example, rate quadruples if concentration doubles).
Orders of reactions can only be determined experimentally.
The overall order of a reaction is the sum of all the individual orders.
Measuring Reaction Rates – Example Techniques
You should be comfortable with the following practical methods to measure rate:
- Titration ("quenching") – samples taken at regular intervals, quenched (e.g. cooled), and titrated to find concentrations. Suitable for acid–base or redox reactions.
- Colorimetry – measures colour change over time.
- Mass loss – useful if a gas is released. The loss in mass over time is recorded.
- Gas volume – gas syringes or inverted burettes can measure gases formed in the reaction.
Experimental Approaches
There are different techniques we can use to determine orders experimentally, depending on the type of reaction.
Initial Rate Method
We can measure how the initial reaction rate of a reaction changes when reactant concentrations are varied.
Steps:
- Carry out the reaction multiple times, varying one reactant concentration at a time.
- Measure the initial rate for each experiment.
- Compare how the rate changes to determine reaction order.
Reaction: A + B → Products
| exp | [A] (mol dm−3) | [B] (mol dm−3) | Initial Rate (mol dm−3 s−1) |
|---|---|---|---|
| 1 | 0.10 | 0.10 | 0.02 |
| 2 | 0.20 | 0.10 | 0.04 |
| 3 | 0.20 | 0.20 | 0.16 |
[A] has doubled from exp. 1 to exp. 2 and [B] is constant. Rate has doubled (0.02 → 0.04).
This means the reaction is first order with respect to A.
[B] has doubled from exp. 1 to exp. 3 and [A] is constant. Rate has quadrupled (×4), 0.04 → 0.16.
This means the reaction is second order with respect to B.
Thus, the rate equation is:
Rate = k [A]1 [B]2
You can also plot rate against concentration and use the shape of the graph to identify whether the reactant is 0, 1st or 2nd order.
Continuous monitoring
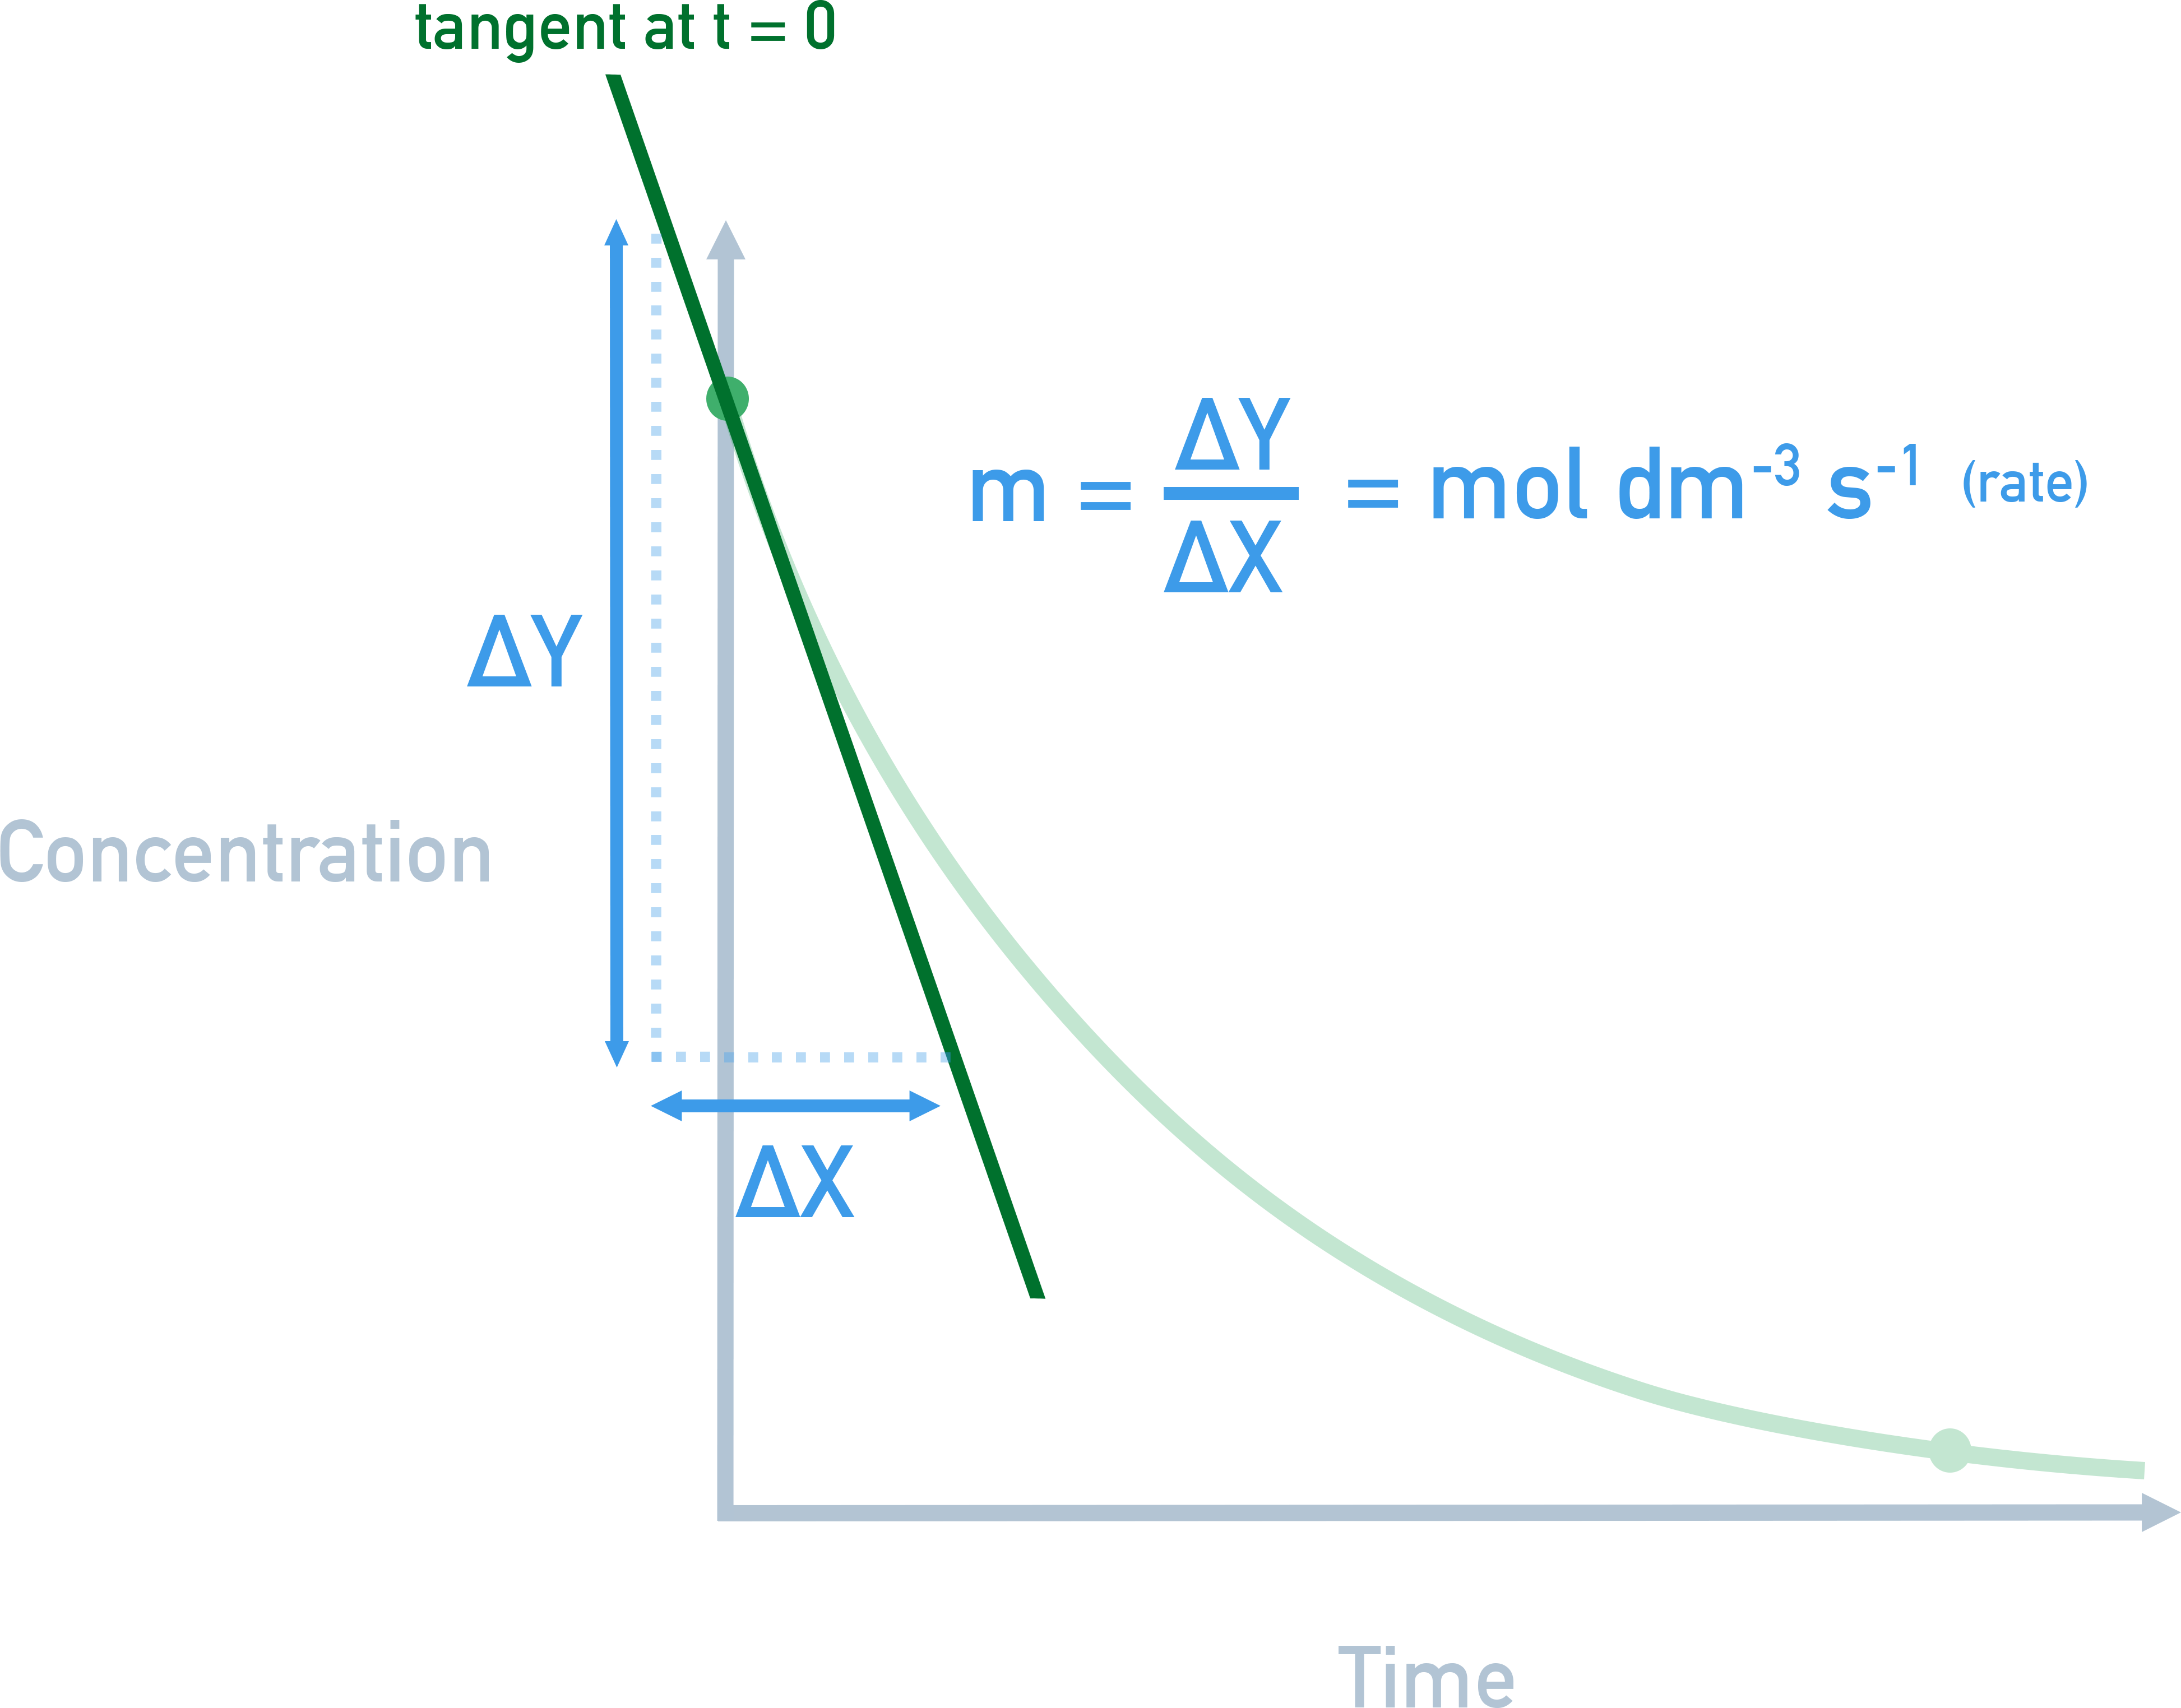
For some reactions, it is possible to measure how concentration changes over time.
This allows us to produce a graph of concentration vs time. From the graph, you can calculate the rate at any point (e.g. by drawing a tangent).
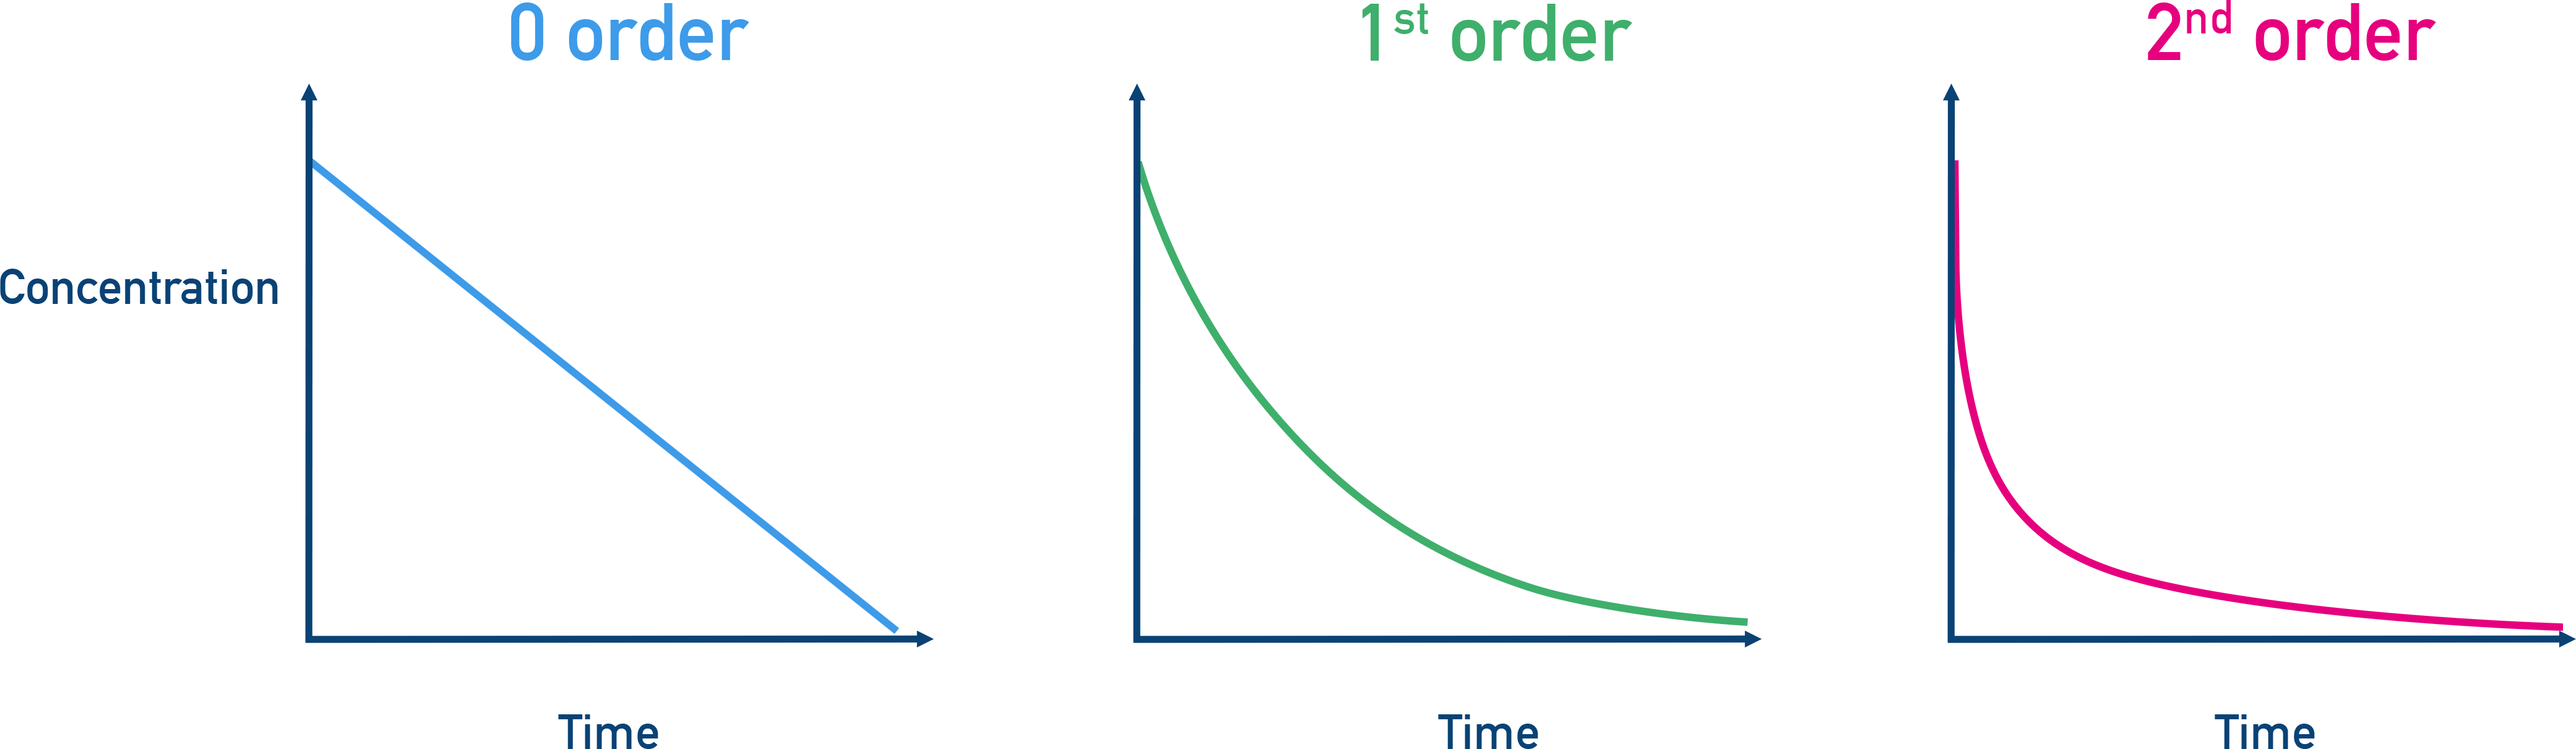
The shape of the curve can also helps deduce the order:
- Zero Order → Concentration vs. time graph is linear (constant rate).
- First Order → Concentration vs. time graph is exponential decay.
- Second Order → Concentration vs. time graph is a steeper exponential decay.
Using Rate Equations to Understand Mechanisms
Most reactions do not happen in one simple step, but in a series of steps.
These steps do not always occur at the same rate.
When looking at how fast a reaction can happen, it's the slowest step that determines the overall rate.
- The slowest step in a reaction mechanism is the Rate-Determining Step (RDS).
- Only species in the RDS appear in the rate equation.
Example Reaction: NO2 + CO → NO + CO2
The rate equation is Rate = k [NO2]2, because CO isn’t in the rate equation, we know it isn’t involved in the rate determining step (RDS).
Possible Mechanism:
NO2 + NO2 → NO3 + NO (slow)
NO3 + CO → NO2 + CO2 (fast)
Step 1 is the slow step (RDS) and doesn’t include CO.

Remember that mechanisms are proposed using rate equations. They are only predictions, there may be more than one possible mechanism for a given rate equation.
Kinetics of Acid-Catalysed Iodination of Propanone
The acid-catalysed iodination of propanone is often used as an example to determine a rate equation and propose a mechanism.
Obtaining Data to Determine Reaction Orders
The reaction:
CH3COCH3 + I2 → CH2ICOCH3 + HI (acid-catalysed)
- Iodine (I2) is yellow-brown in solution, and its concentration decreases as the reaction proceeds.
- The loss of I2’s colour can be measured using a colorimeter, which records absorbance over time.
- This allows accurate determination of the rate of iodine disappearance, which is proportional to the rate of reaction.
- By repeating the experiment with varying concentrations of propanone, iodine, and acid, and measuring initial rates, you can determine the order with respect to each reactant.
Typical experimental result:
Rate = k[CH3COCH3][H+]
i.e., first order in propanone and H+, zero order in iodine.
Using Rate Data to Predict Species in the Rate-Determining Step
- The rate being independent of [I2] suggests iodine is not involved in the slow step.
- Therefore, only propanone and H+ are involved in the rate-determining step.
Deducing a Possible Mechanism
- Slow step: Acid catalyses formation of an enol intermediate from propanone (involving both CH3COCH3 and H+).
- Fast step: Enol reacts with I2 to form the iodinated product.
Proposed mechanism:
- CH3COCH3 + H+ → Enol (slow)
- Enol + I2 → CH2ICOCH3 + HI (fast)
Hydrolysis of Halogenoalkanes: Rate Equations as Evidence for SN1 or SN2
The rate equation for the hydrolysis of a halogenoalkane gives information and evidence about the mechanism that it follows.
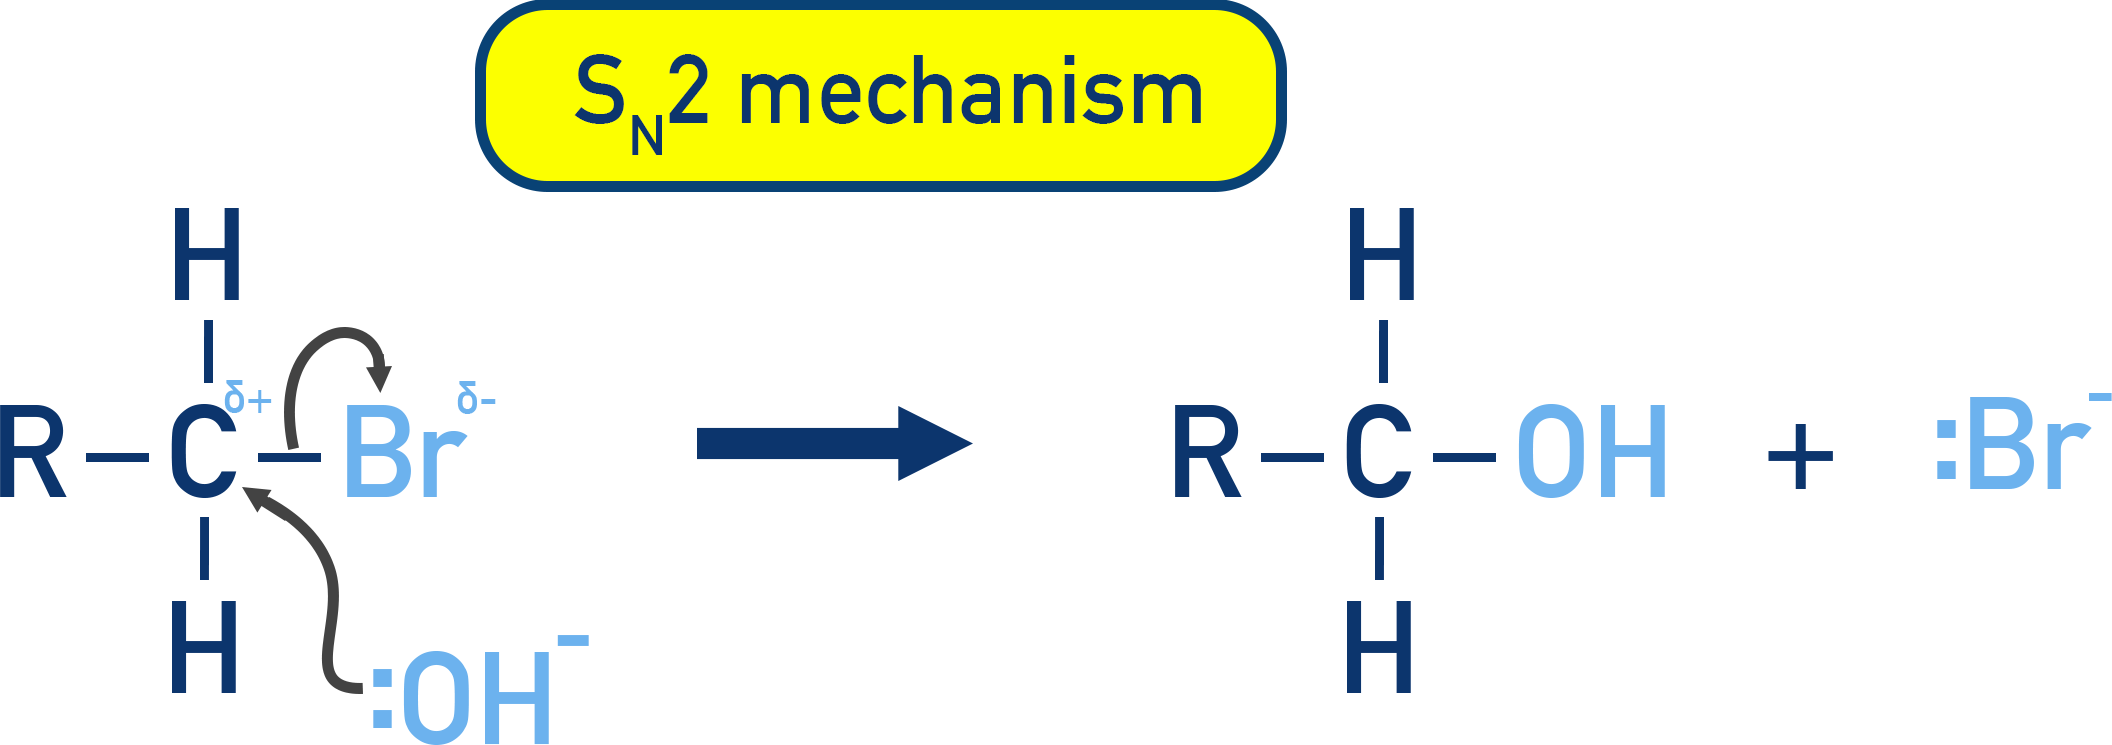
Primary Halogenoalkanes - SN2
For the hydrolysis of primary halogenoalkanes, the rate equation is:
Rate = k[halogenoalkane][OH−]
This shows both reactants are involved in the rate-determining step, providing evidence for a one-step mechanism (SN2).
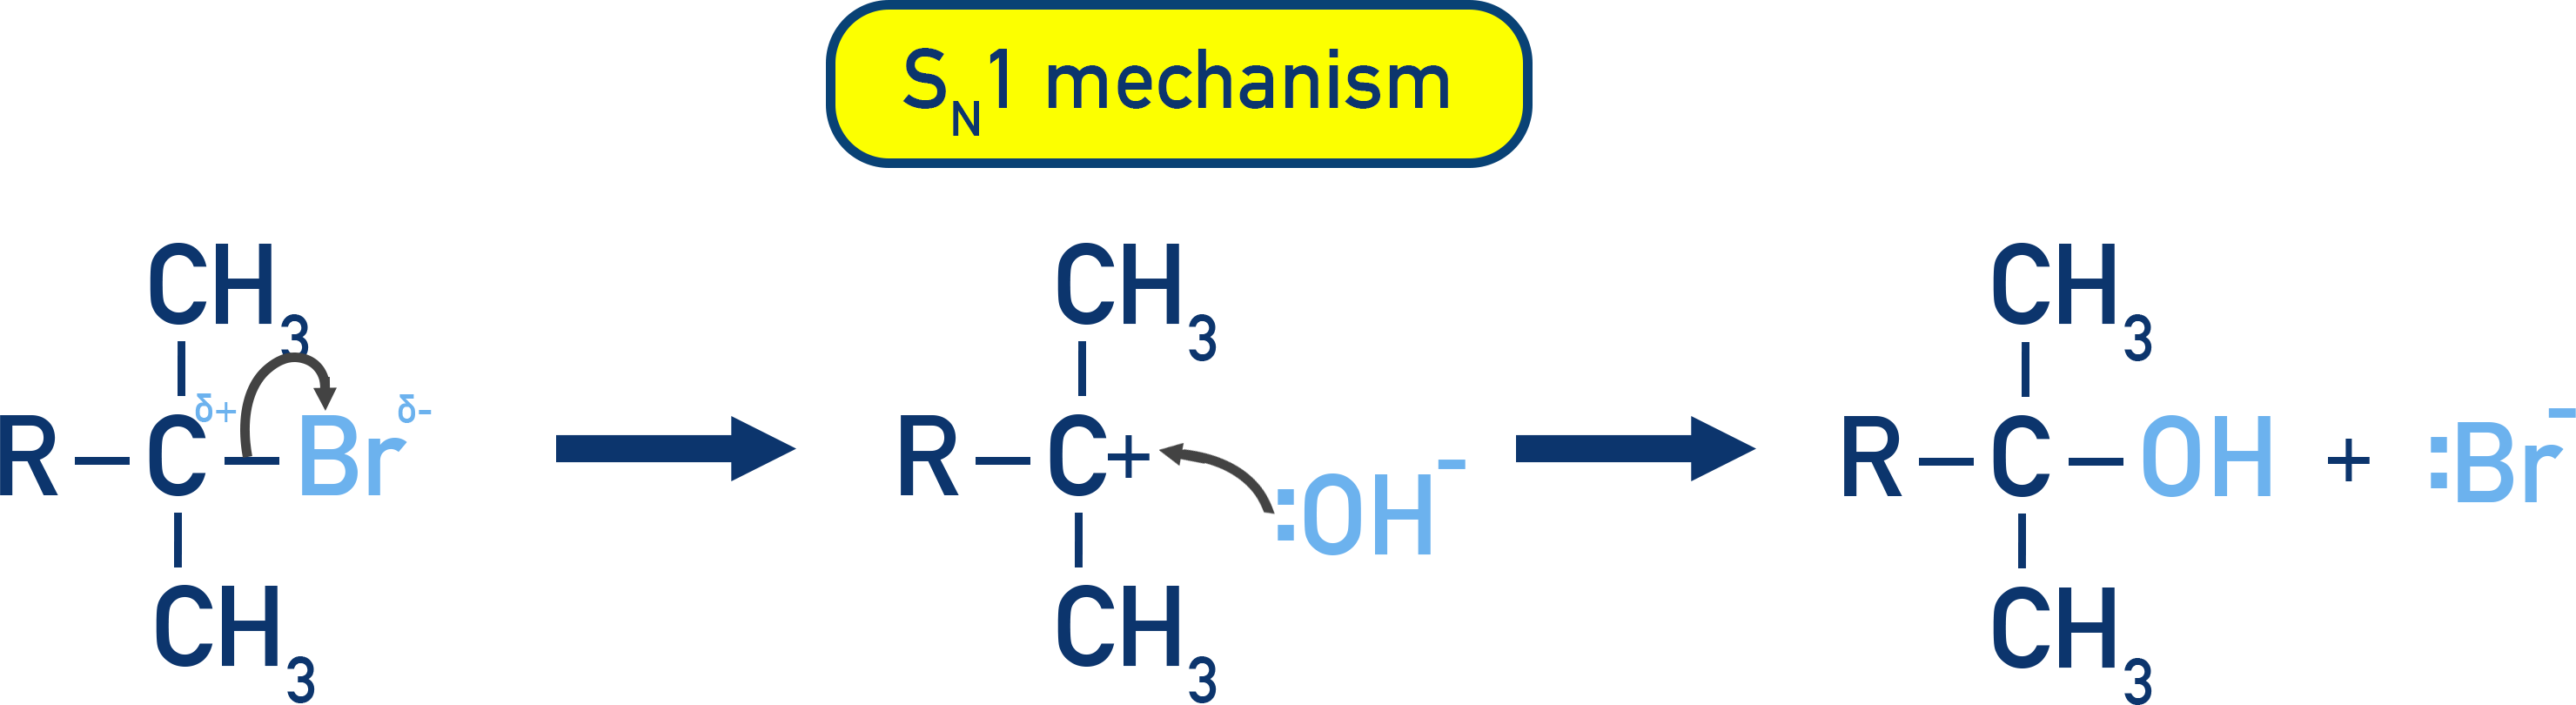
Primary Halogenoalkanes - SN1
For the hydrolysis of tertiary halogenoalkanes, the rate equation is:
Rate = k[halogenoalkane]
Since OH− doesn't appear in the rate equation, it suggests a two-step mechanism (SN1), with carbocation formation as the slow, rate-determining step.
Activation Energy and the Arrhenius Equation
The Arrhenius equation shows how activation energy (Ea), temperature (T) and the proportion of collisions with correct orientation (A) can be linked together by the rate constant, k.
where:
- A = Arrhenius constant (collision frequency factor).
- Ea = Activation energy (J mol−1).
- R = Gas constant (8.31 J mol−1 K−1).
- T = Temperature (K).
This also shows why k increases with temperature - the e−Ea/RT part of the expression gets bigger as T increases.
The Arrhenius equation is an exponential equation because it contains ‘e’. To make it easier to work with, we can rearrange it to a straight line form by multiplying both sides by ln:
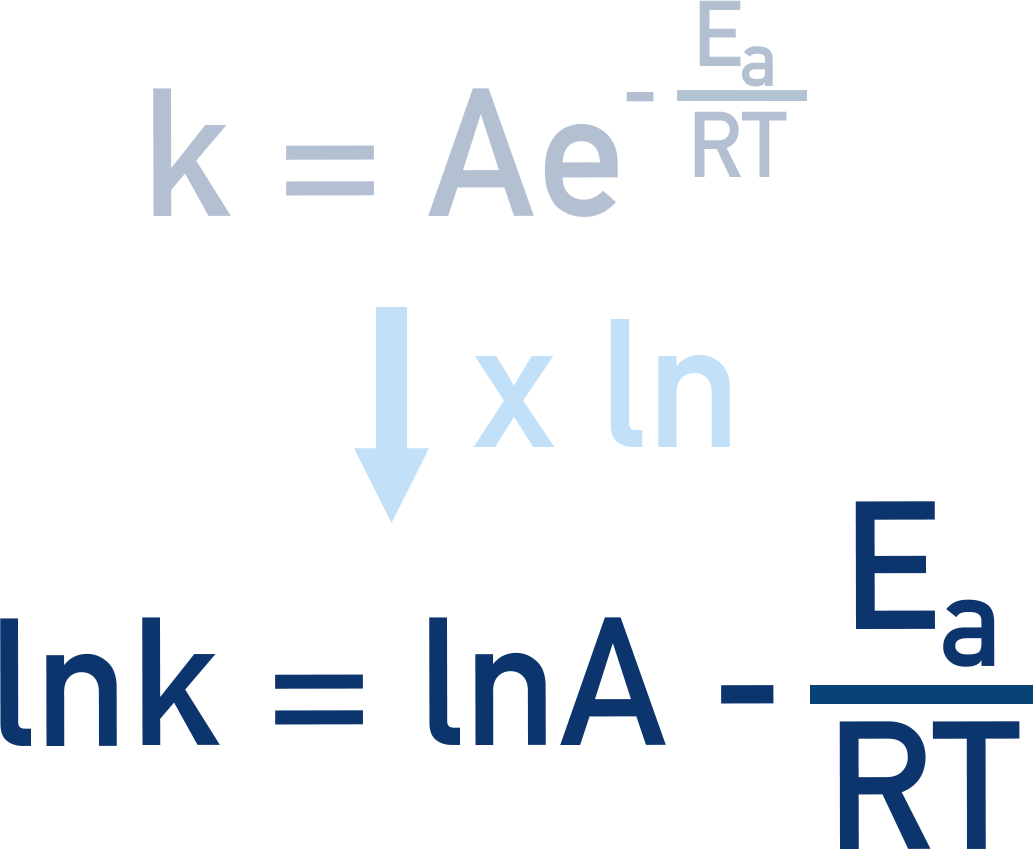
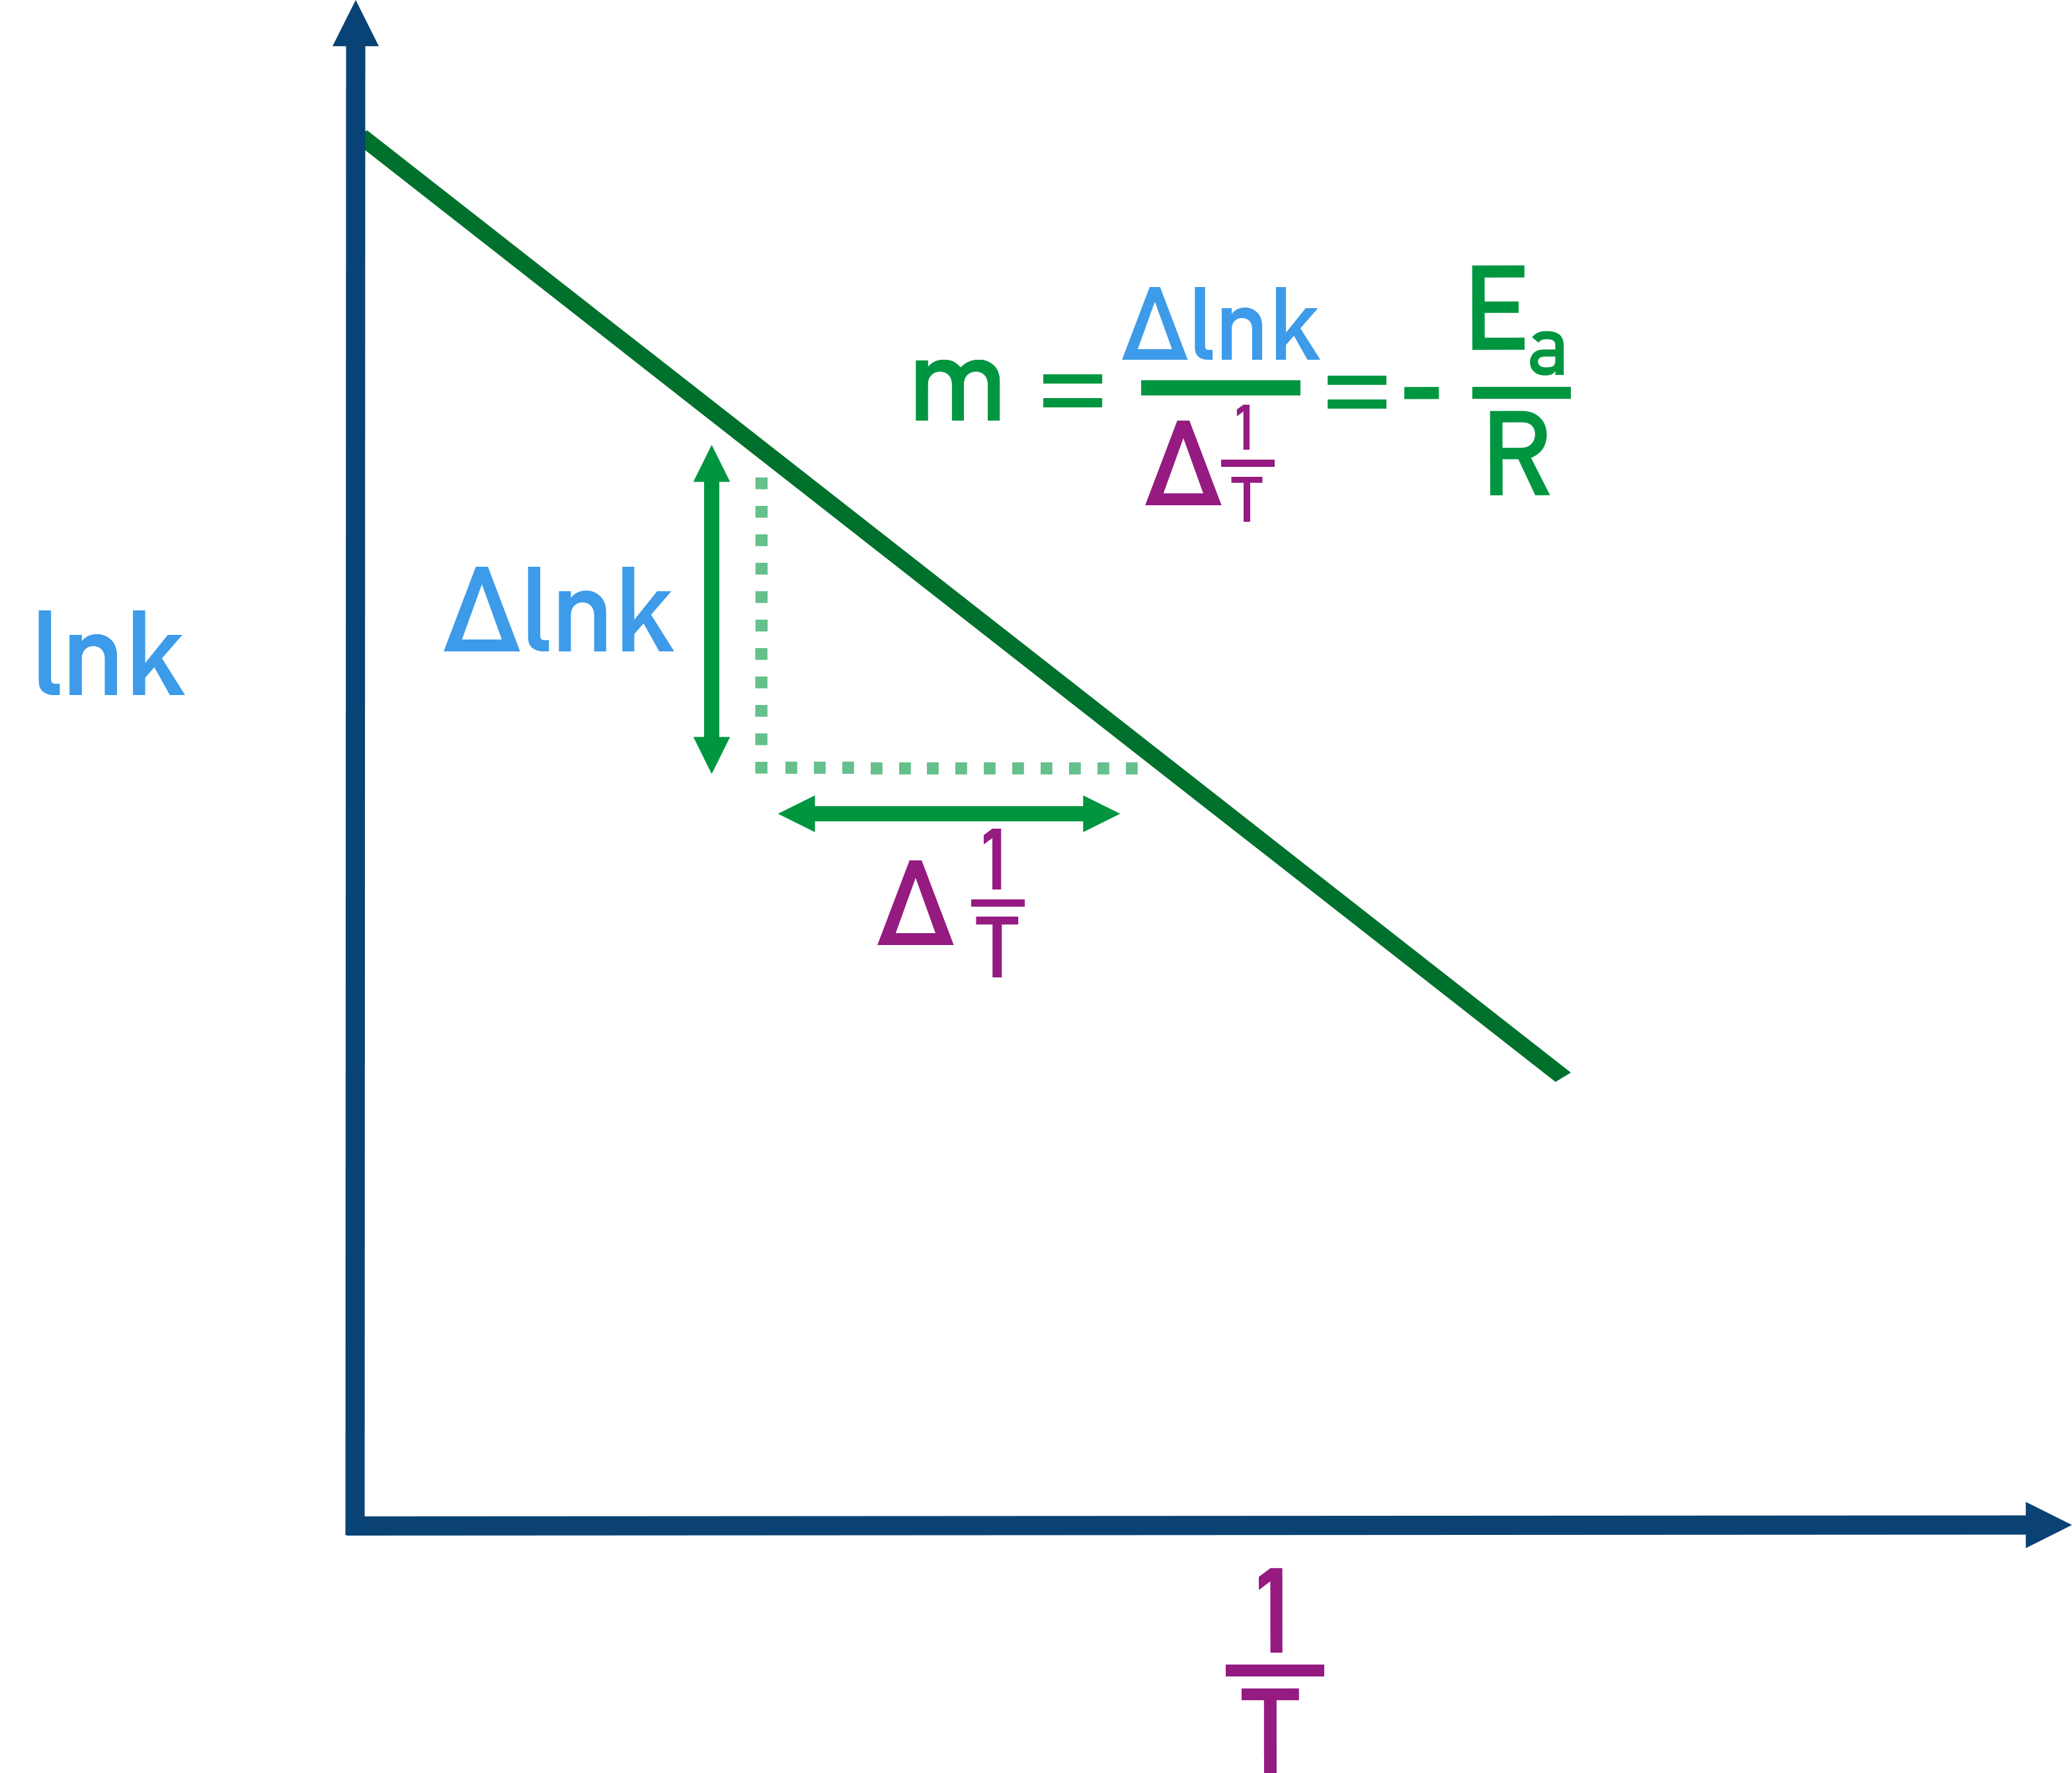
This allows us to plot ln k vs. 1/T (called an Arrhenius plot). The gradient of the line = −Ea / R, allowing activation energy calculation.
−Ea÷R = m
Ea = − m × R
Performing Arrhenius Equation Calculations
When using the Arrhenius equation in calculations, don’t forget units of activation energy (Ea) are kJ mol^-1! The gas constant, R, has units of J K^-1 mol^-1, meaning you must convert any calculated Ea value to kJ (divide by 1000).
1. Calculate Activation Energy (Ea) Using Two Rate Constants
Determine the activation energy (Eₐ) when the following rate constants are measured at two different temperatures:
- At 300 K, k₁ = 2.5 × 10⁻³ s⁻¹
- At 350 K, k₂ = 5.0 × 10⁻³ s⁻¹
Arrhenius equation (two-point form):
ln (k₂ / k₁) = (–Eₐ / R) × (1/T₂ – 1/T₁)
Step 1: Substitute known values
ln (5.0 × 10⁻³ / 2.5 × 10⁻³) = (–Eₐ / 8.31) × (1/350 – 1/300)
Step 2: Simplify
ln 2 = (–Eₐ / 8.31) × (–4.76 × 10⁻⁴)
Step 3: Rearrange for Eₐ
Eₐ = (ln 2 × 8.31) / (4.76 × 10⁻⁴)
Final Answer:
Eₐ = 12 110 J mol⁻¹ = 12.1 kJ mol⁻¹
2. Using Arrhenius Graph to Find Activation Energy
The gradient of an Arrhenius plot is −Ea÷R. By plotting ln k vs. 1÷T, we can use the gradient of the straight line to find Ea.
- Plot ln k vs. 1/T.
- The gradient = −Ea / R.
- Multiply the gradient by −8.31 to find Ea.
Summary
- Rate equations show how rate depends on reactant concentrations
- Orders are found experimentally using initial rates or continuous monitoring
- The slowest step controls the overall rate and species in the RDS appear in the rate equation
- SN2 shows bimolecular rate while SN1 is unimolecular in the rate-determining step
- Arrhenius links k to temperature and Ea and its linear form lets you find Ea from a plot