
Mass spectrometry
Quick Notes
- Mass spectrometry can be used to identify organic compounds using mass-to-charge ratio (m/z) of molecular ions.
- The molecular ion peak (M⁺) gives the relative molecular mass (Mr).
- Smaller peaks are caused by fragmentation, the breakdown of the molecular ion.
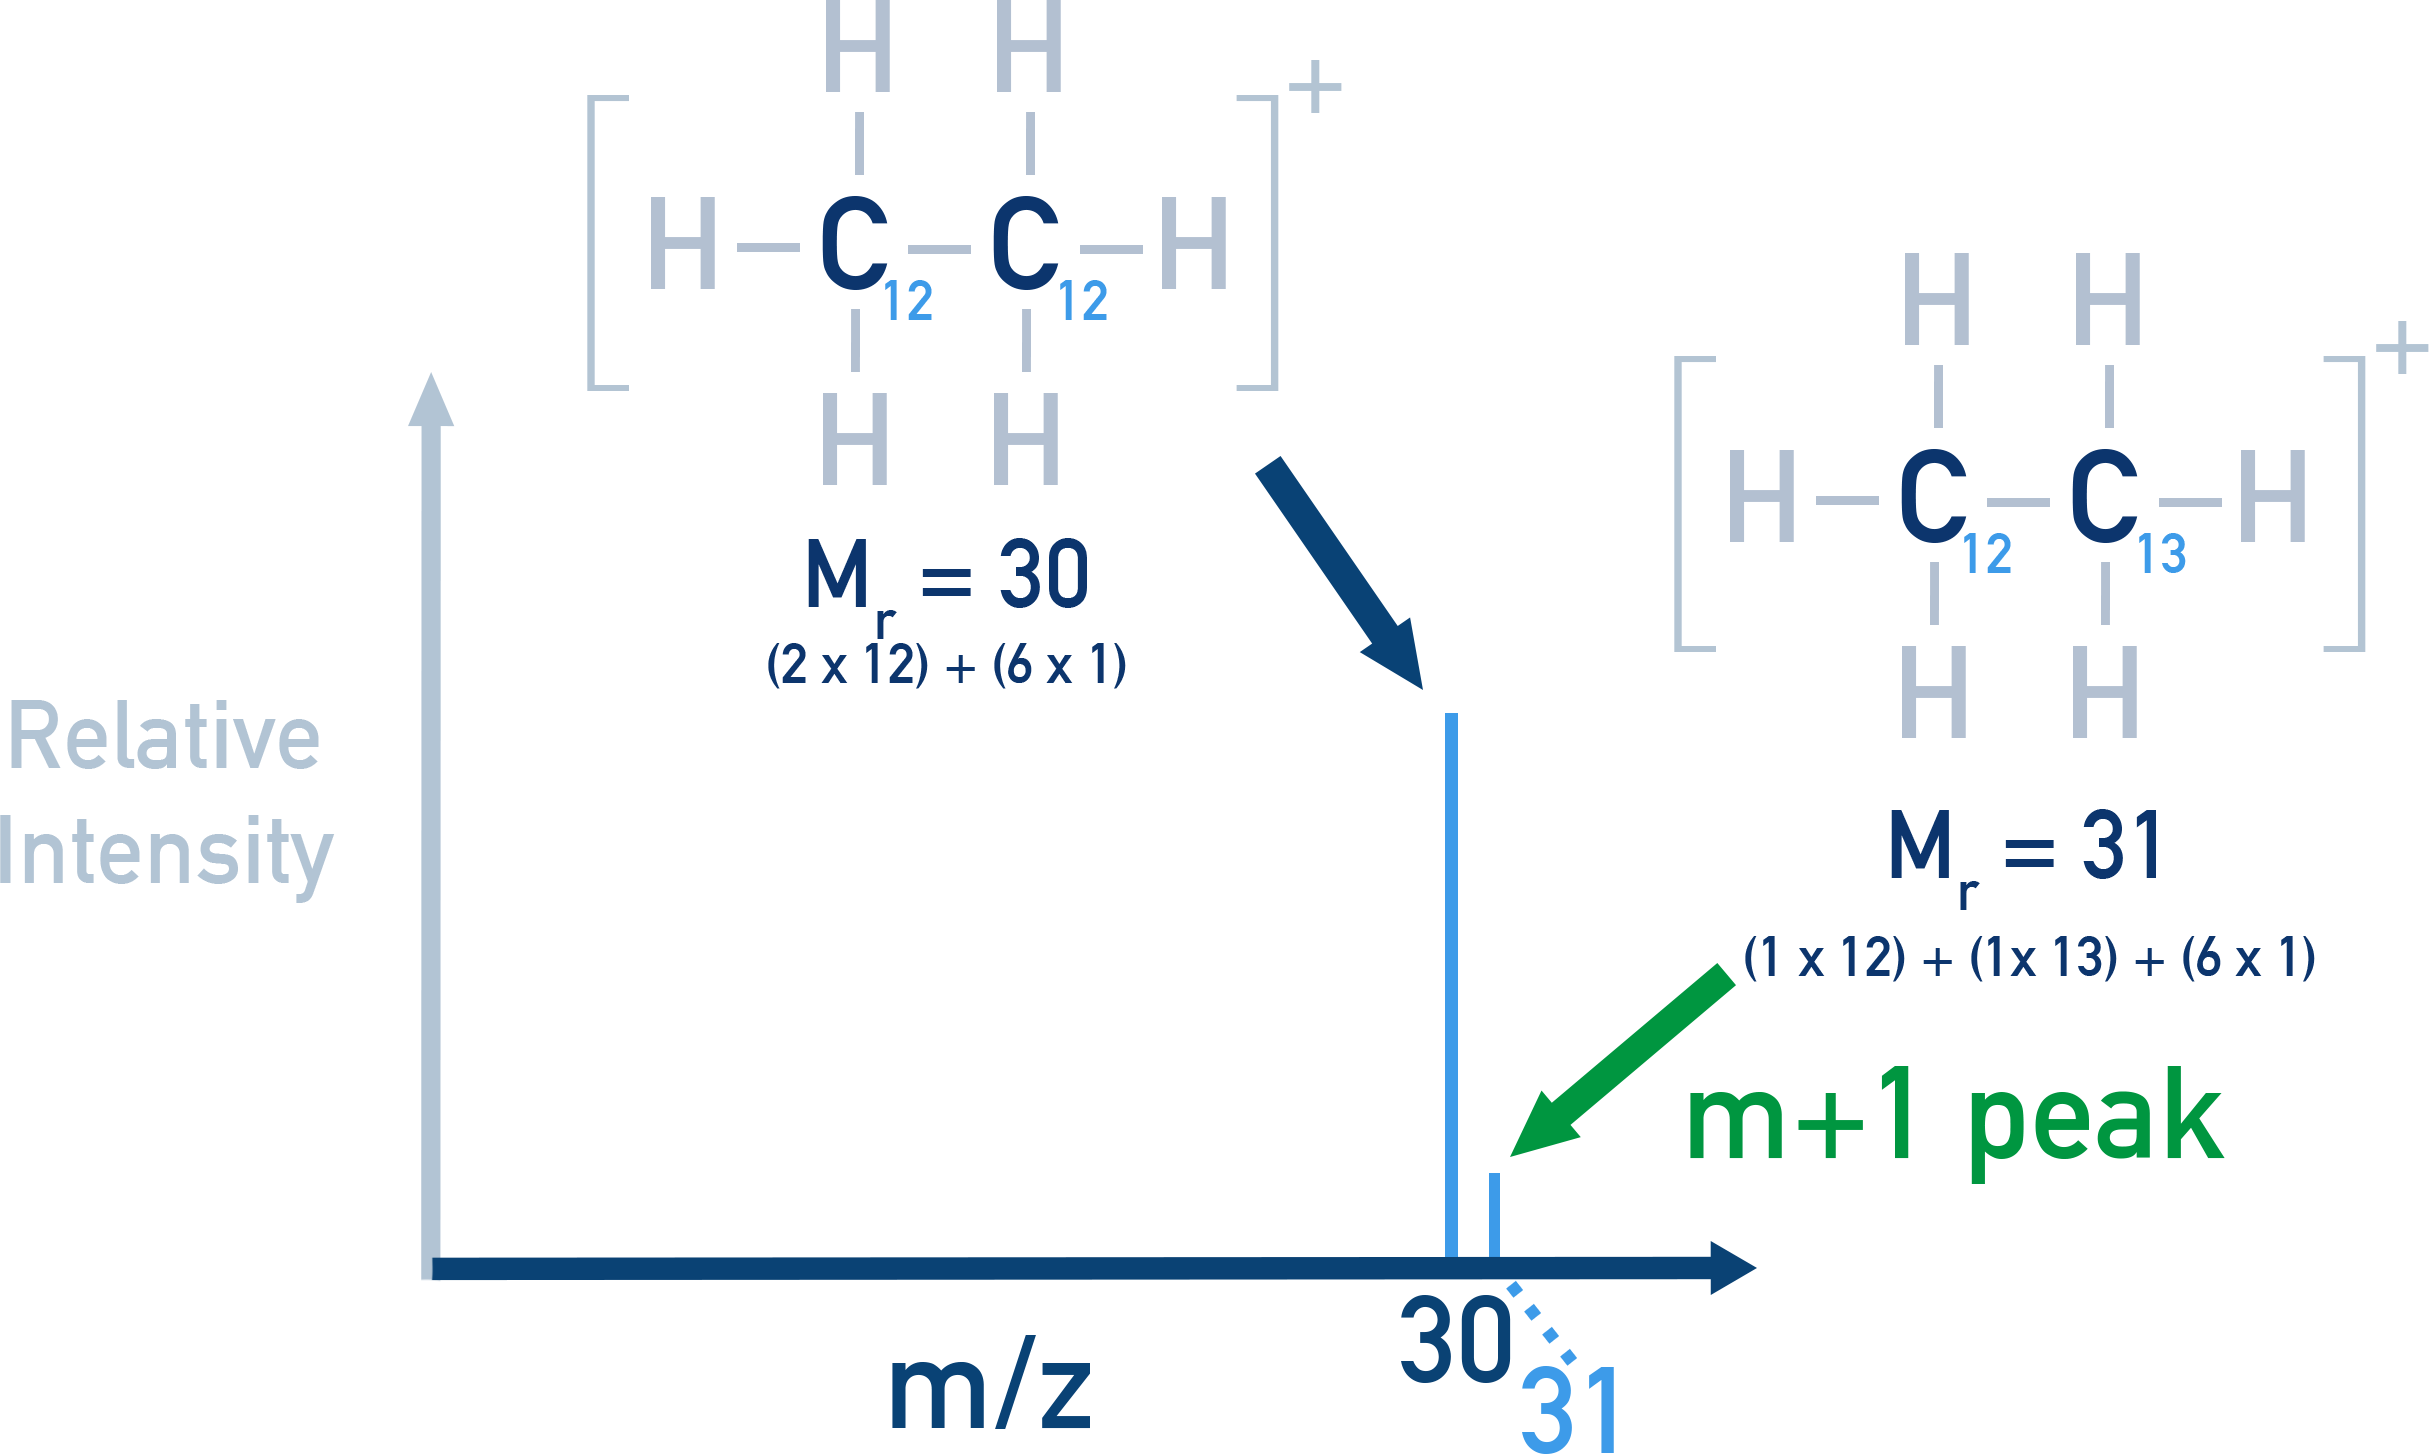
- [M+1]⁺ peaks indicate the presence of carbon-13 isotopes.
- [M+2]⁺ peaks reveal the presence of chlorine (3:1 ratio) or bromine (1:1 ratio) due to their isotopes.
Full Notes
Mass Spectrometry and how it works is covered in more detail
here.
This page is just what you need to know for Edexcel A-level :)
The Basics
- A sample is ionised to form positive ions.
- Ions are accelerated , deflected and separated based on their mass-to-charge ratio (m/z).
- The detector records the ions, producing a mass spectrum.
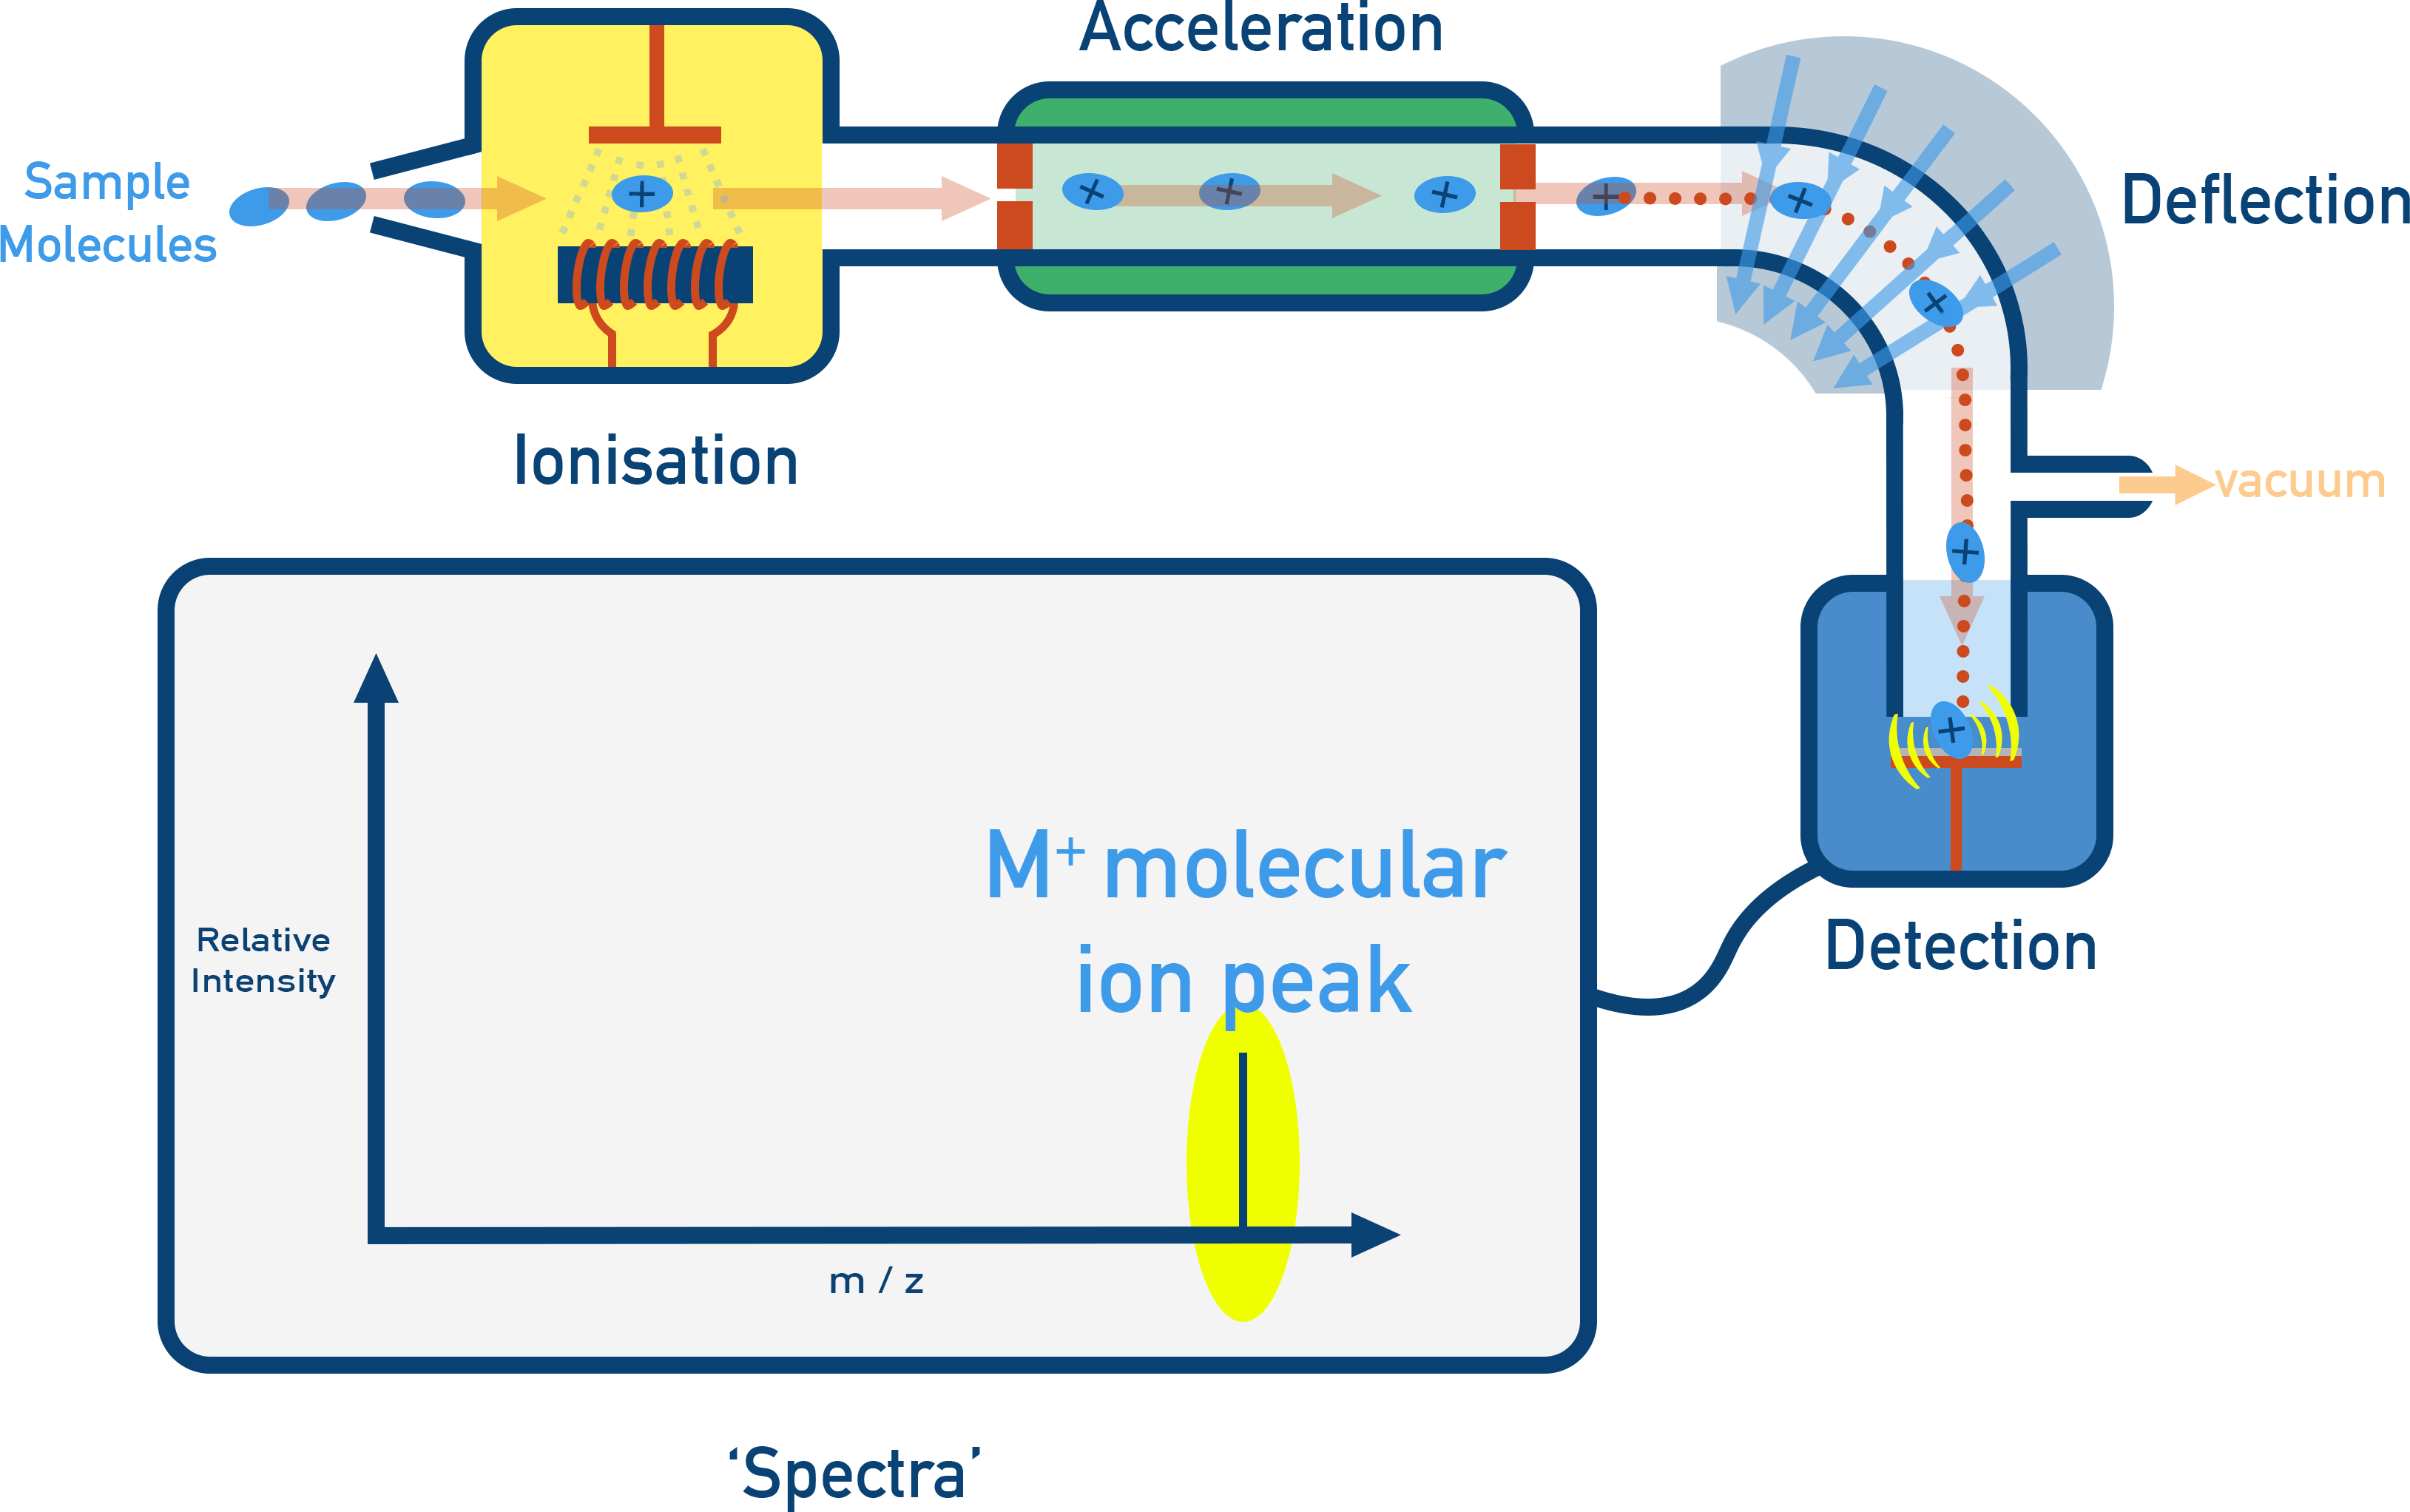
The molecular ion peak (M⁺) represents the relative molecular mass (Mr) of the compound.
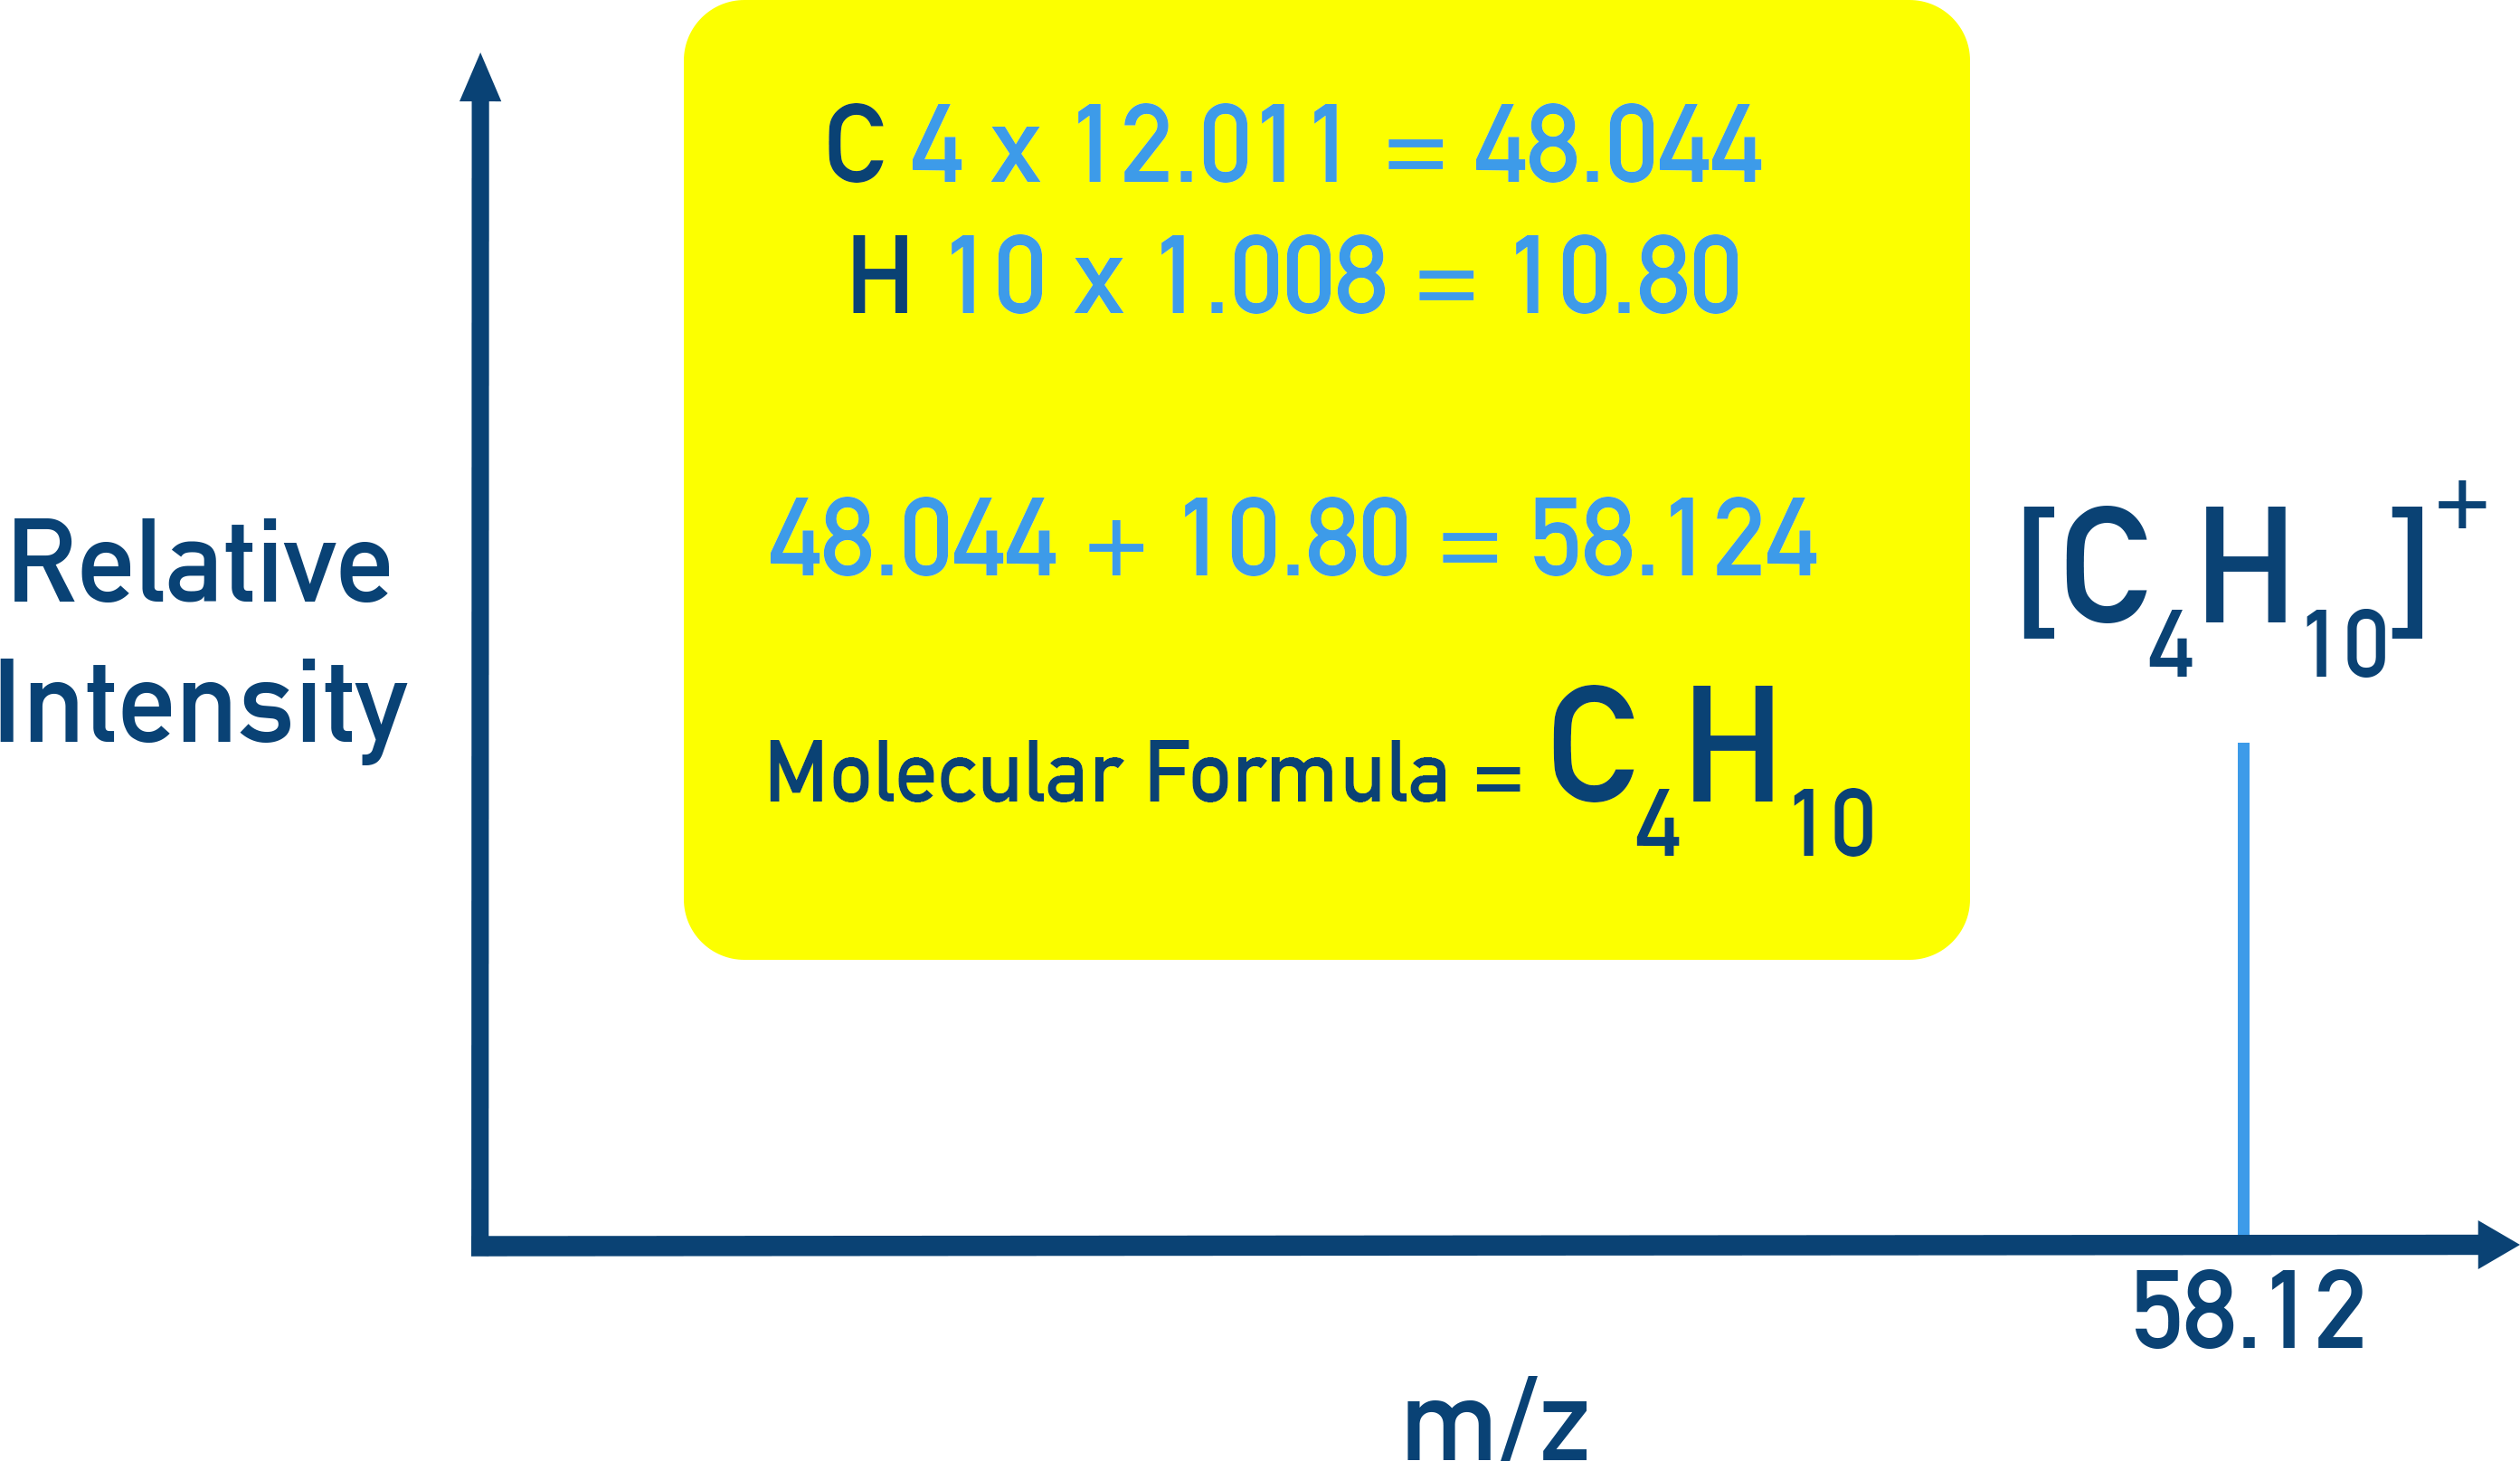
Identifying Molecular Mass and Formula
The molecular ion peak (M⁺) in a spectra has the highest m/z value.
We can use precise atomic masses to confirm the molecular formula based on the M+ peak.
For Example: Determining the molecular formula of a compound with M⁺ = 58.12
Fragmentation
Inside a mass spectrometer, molecular ions can break into fragments.
Each fragment forms a smaller ion and shows up as a peak at a lower m/z.
These peaks help identify parts of the molecule.
For example, Hydrocarbons A and B both have a molecular formula of C4H10 (same molecular ion peak), however they have different fragment patterns in their spectra, showing different structures,
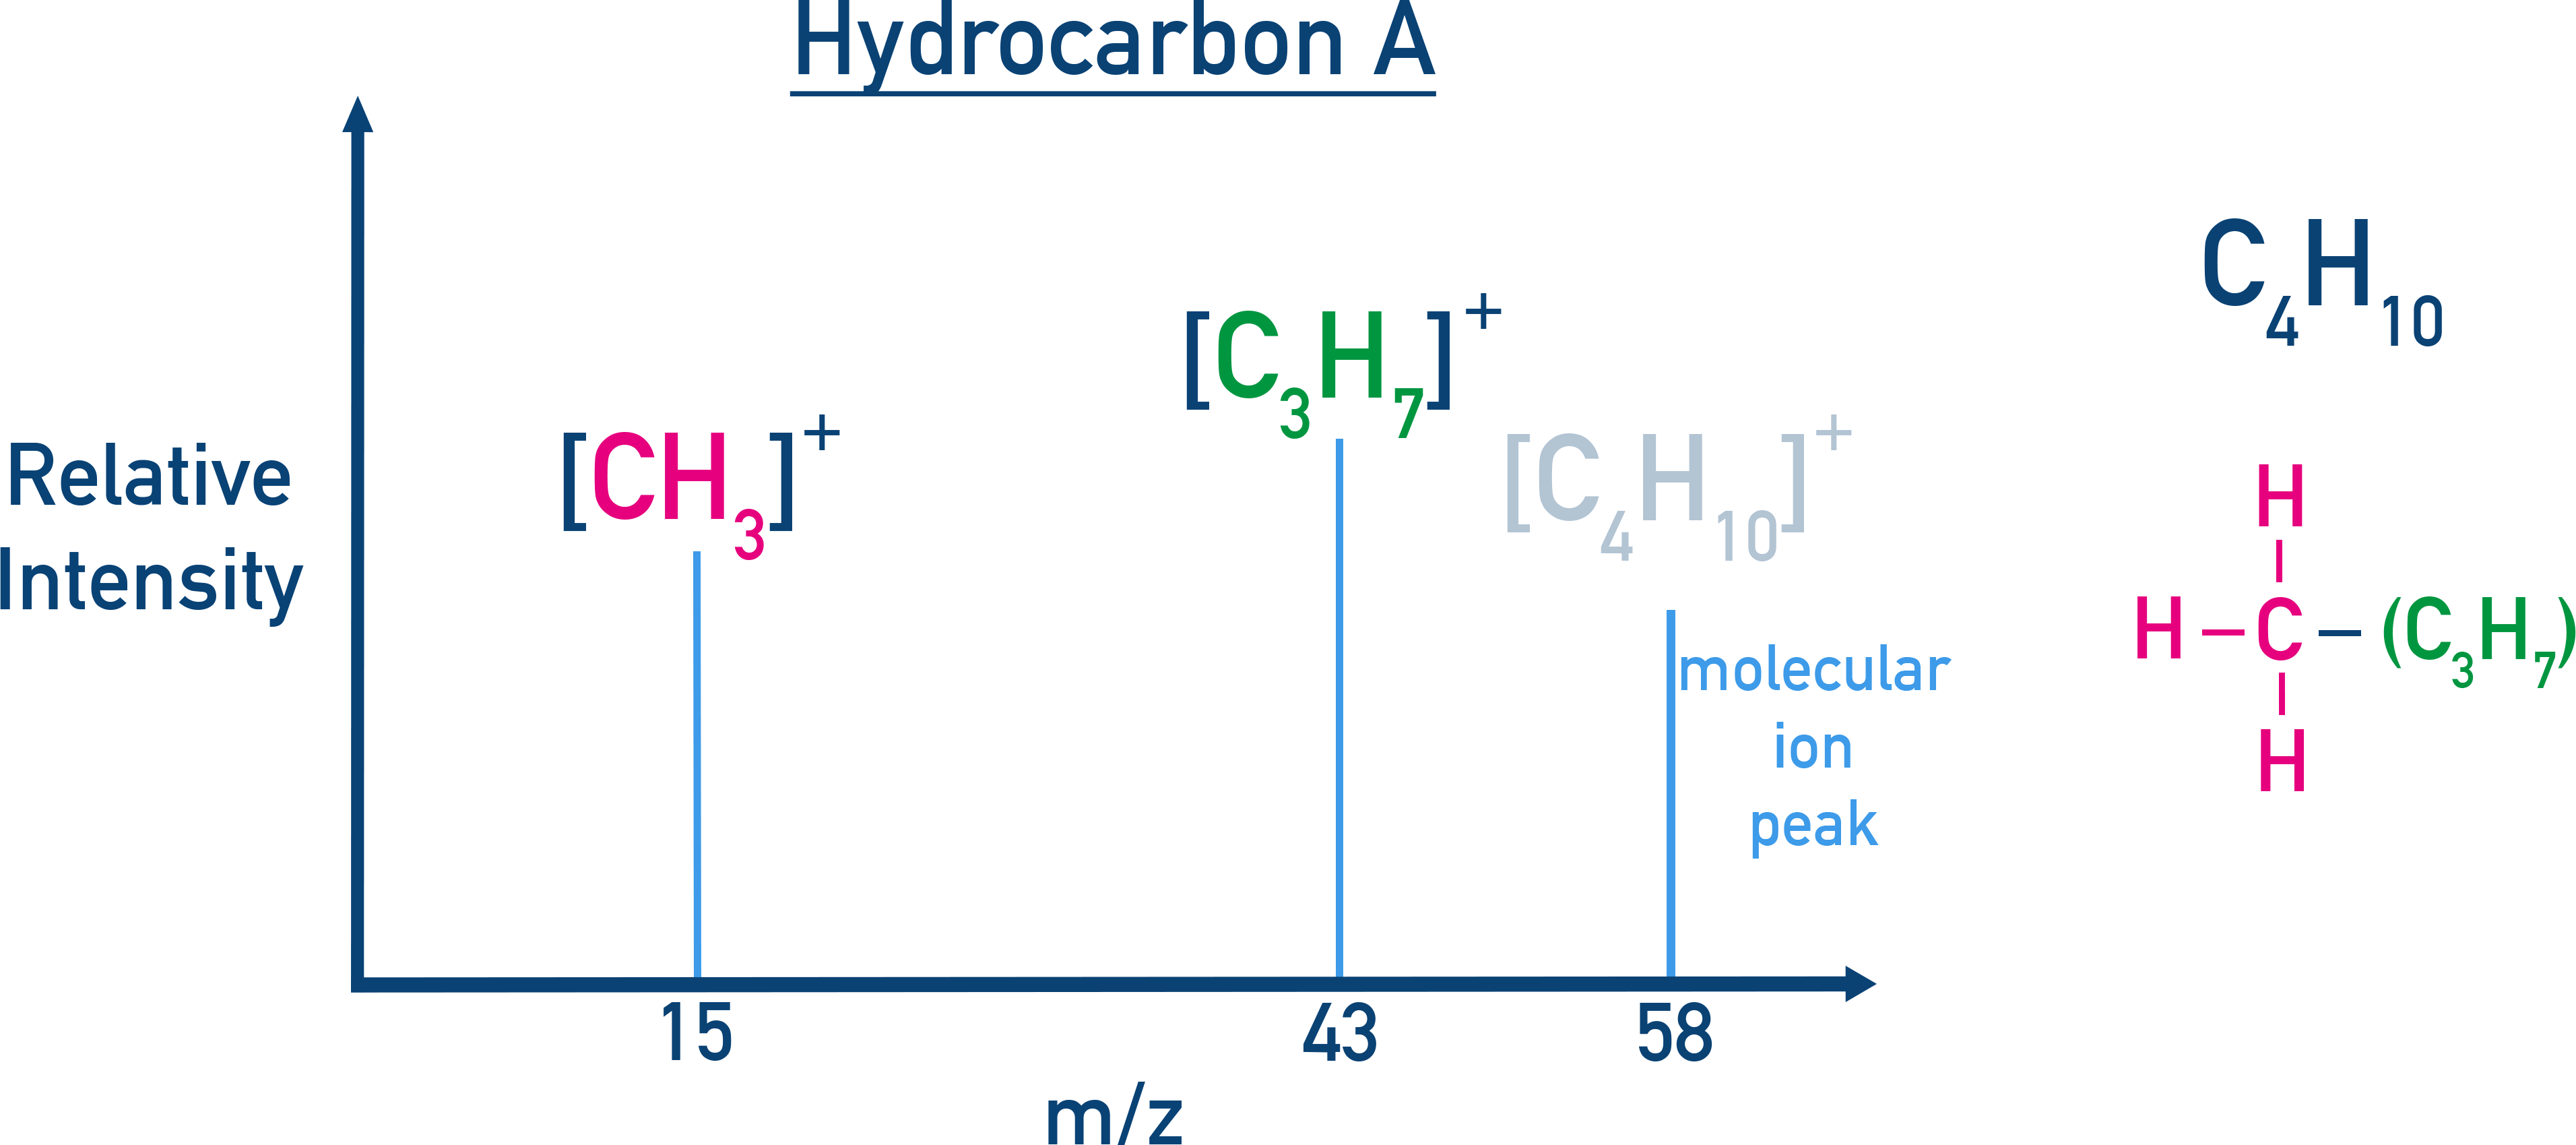
Fragment peaks at 15 and 43 show a CH3 fragment and C3H7 fragment. However, no fragment at 29 means no C2H5 group. This means the likely possible structure is CH3CH(CH3)CH3
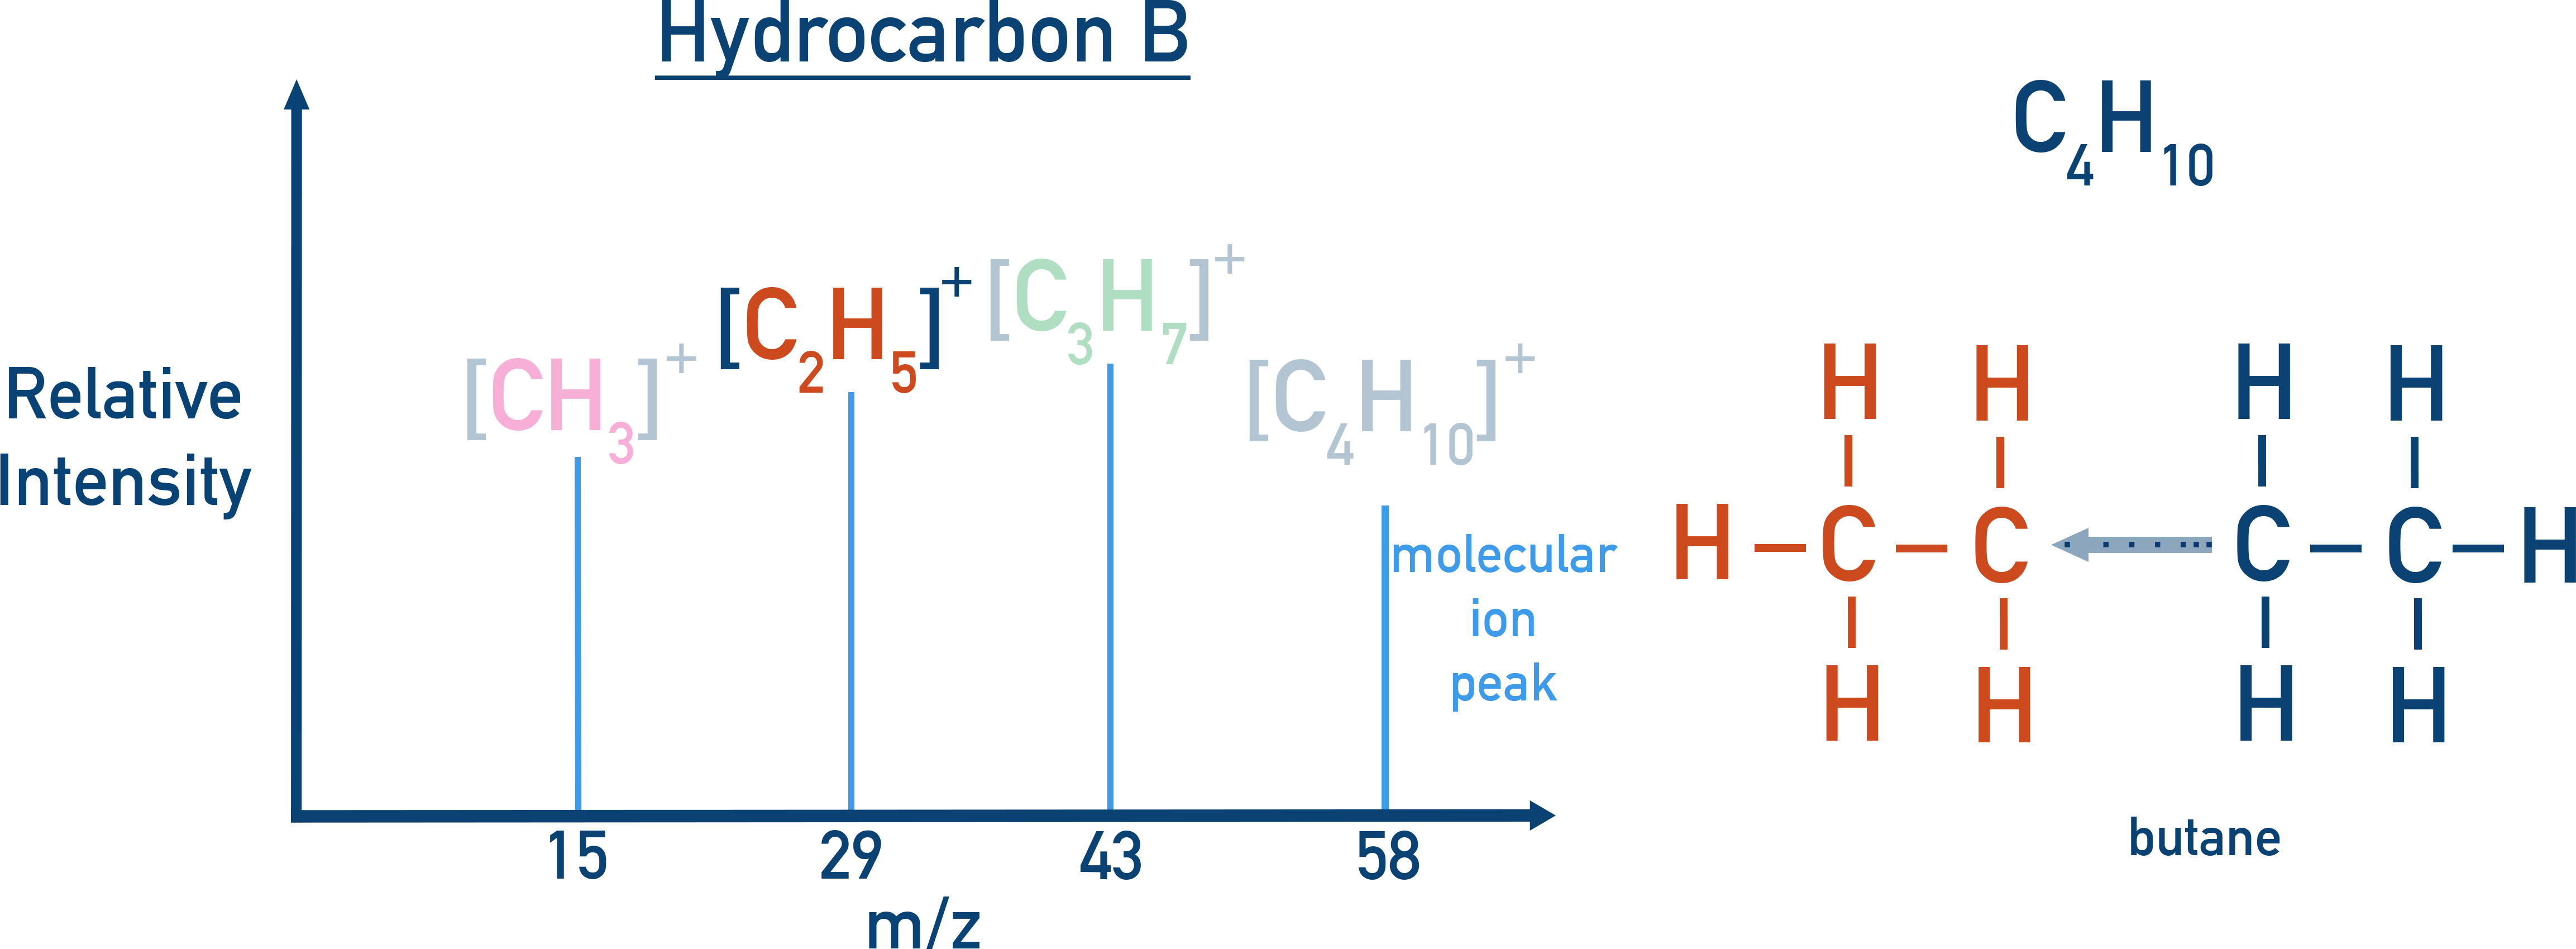
The extra peak at m/z 29 for Hydrocarbon B means it has a C2H5 group in its structure (as well as a CH3 and C3H7 group). This would indicate CH3CH2CH2CH3 as its structure.
The [M+1]⁺ Peak
The M+1 peak is a small peak 1 unit higher than the main molecular ion peak, M⁺, caused by molecules containing one carbon-13 atom.
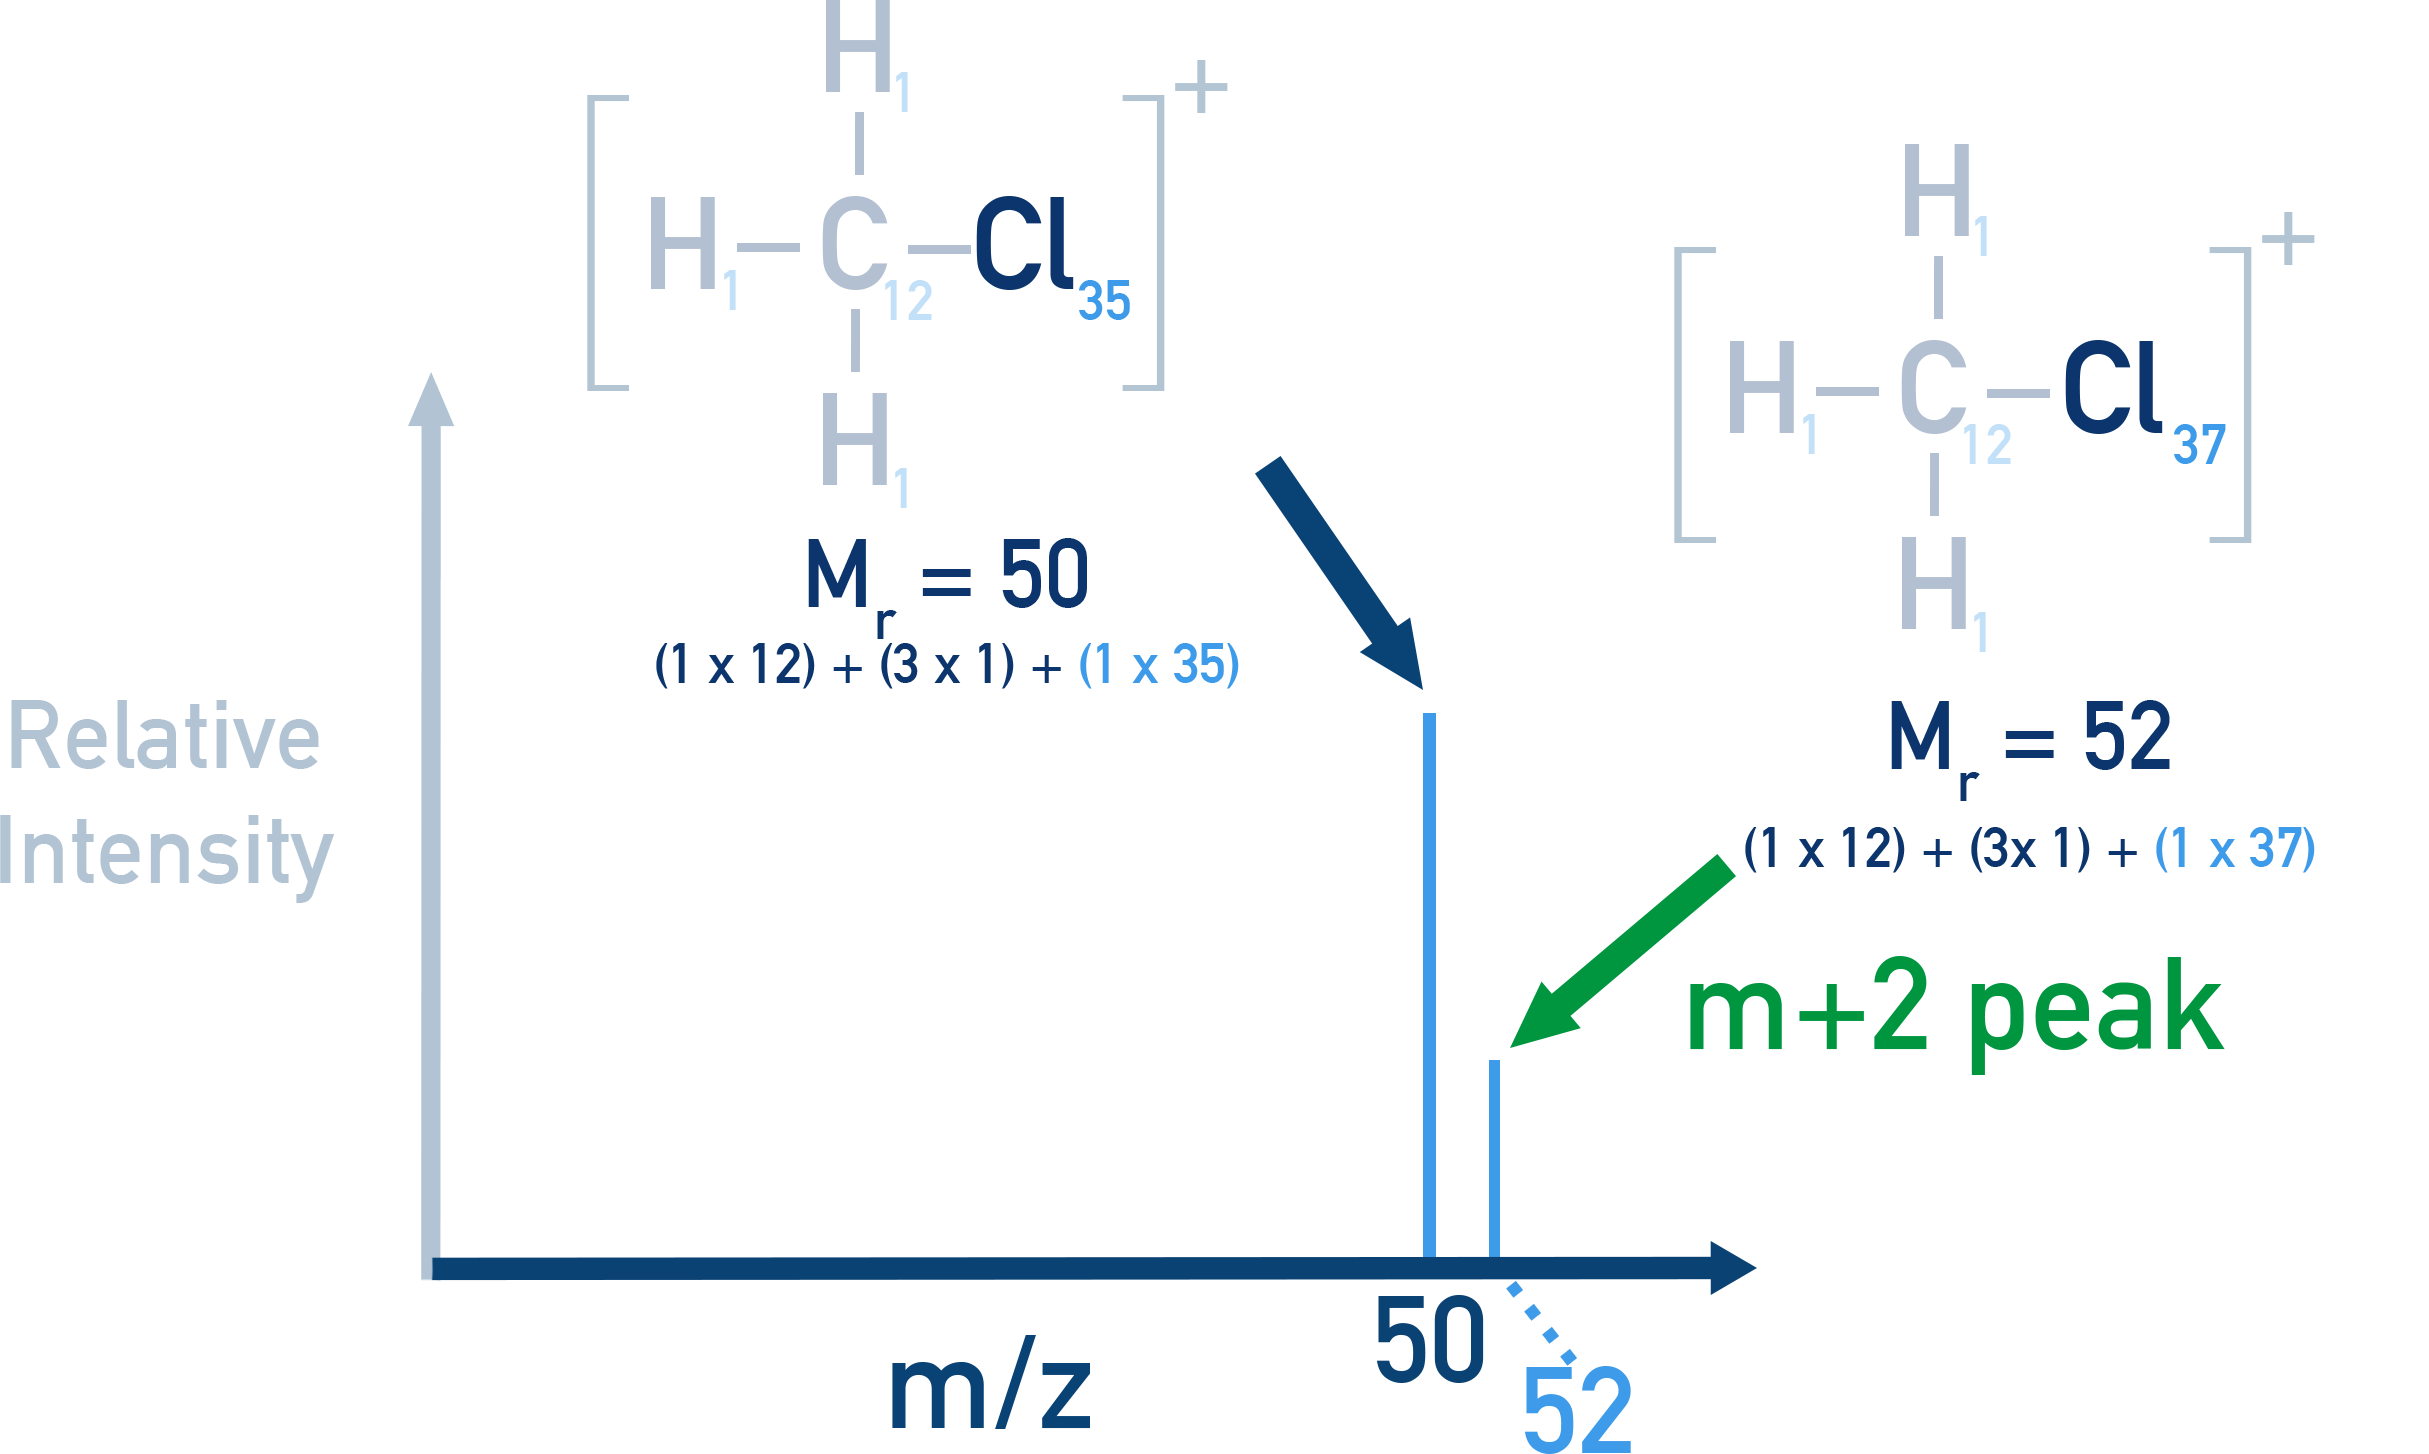
The [M+2]⁺ Peak – Identifying Cl and Br
Organic compounds that contain chlorine or bromine will have an M+2 peak.
This is because chlorine and bromine both have isotopes that differ by a mass number of 2 (Cl-35 and Cl-37 and Br-79 and Br-81).
For example: The mass spectra for chloromethane shows an M+2 peak.
The main molecular ion peak is at 50 (contains the Cl-35 isotope) and 52 (contains the Cl-37 isotope),
The [M+2]⁺ peak helps detect chlorine and bromine.
For chlorine, the ratio of ³⁵Cl to ³⁷Cl is 3:1 so if Cl is present in the compound, M⁺ and M+2⁺ peaks appear in a 3:1 ratio.
For bromine, The ratio of ⁷⁹Br to ⁸¹Br is 1:1, so M⁺ and M+2⁺ peaks appear with equal height (a 1:1 ratio).
This helps confirm if Cl or Br is in the compound.
Summary
- Mass spectrometry measures m/z to identify compounds; the molecular ion peak M⁺ gives Mr.
- Fragment peaks come from the molecular ion breaking into smaller ions and reveal structural features.
- An M+1 peak indicates ¹³C in the molecule.
- M and M+2 patterns diagnose halogens: Cl ≈ 3:1 and Br ≈ 1:1.
- Combine M⁺ value with precise atomic masses to confirm a molecular formula.