
Mass Spectrometry
Quick Notes
- Mass spectrometry identifies organic compounds using mass-to-charge ratio (m/z) of ions from the compound.
- The molecular ion peak (M⁺) gives the relative molecular mass (Mr).
- Smaller peaks are caused by fragmentation – the breakdown of the molecular ion.
- [M+1]⁺ peaks indicate the presence of carbon-13 isotopes.
- [M+2]⁺ peaks reveal the presence of chlorine (3:1 ratio) or bromine (1:1 ratio) due to their isotopes.
- Accurate mass data to 4 decimal places can differentiate between isomers or identify exact molecular formulae.
Full Notes
This builds on Mass Spectrometry as introduced in chapter 7 – here.
Mass Spectrometry – The Basics
- A sample is ionised to form positive ions.
- Ions are accelerated and separated based on their mass-to-charge ratio (m/z).
- The detector records the ions, producing a mass spectrum.
- The molecular ion peak (M⁺) represents the relative molecular mass (Mr) of the compound.
Identifying Molecular Mass and Formula
The molecular ion peak (M⁺) has the highest m/z value on a spectra and we can use precise atomic masses to confirm the molecular formula.
Example:
Determining the molecular formula of a compound with M⁺ = 58.12

Fragmentation
Inside the mass spectrometer, molecular ions can break into fragments. Each fragment forms a smaller ion and shows up as a peak at a lower m/z.
These peaks help identify parts of the molecule.
Example:
Hydrocarbons A and B both have formula C4H10. Their spectra differ due to fragmentation patterns.

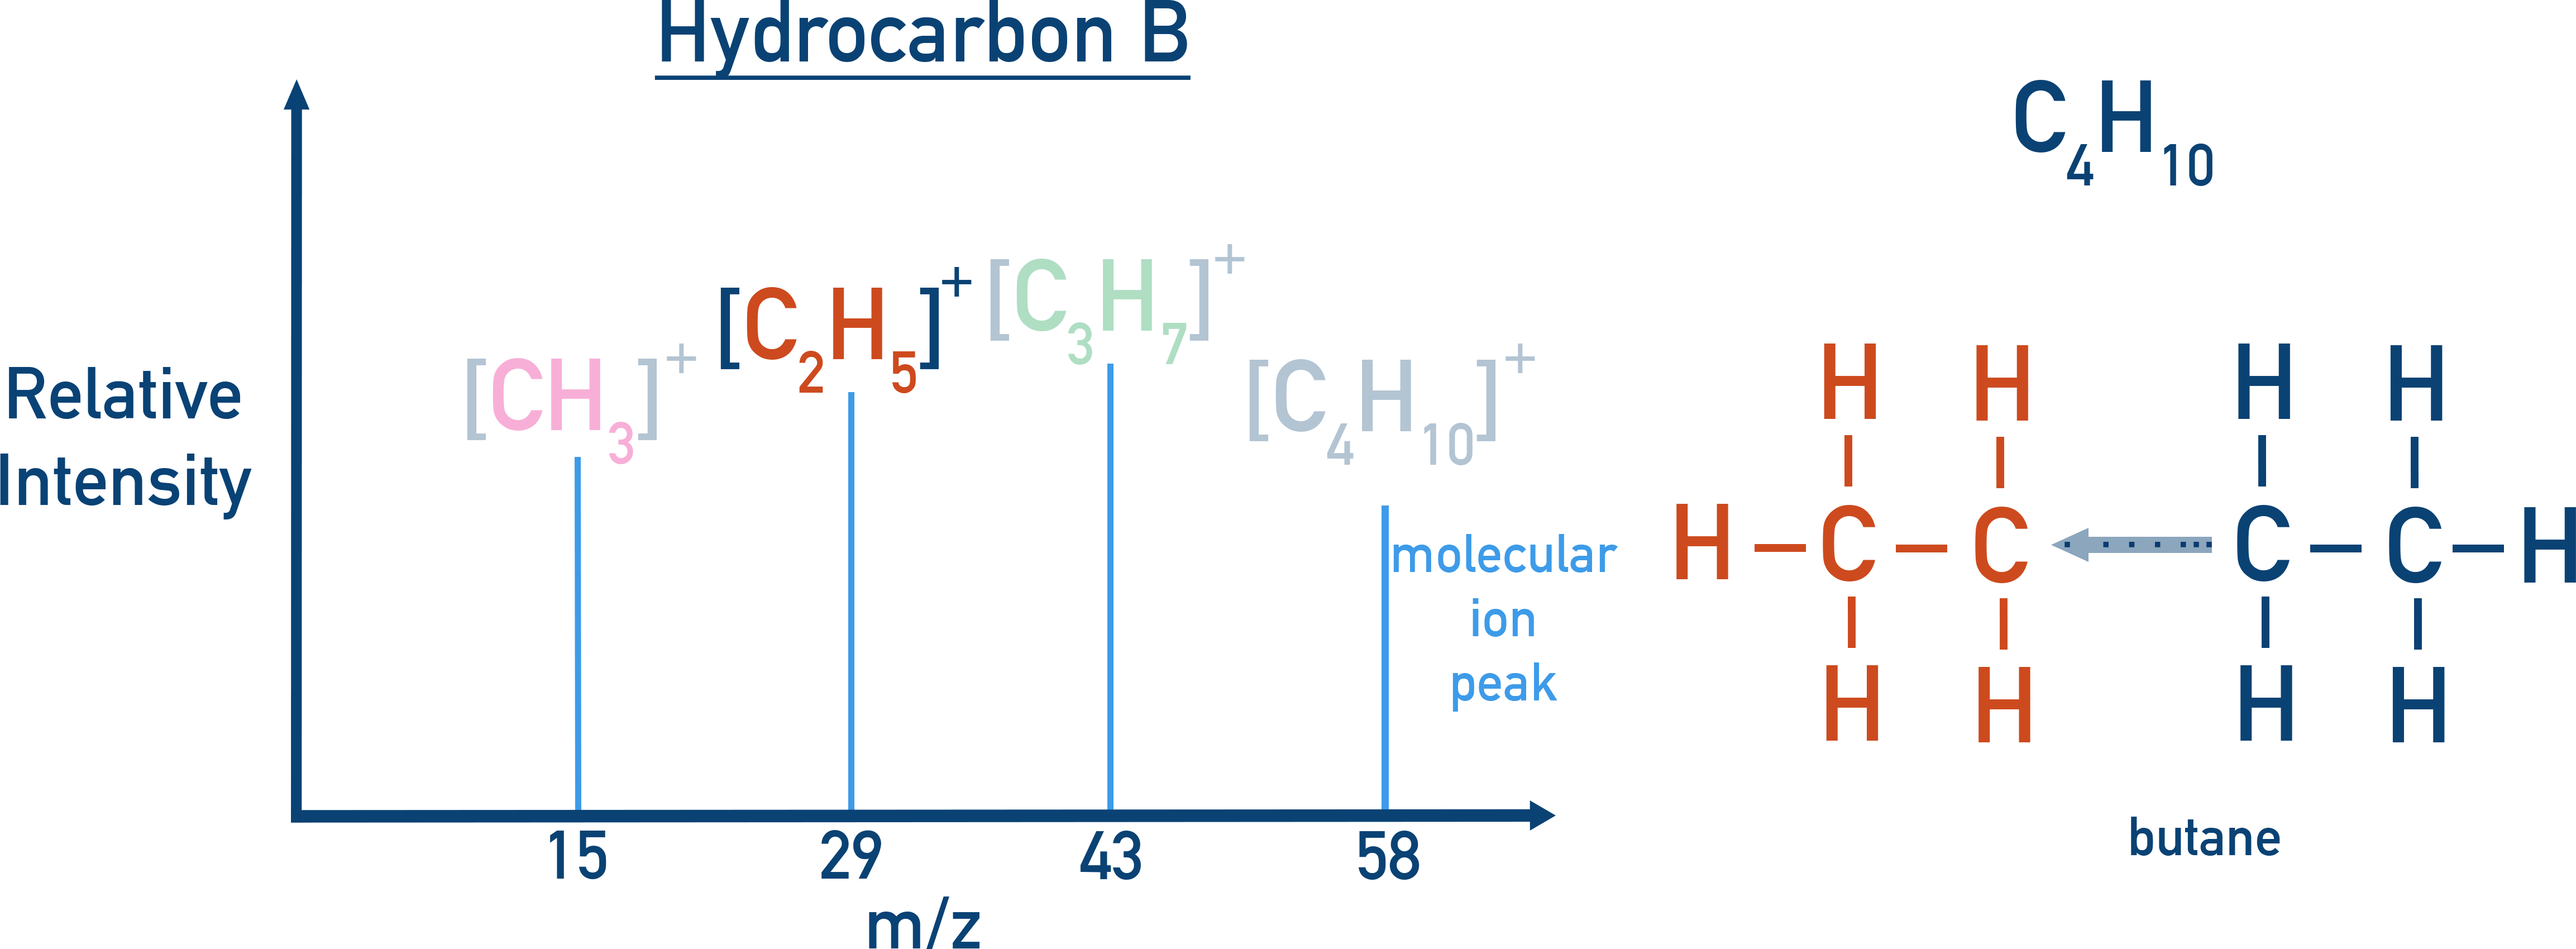
The extra peak at m/z 29 for Hydrocarbon B means it has a C2H5 group in its structure (as well as a CH3 and C3H7 group). This would indicate CH3CH2CH2CH33 as its structure.
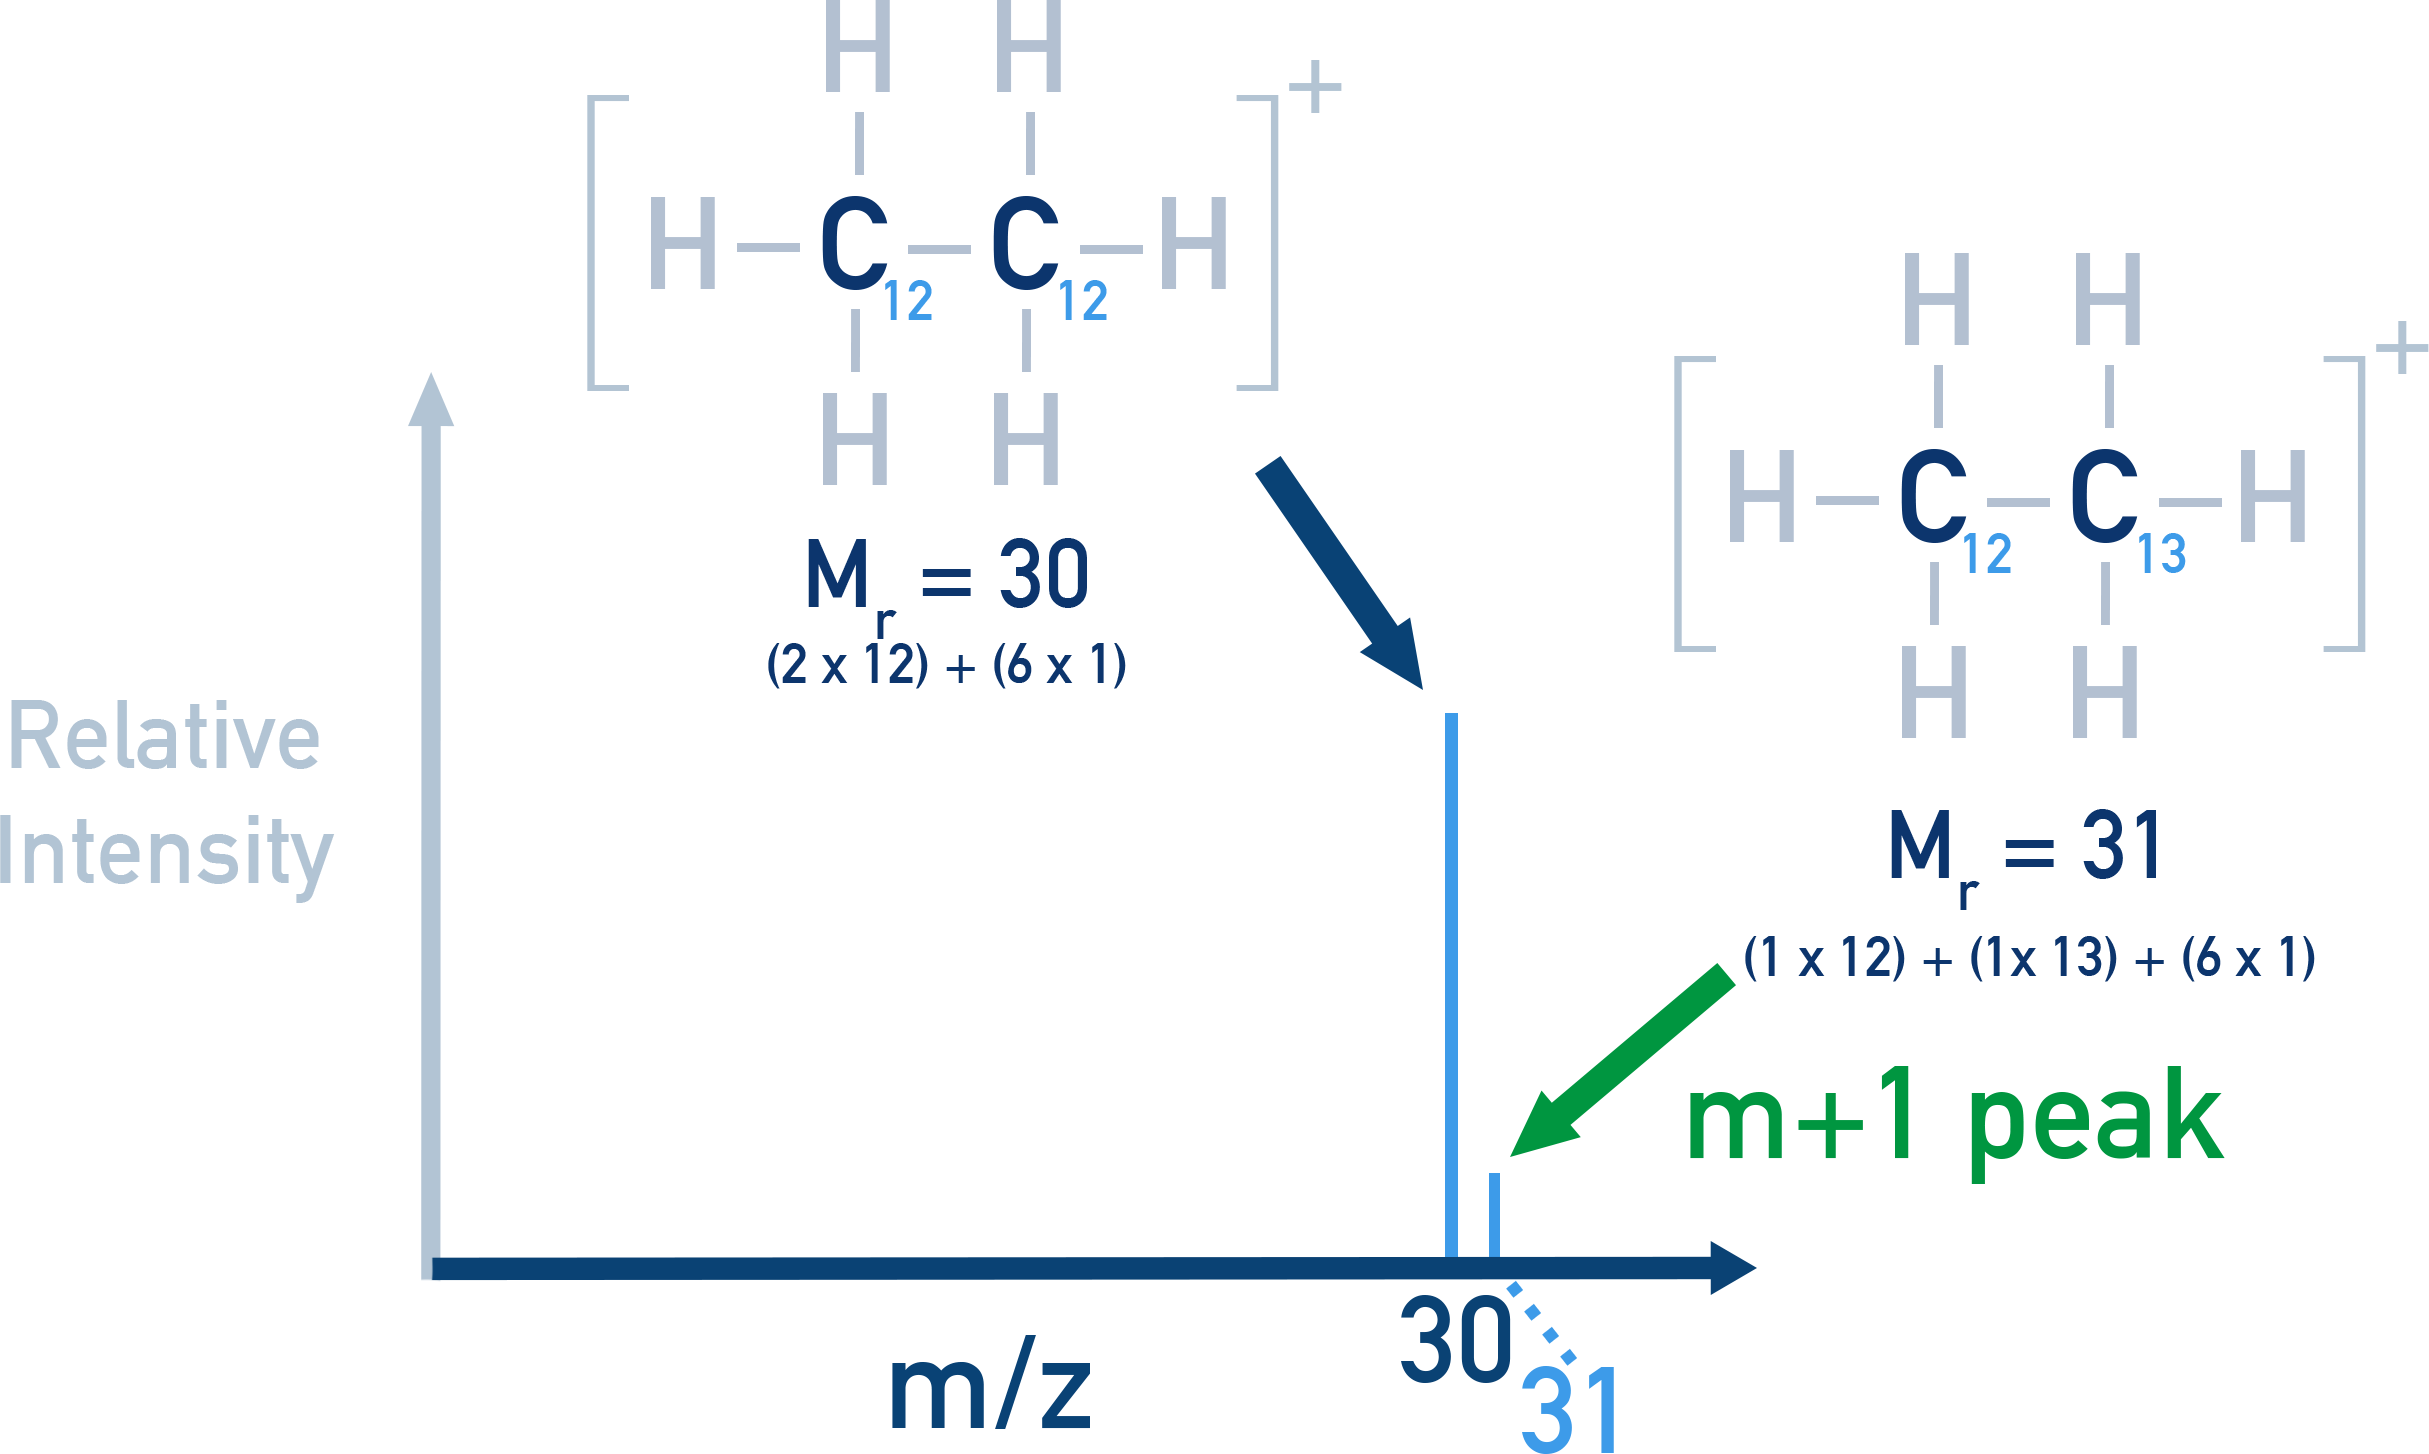
The [M+1]⁺ Peak
This is a small peak 1 unit higher than M⁺, caused by molecules containing one carbon-13 atom.
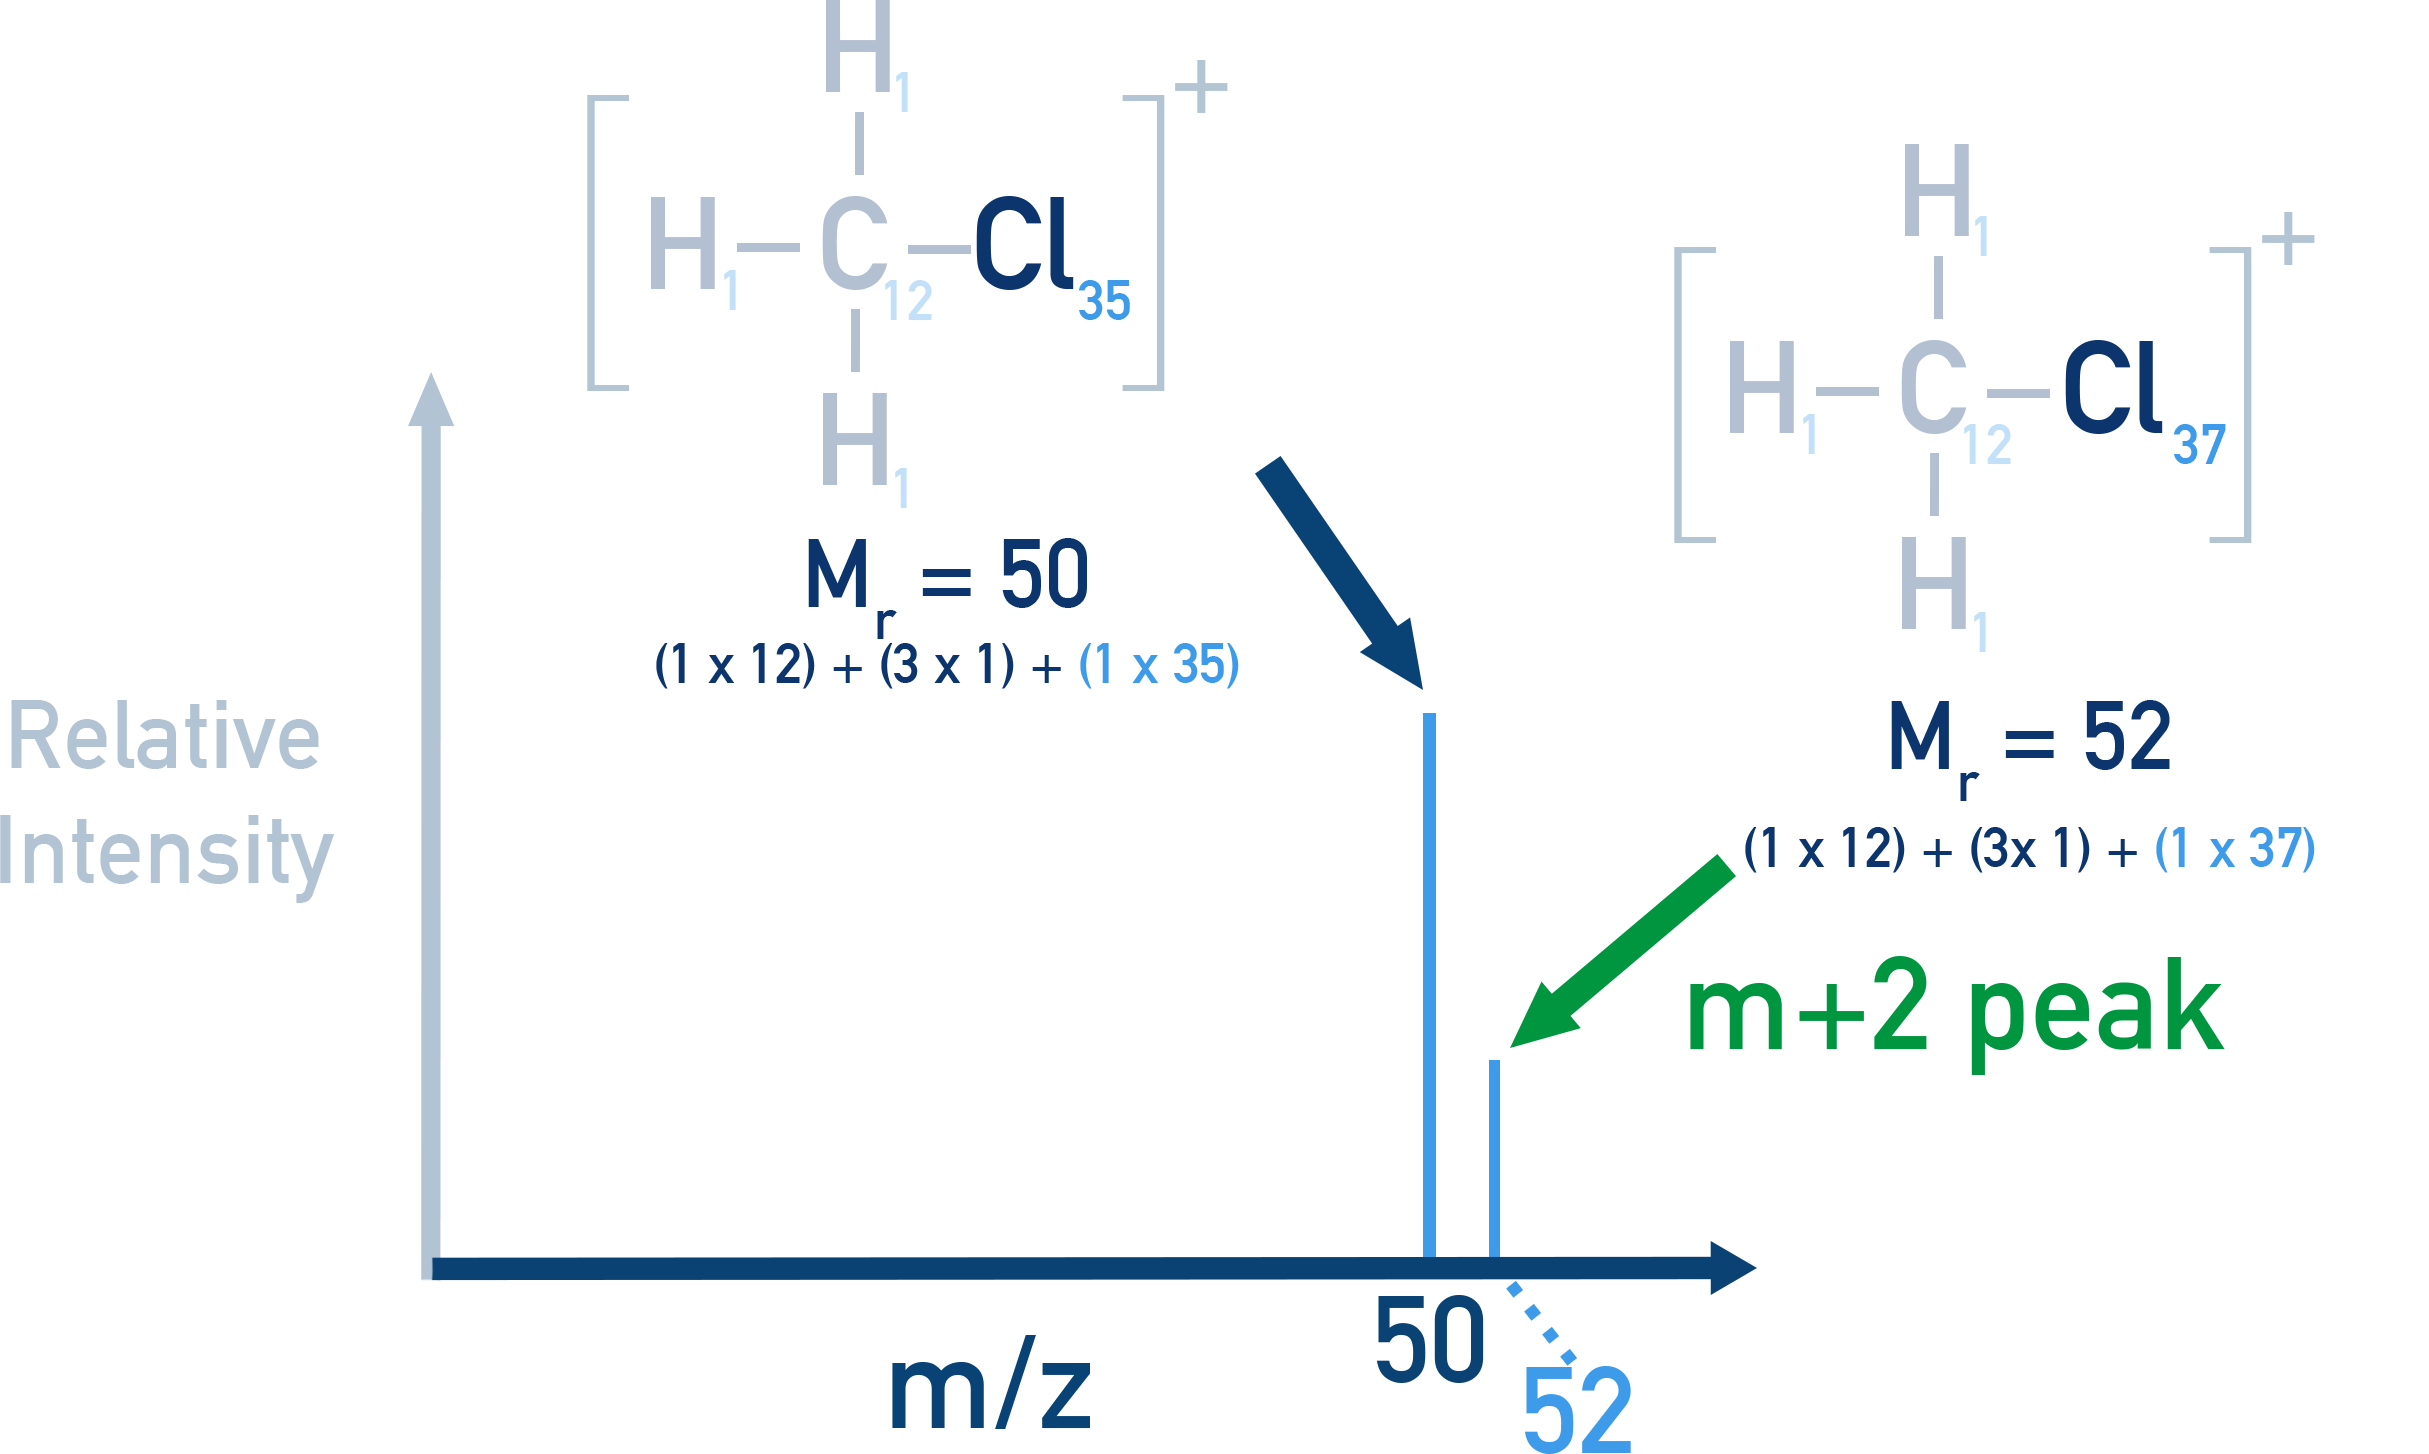
The [M+2]⁺ Peak – Identifying Cl and Br
Organic compounds that contain chlorine or bromine show an M+2 peak due to isotopes:
This is because chlorine and bromine both have isotopes that differ by a mass number of 2 (Cl-35 and Cl-37 and Br-79 and Br-81).
- Chlorine: ratio of 35Cl to 37Cl is 3:1 → M⁺ and M+2 peaks appear in 3:1 ratio.
- Bromine: ratio of 79Br to 81Br is 1:1 → M⁺ and M+2 peaks appear with equal height.
For example:
The mass spectra for chloromethane shows an M+2 peak. The main molecular ion peak is at 50 (contains the Cl-35 isotope) and 52 (contains the Cl-37 isotope).
Using Accurate Mass Data
High-resolution mass spectrometers measure Mr accurate to 4 decimal places, allowing precise determination of molecular formula.
Both C3H8O and C2H4O2 have a relative molecular mass (Mr) of 60, but differ in exact mass. In a mass spectrum, the M+ peak of the compound is at 60.0575. Using the following relative atomic masses, determine the molecular formula of the compound.
- C = 12.0000
- H = 1.0078
- O = 15.9949
For C3H8O:
(3 × 12.0000) + (8 × 1.0078) + (1 × 15.9949) = 60.0575 → MATCH
For C2H4O2:
(2 × 12.0000) + (4 × 1.0078) + (2 × 15.9949) = 60.0210 → doesn’t match
Conclusion: The compound could be propanol but not ethanoic acid.