
Infrared (IR) spectroscopy
Quick Notes
- IR spectroscopy identifies functional groups by detecting bond vibrations.
- Bonds absorb IR radiation at specific wavenumbers (cm−1).
- An absorption peak in an IR spectra indicates the presence of a bond.
- Key absorptions:
- C–H (alkanes, alkenes, aldehydes): 2850–3100 cm−1
- C=C (alkenes): 1620–1680 cm−1
- O–H (alcohols): 3200–3600 cm−1 (broad)
- C=O (aldehydes and ketones): 1680–1750 cm−1
- O–H and C=O (carboxylic acids): very broad 2500–3300 cm−1 for O–H and 1680–1750 cm−1 for C=O
- N–H (amines): 3300–3500 cm−1 (usually sharp)
Full Notes
IR Spectroscopy and how it works is covered in more detail
here.
This page is just what you need to know for Edexcel A-level :)
Infrared spectroscopy is used to detect bond vibrations in organic compounds.
When a compound is exposed to infrared radiation, some bonds absorb energy and vibrate more strongly. This absorption happens at characteristic wavenumbers, depending on the type of bond and its environment.
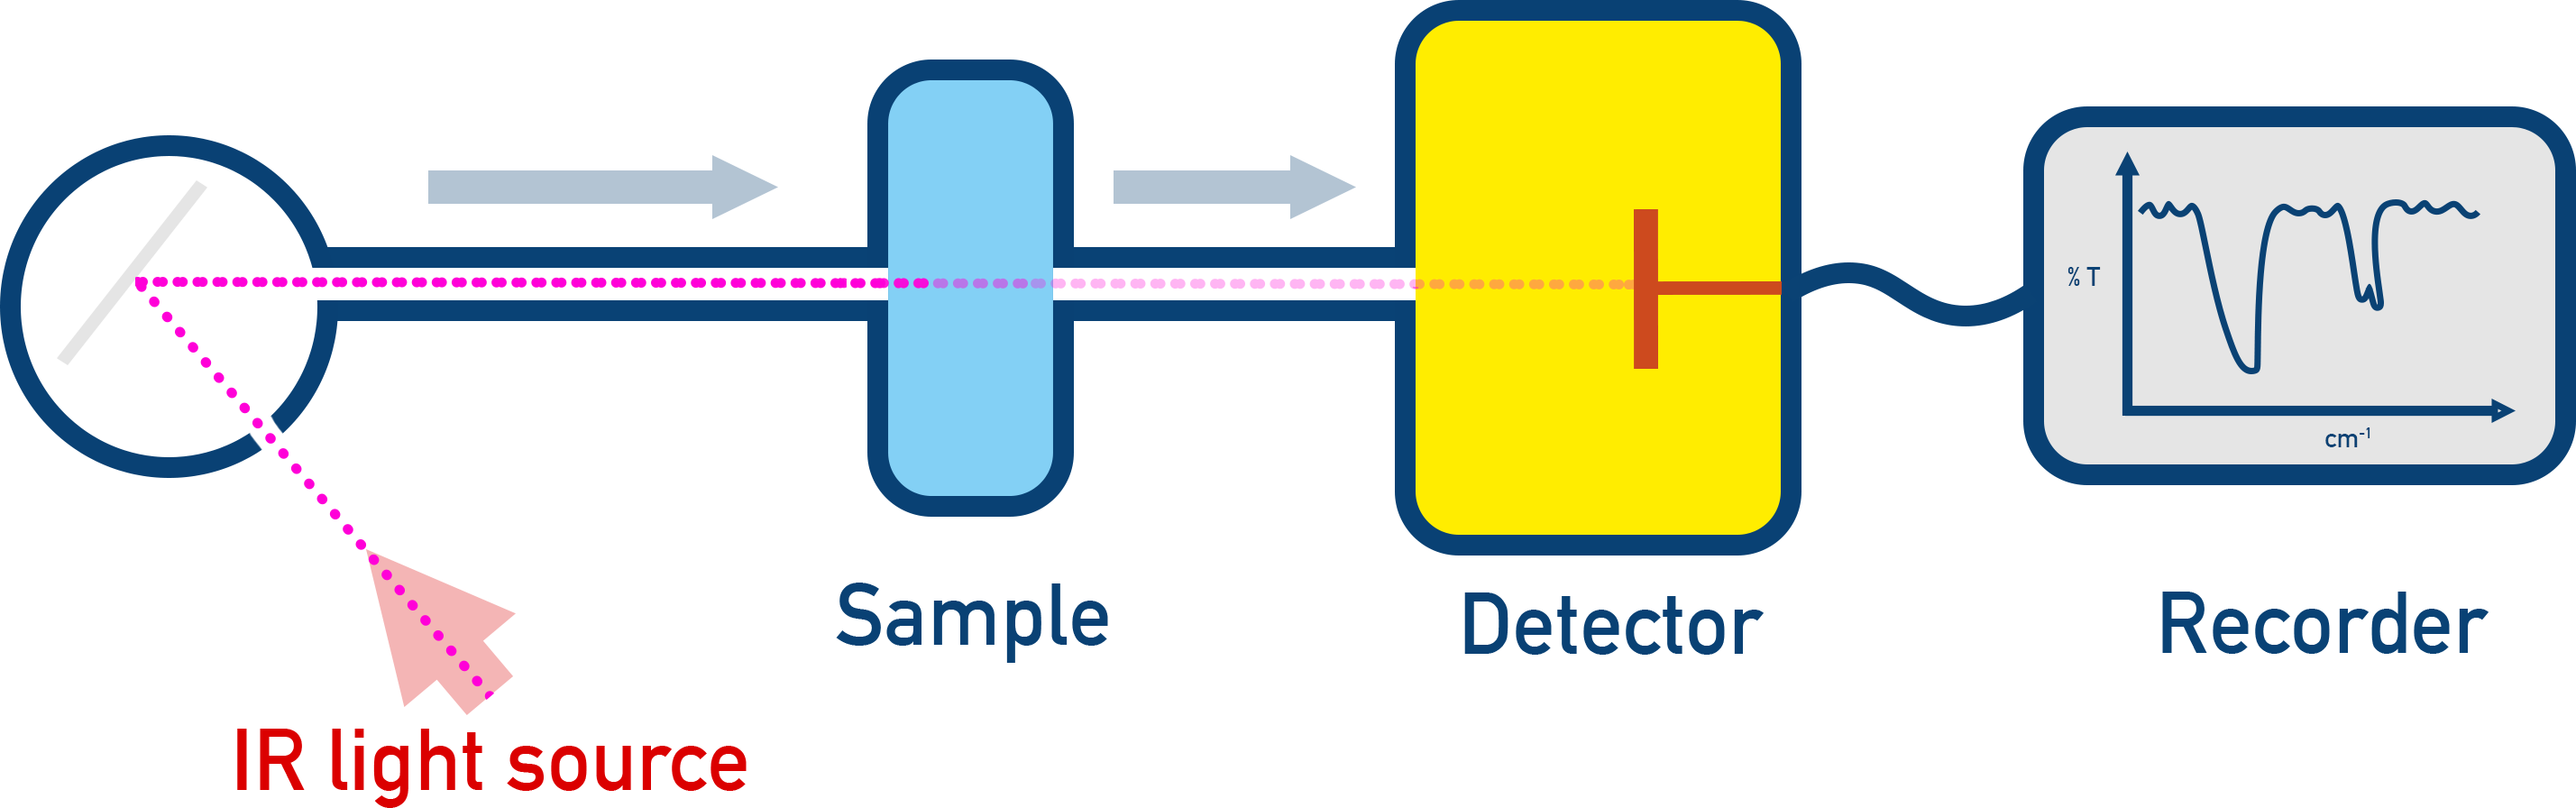
- IR radiation is passed through a sample.
- Bonds in the sample can vibrate in specific ways, absorbing IR radiation at characteristic wavenumbers (measured in cm−1).
- An infrared spectrum is produced, showing absorption peaks.

Identifying Functional Groups Using IR Spectroscopy
Bonds from different functional groups absorb IR radiation at specific wavenumbers (you are given a data table in exams, you don’t need to remember them).
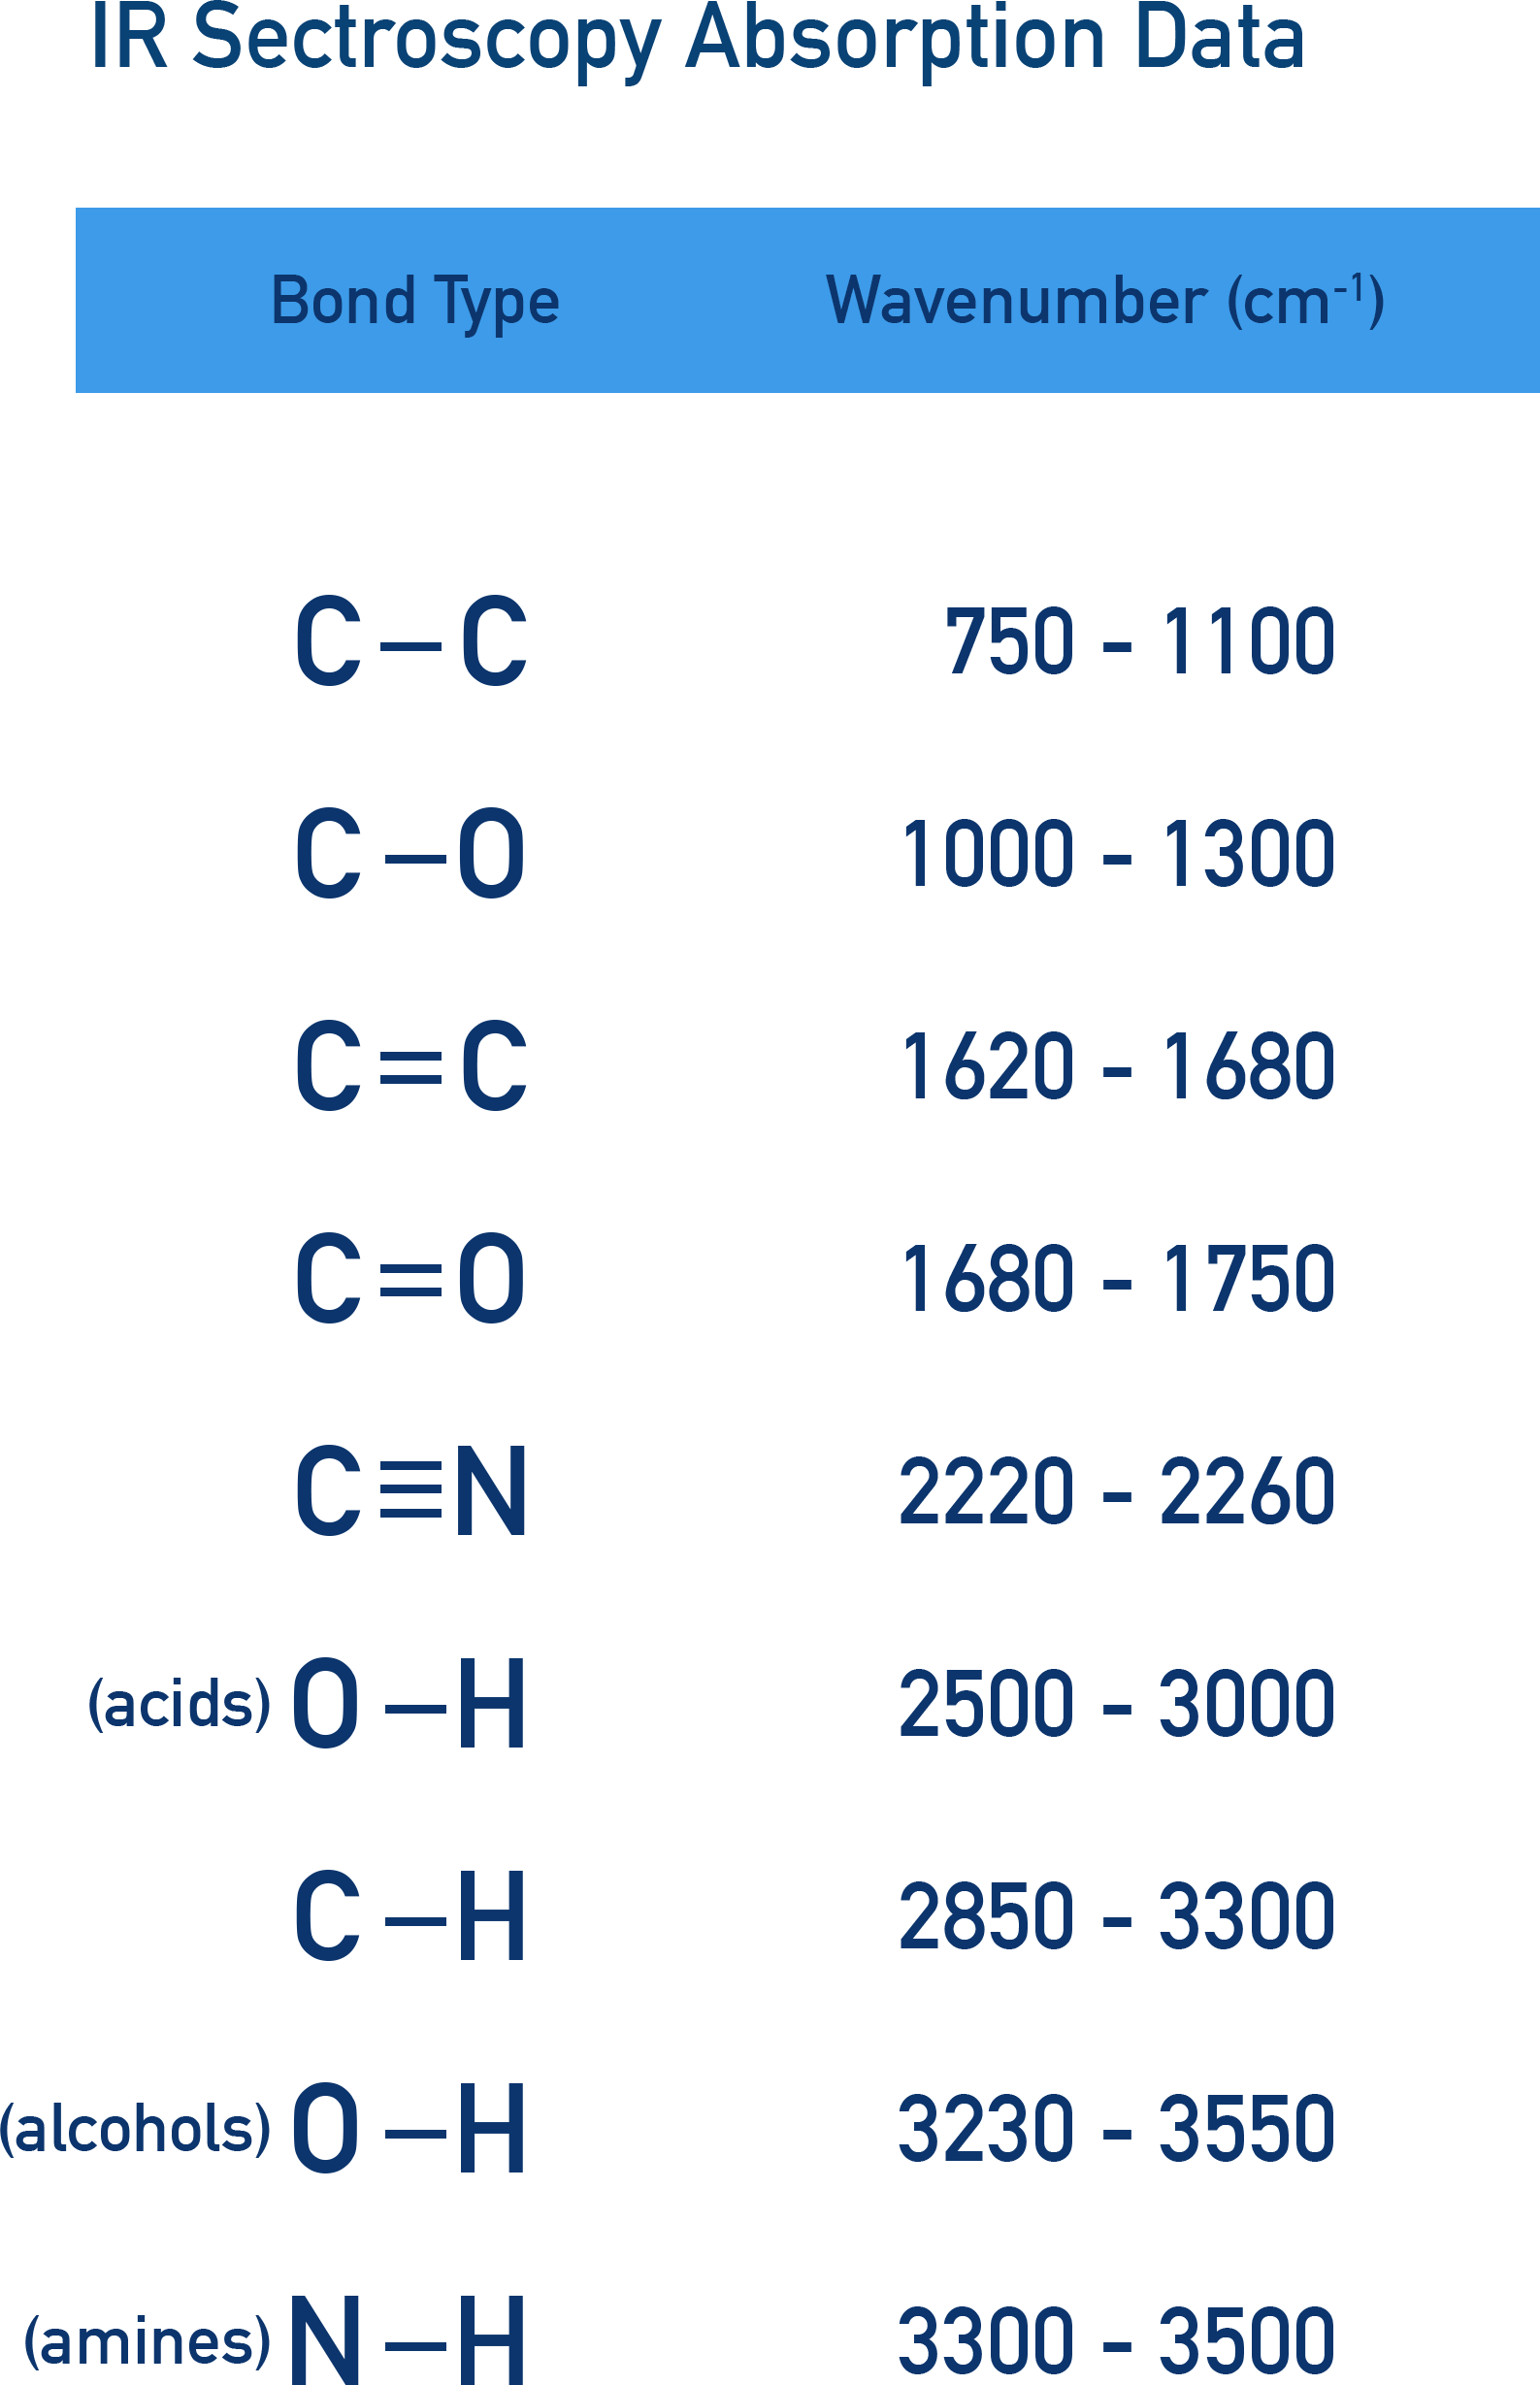
We can use absorbances in spectra to identify bond types present.
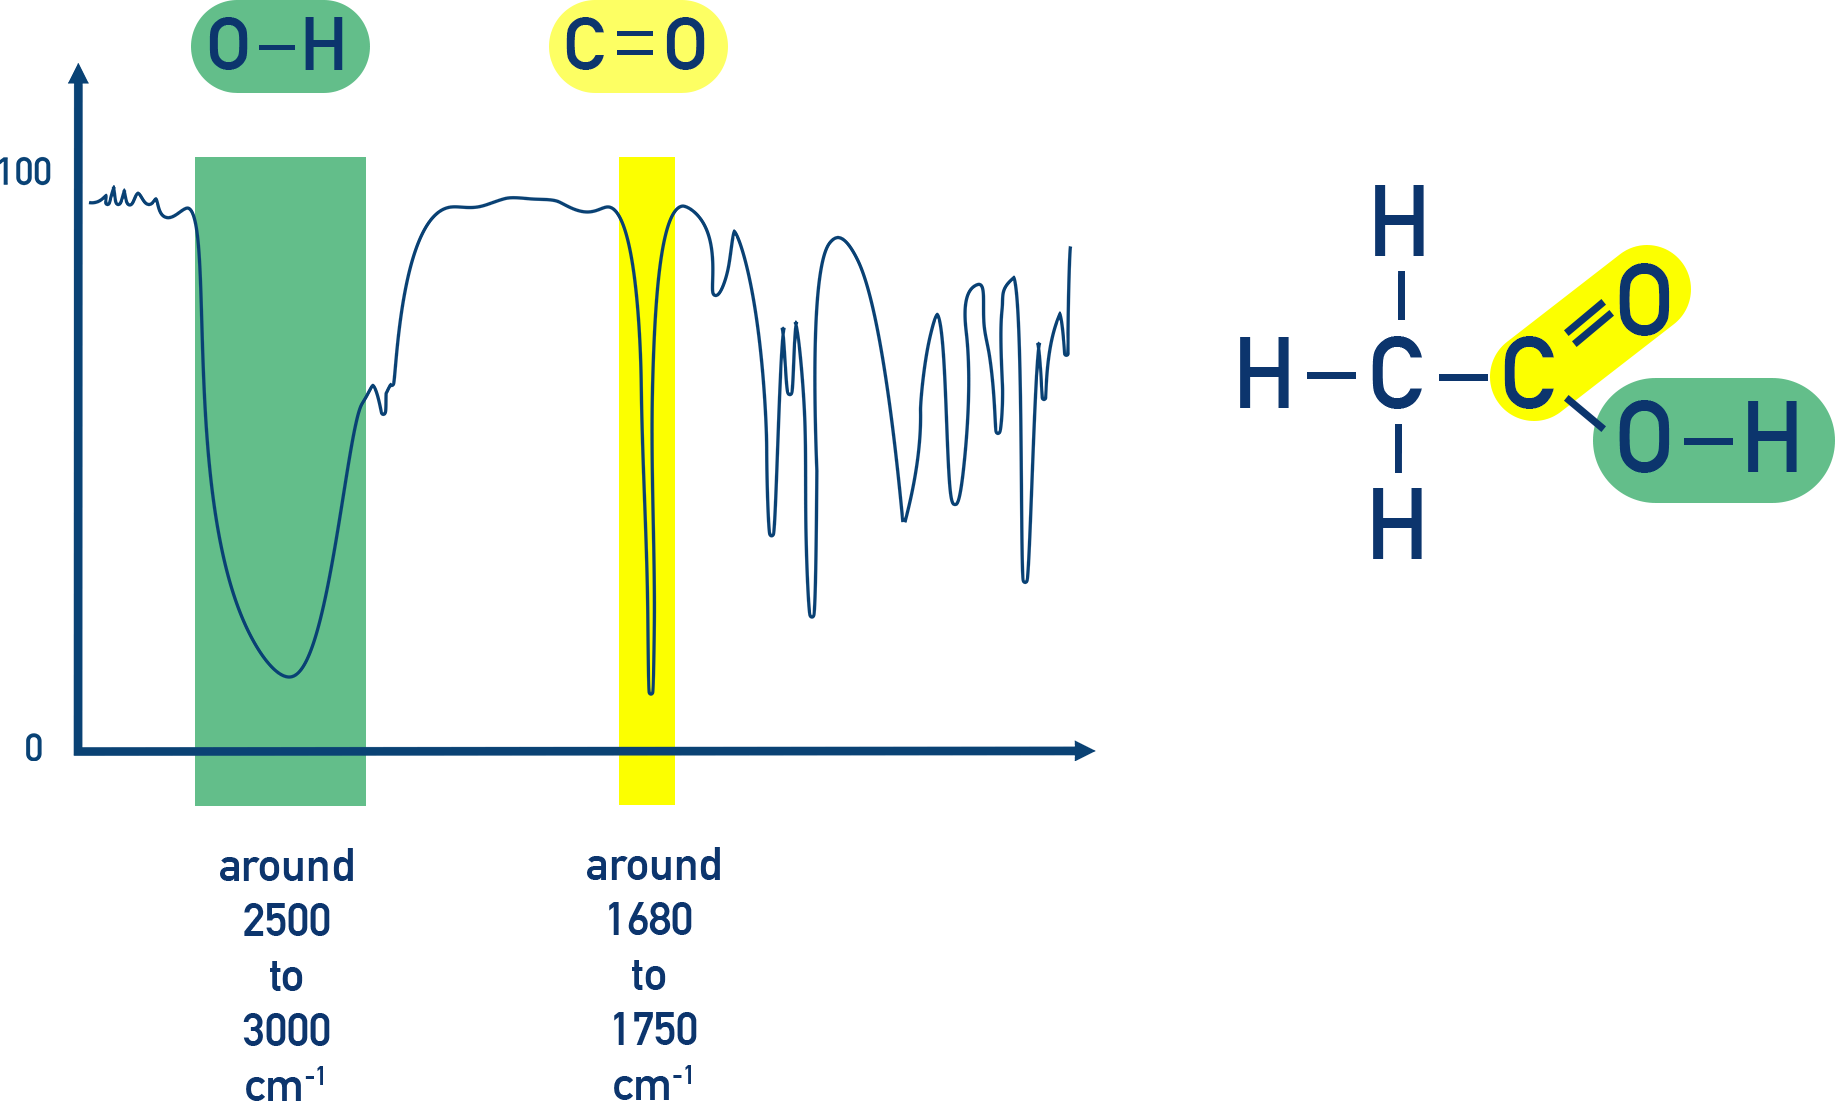
Example Ethanoic acid (CH3COOH)
Ethanoic acid has two absorbances in its IR spectra that helps identify it. One for the O–H bond (2500 to 3000) and one for the C=O bond (1680 to 1750).
The ‘Fingerprint Region’ (Below 1500 cm−1)
The region on a spectra below 1500cm^-1 is called the fingerprint region.
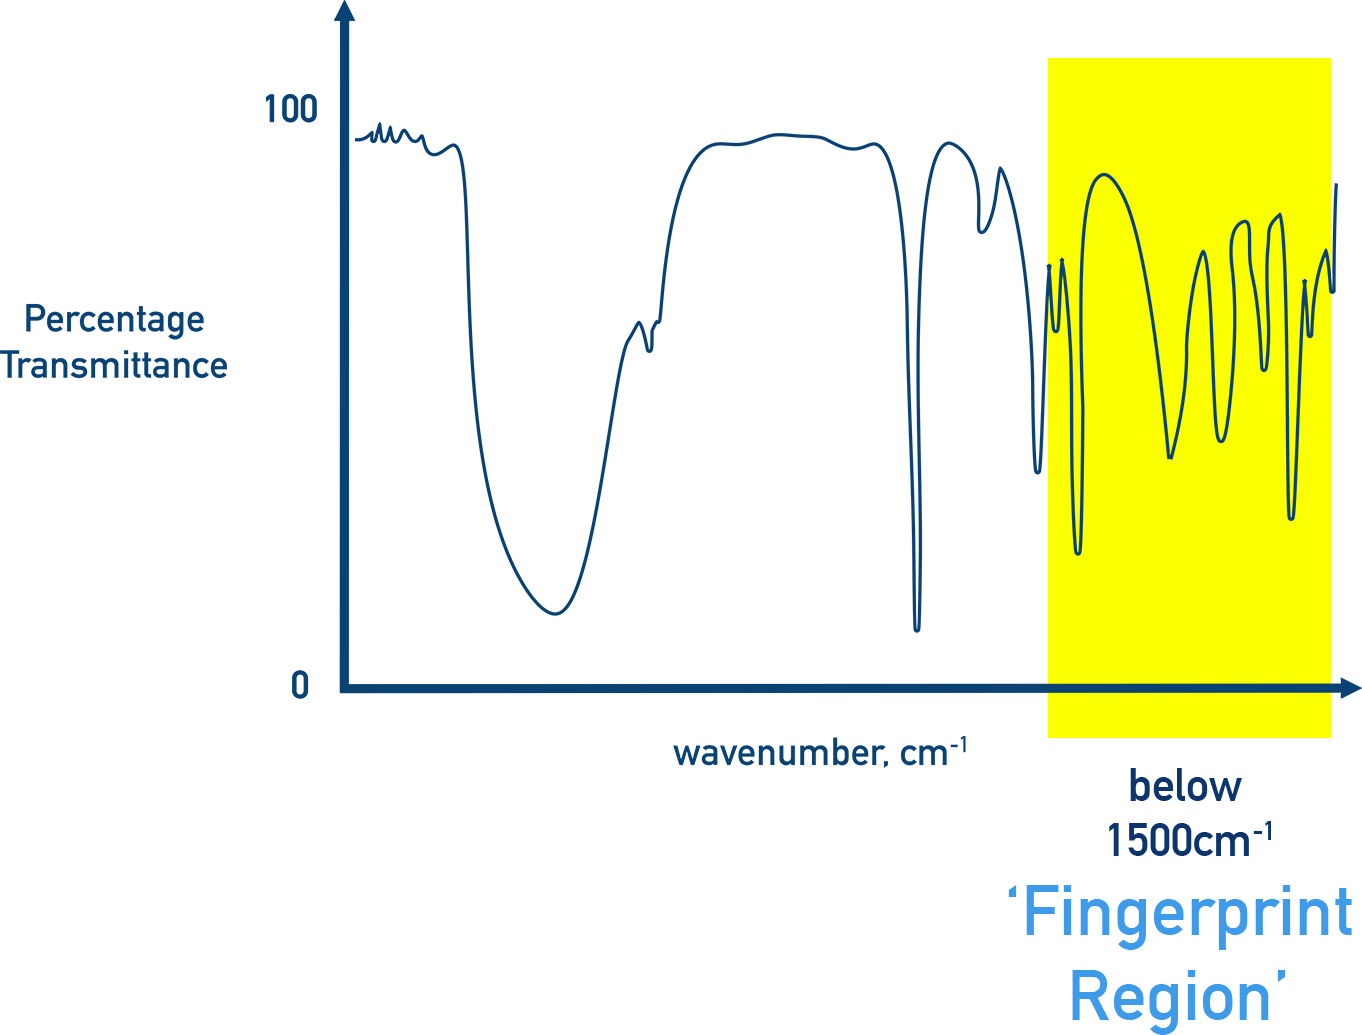
It is unique to a given molecule can be used for exact identification by comparing spectra to known compounds from a database.
This region is very complex and isn’t analysed in detail at this level of study.
Summary
- IR spectroscopy detects bond vibrations and shows characteristic absorption peaks for functional groups.
- Use key ranges such as O–H, C=O, C–H, N–H and C=C to identify bonds in a compound.
- The molecular fingerprint region below 1500 cm−1 is unique and useful for exact identification by comparison to databases.