
Chromatography
Quick Notes
- Chromatography is used to separate and identify components in a mixture.
- Three main types of chromatography:
- Thin-layer chromatography (TLC) – A solid-coated plate (stationary phase) with a solvent (mobile phase) moving up the plate.
- Column chromatography (CC) – A packed column (stationary phase) with solvent (mobile phase) moving down.
- Gas chromatography (GC) – A column with a solid or liquid stationary phase, gas (mobile phase) moves through under pressure at a high temperature.
- Separation depends on:
- Solubility in the mobile phase
- Retention by the stationary phase
- Rf values (for TLC) and retention times (for GC) help identify substances.
- Mass spectrometry (MS) can be used with GC to analyse separated components.
Full Notes
Chromatography and background theory has been outlined in more detail here.
This page is just what you need to know for Edexcel A-level :)
Principles of Chromatography
Chromatography separates components of a mixture based on differences in their movement between two phases:
- Stationary phase – Solid or liquid that ‘holds on’ to components.
- Mobile phase – Liquid or gas that carries and moves components.
Substances that are more soluble in the solvent will spend more time in the mobile phase compared to less soluble substances and move further in the same time. Those with stronger interactions with the stationary phase move less in the same length of time.
Types of Chromatography
Thin-Layer Chromatography (TLC)
Stationary phase: A plate coated with silica or alumina.
Mobile phase: A liquid solvent (e.g., ethanol).
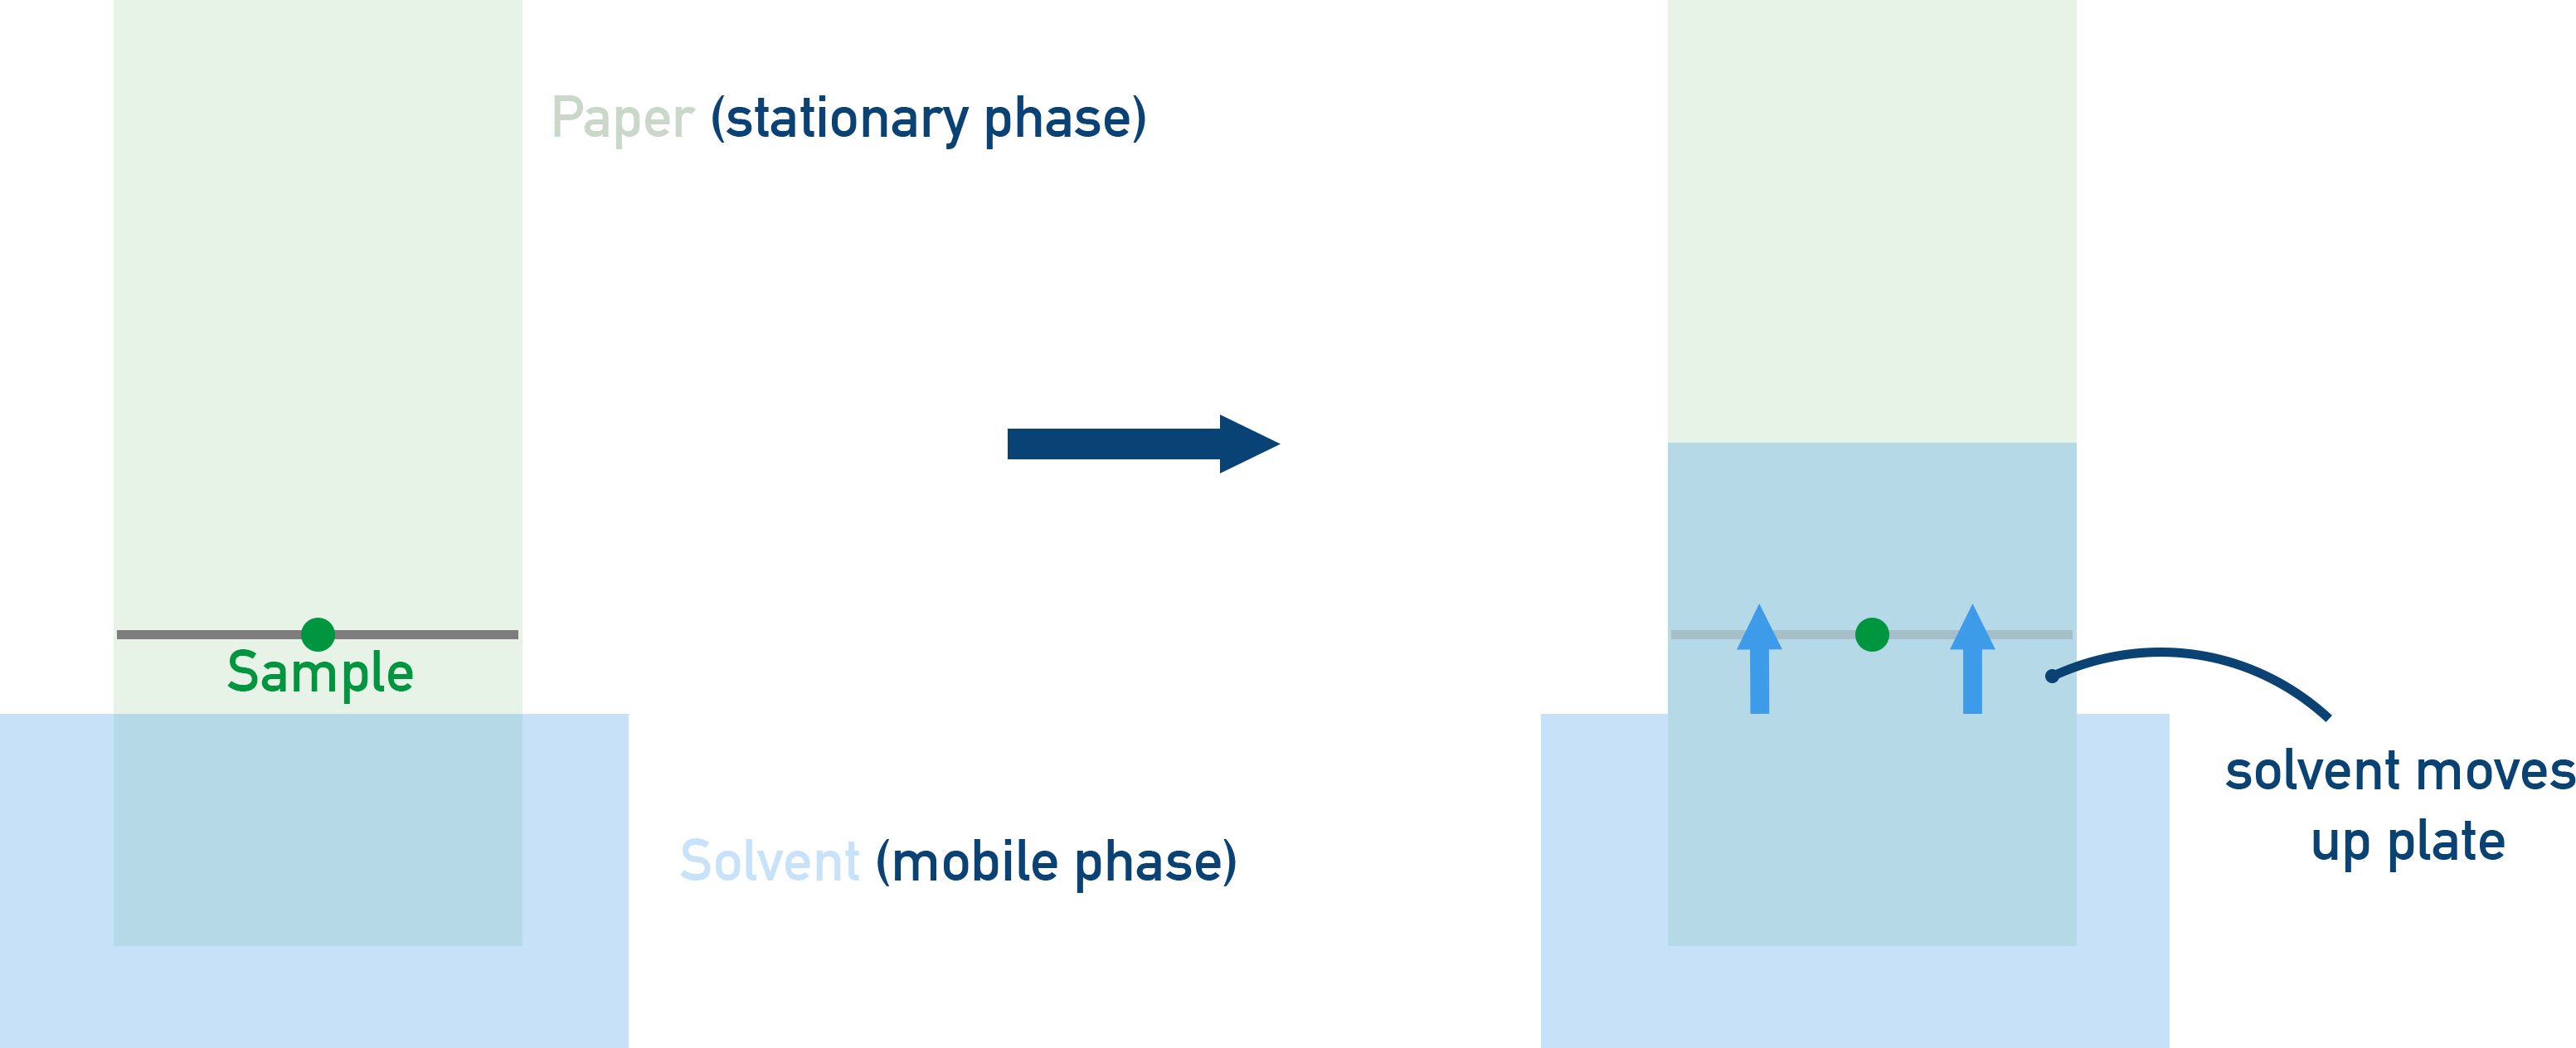
Process:
- A small sample is spotted onto the TLC plate.
- The plate is placed in a solvent, which moves up by capillary action.
- Different components move different distances based on solubility and attraction to the stationary phase.
Retention factor (Rf) calculation:
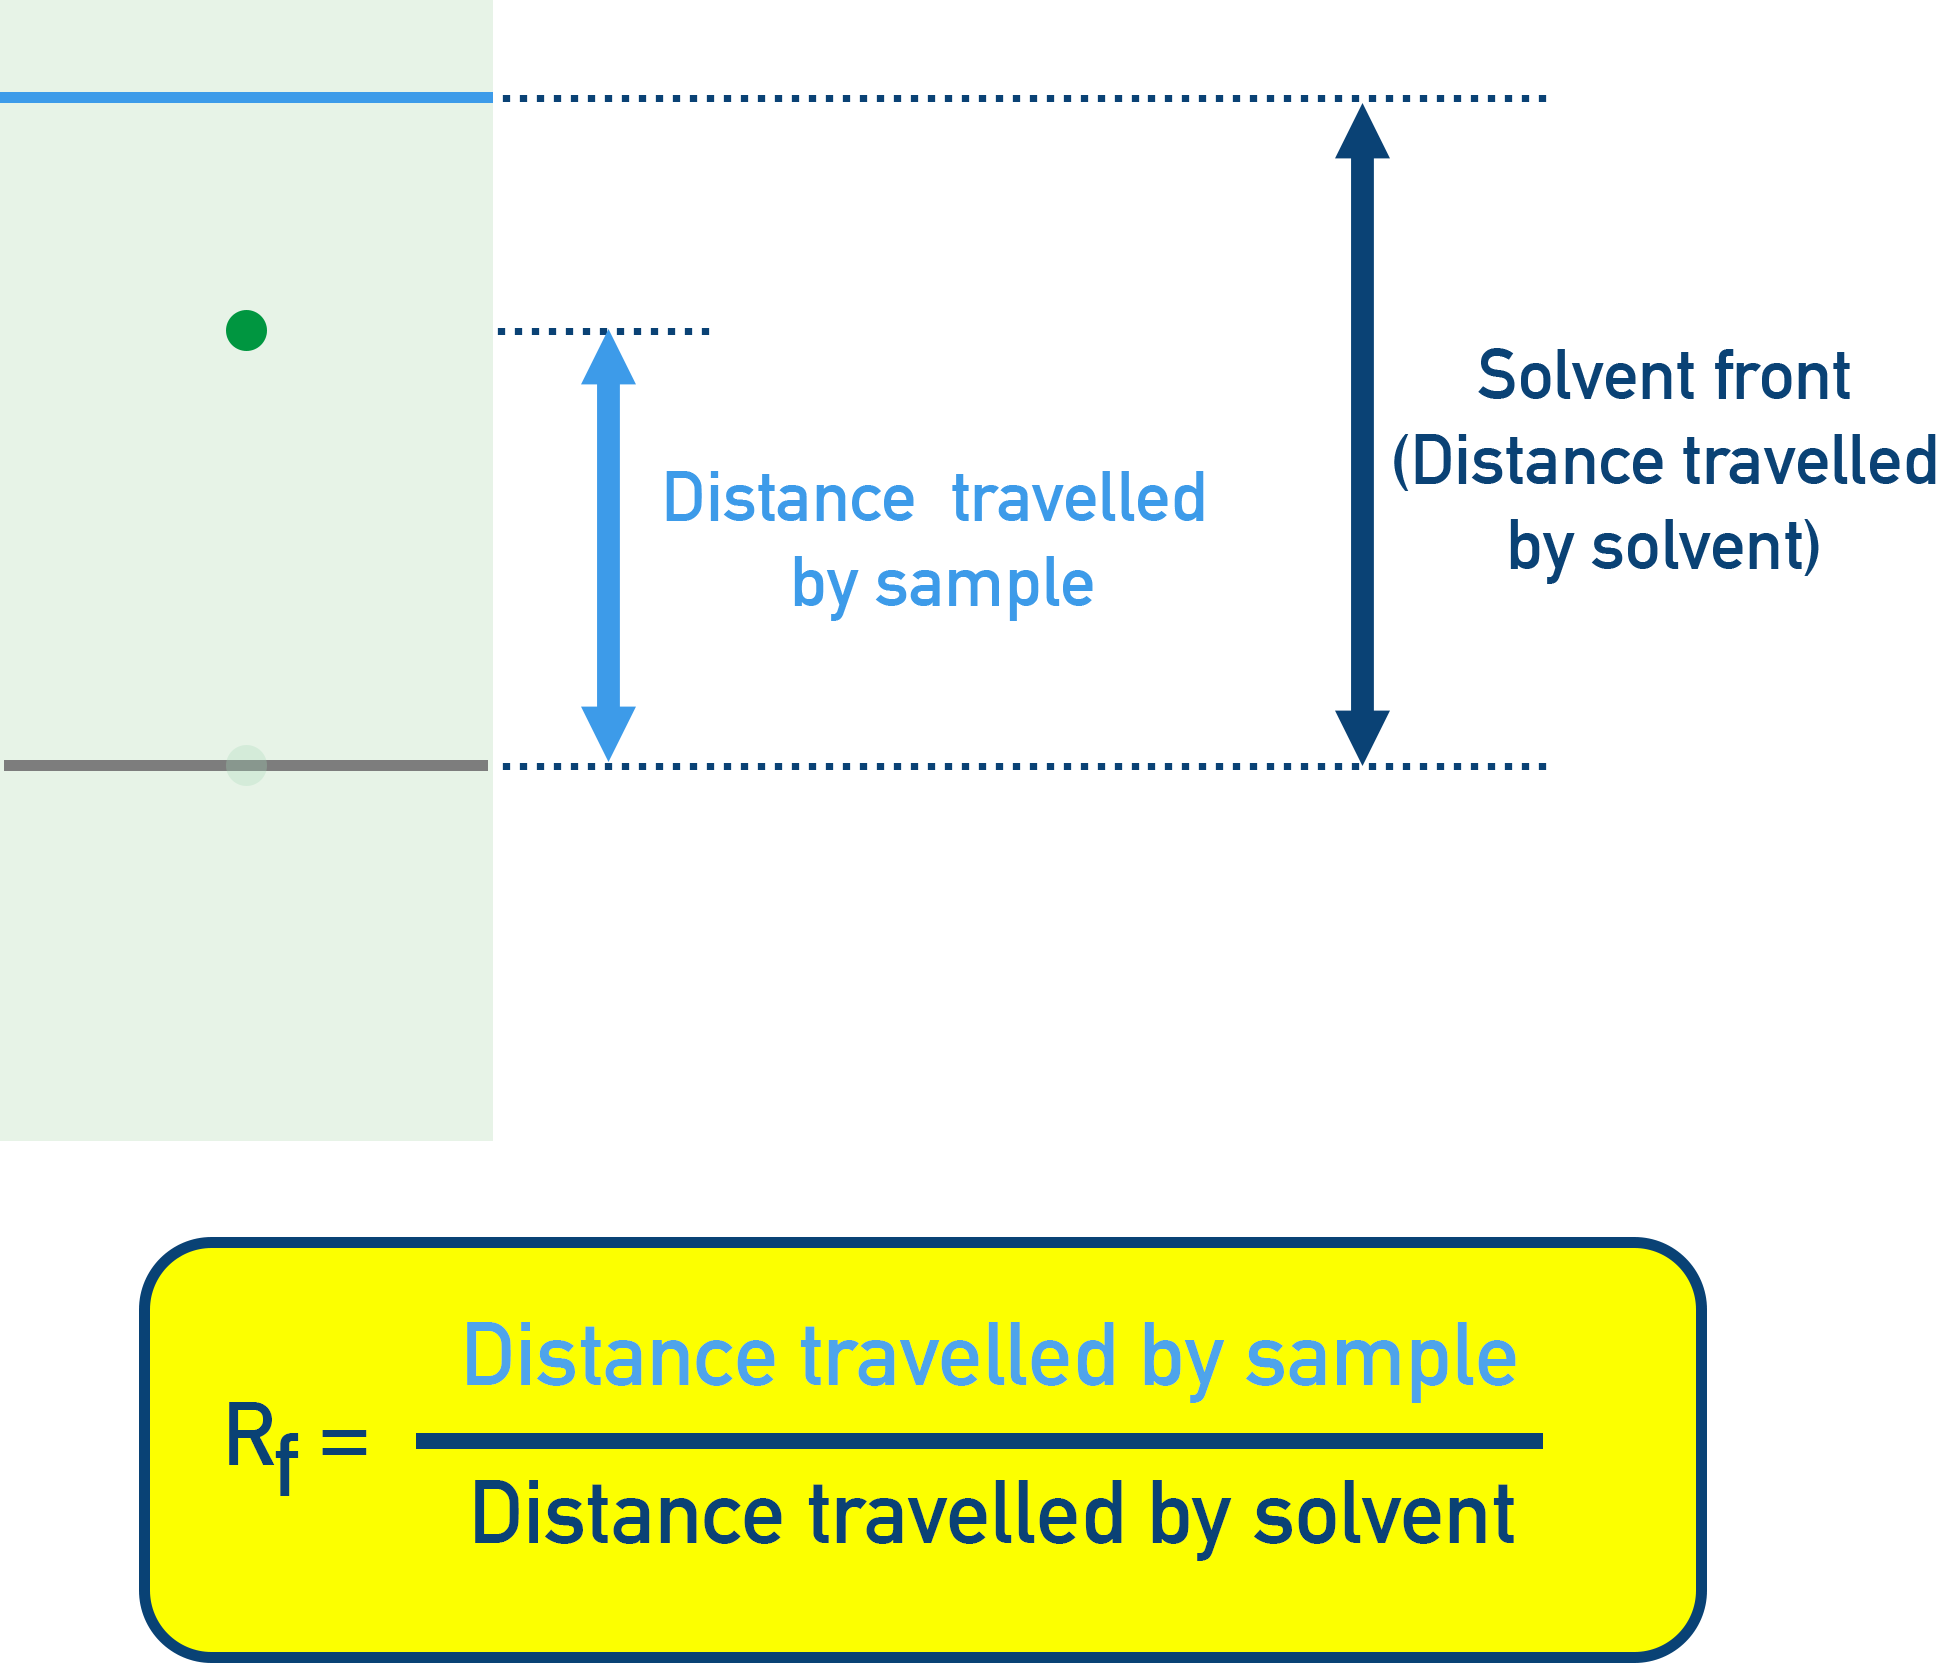
Rf = Distance moved by compound ÷ Distance moved by solvent
Rf values are compared to known standards to identify substances.
The greater the Rf value, the more soluble the sample is in the mobile phase (solvent). For example, polar substances with a polar solvent will have a greater Rf value than non-polar substances with a polar solvent.
Note - TLC is outlined in much more detail in Required Practical 12 here.
Column Chromatography (CC)
Stationary phase: A solid (e.g., silica) packed into a column.
Mobile phase: A liquid solvent flows down the column.
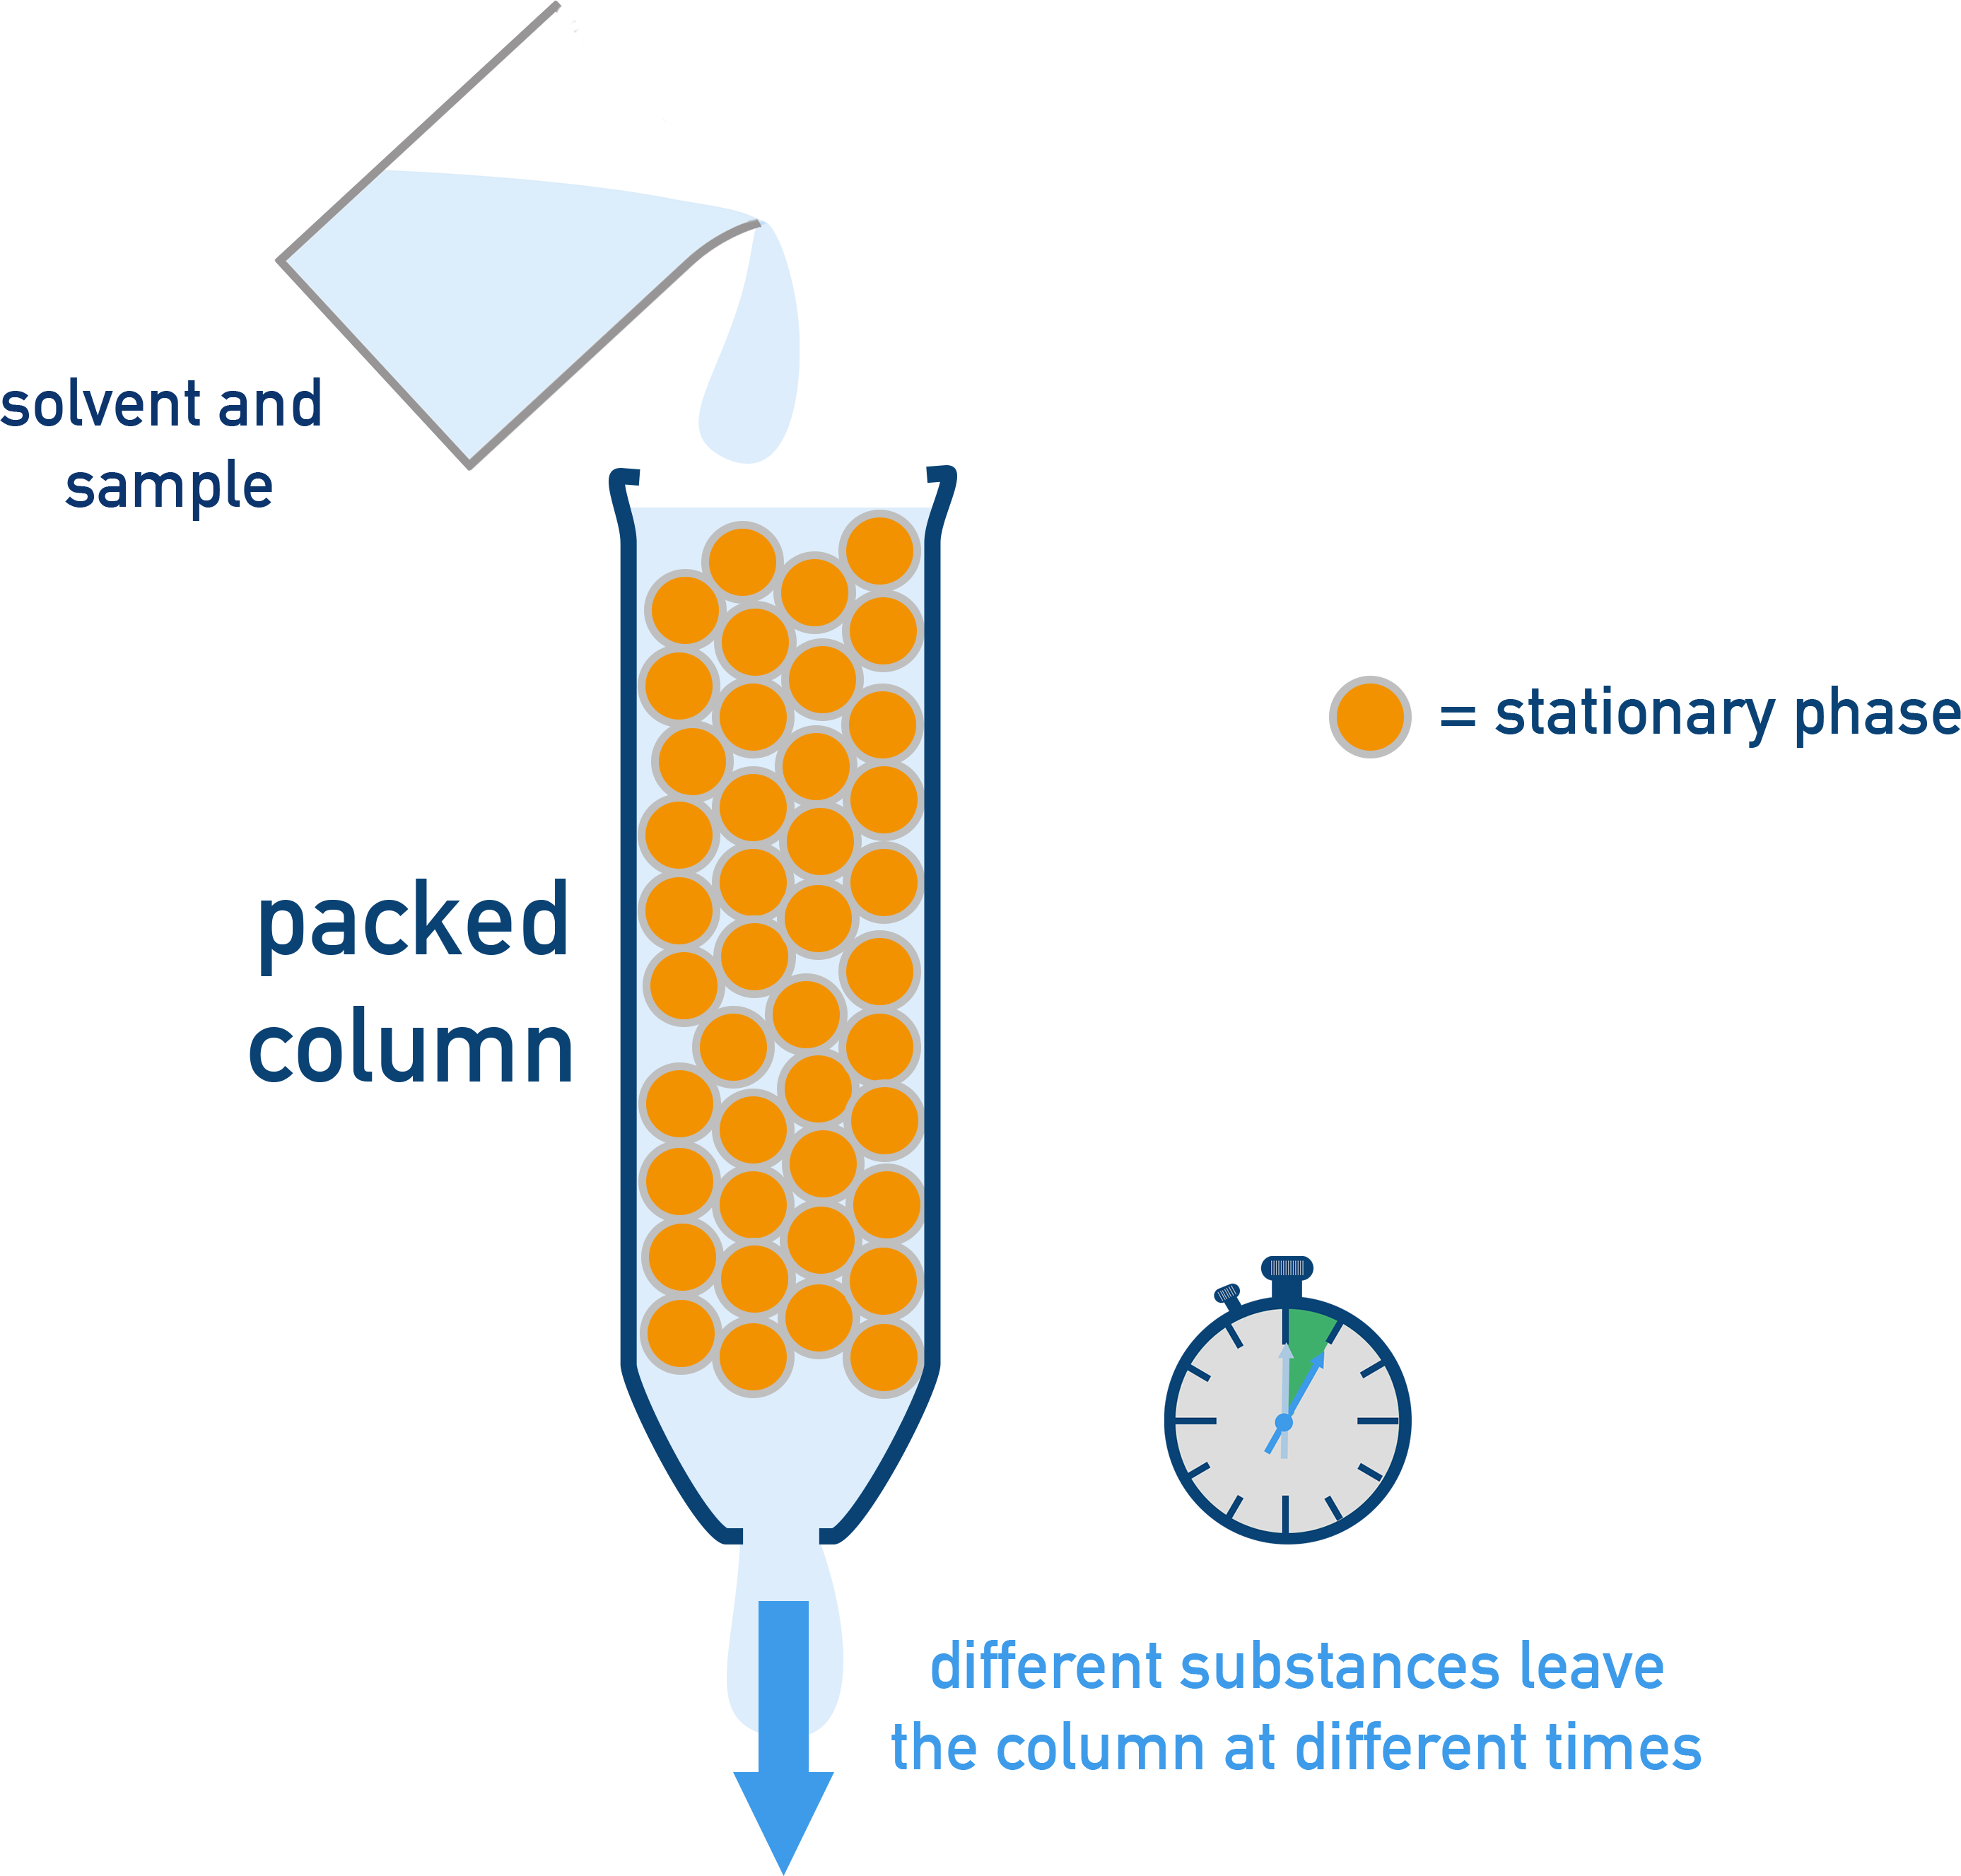
Process:
- The sample is added to the top of the column.
- The solvent carries different components at different rates.
- Different substances are collected at different times and identified.
Gas Chromatography (GC)
Stationary phase: A solid or liquid coating inside a column.
Mobile phase: An inert gas (e.g., helium).
Conditions: High temperature and pressure.

Process:
- The sample is vaporised and injected into the column.
- Components travel through at different speeds based on interactions with the stationary phase.
- Each component has a unique retention time (time taken to exit the column).
GC is often combined with mass spectrometry (GC-MS) for precise identification.
Use of Mass Spectrometry in GC-MS
Gas Chromatography (GC) can be used to separate the component in a mixture and then these substances are analysed using Mass Spectrometry (MS).
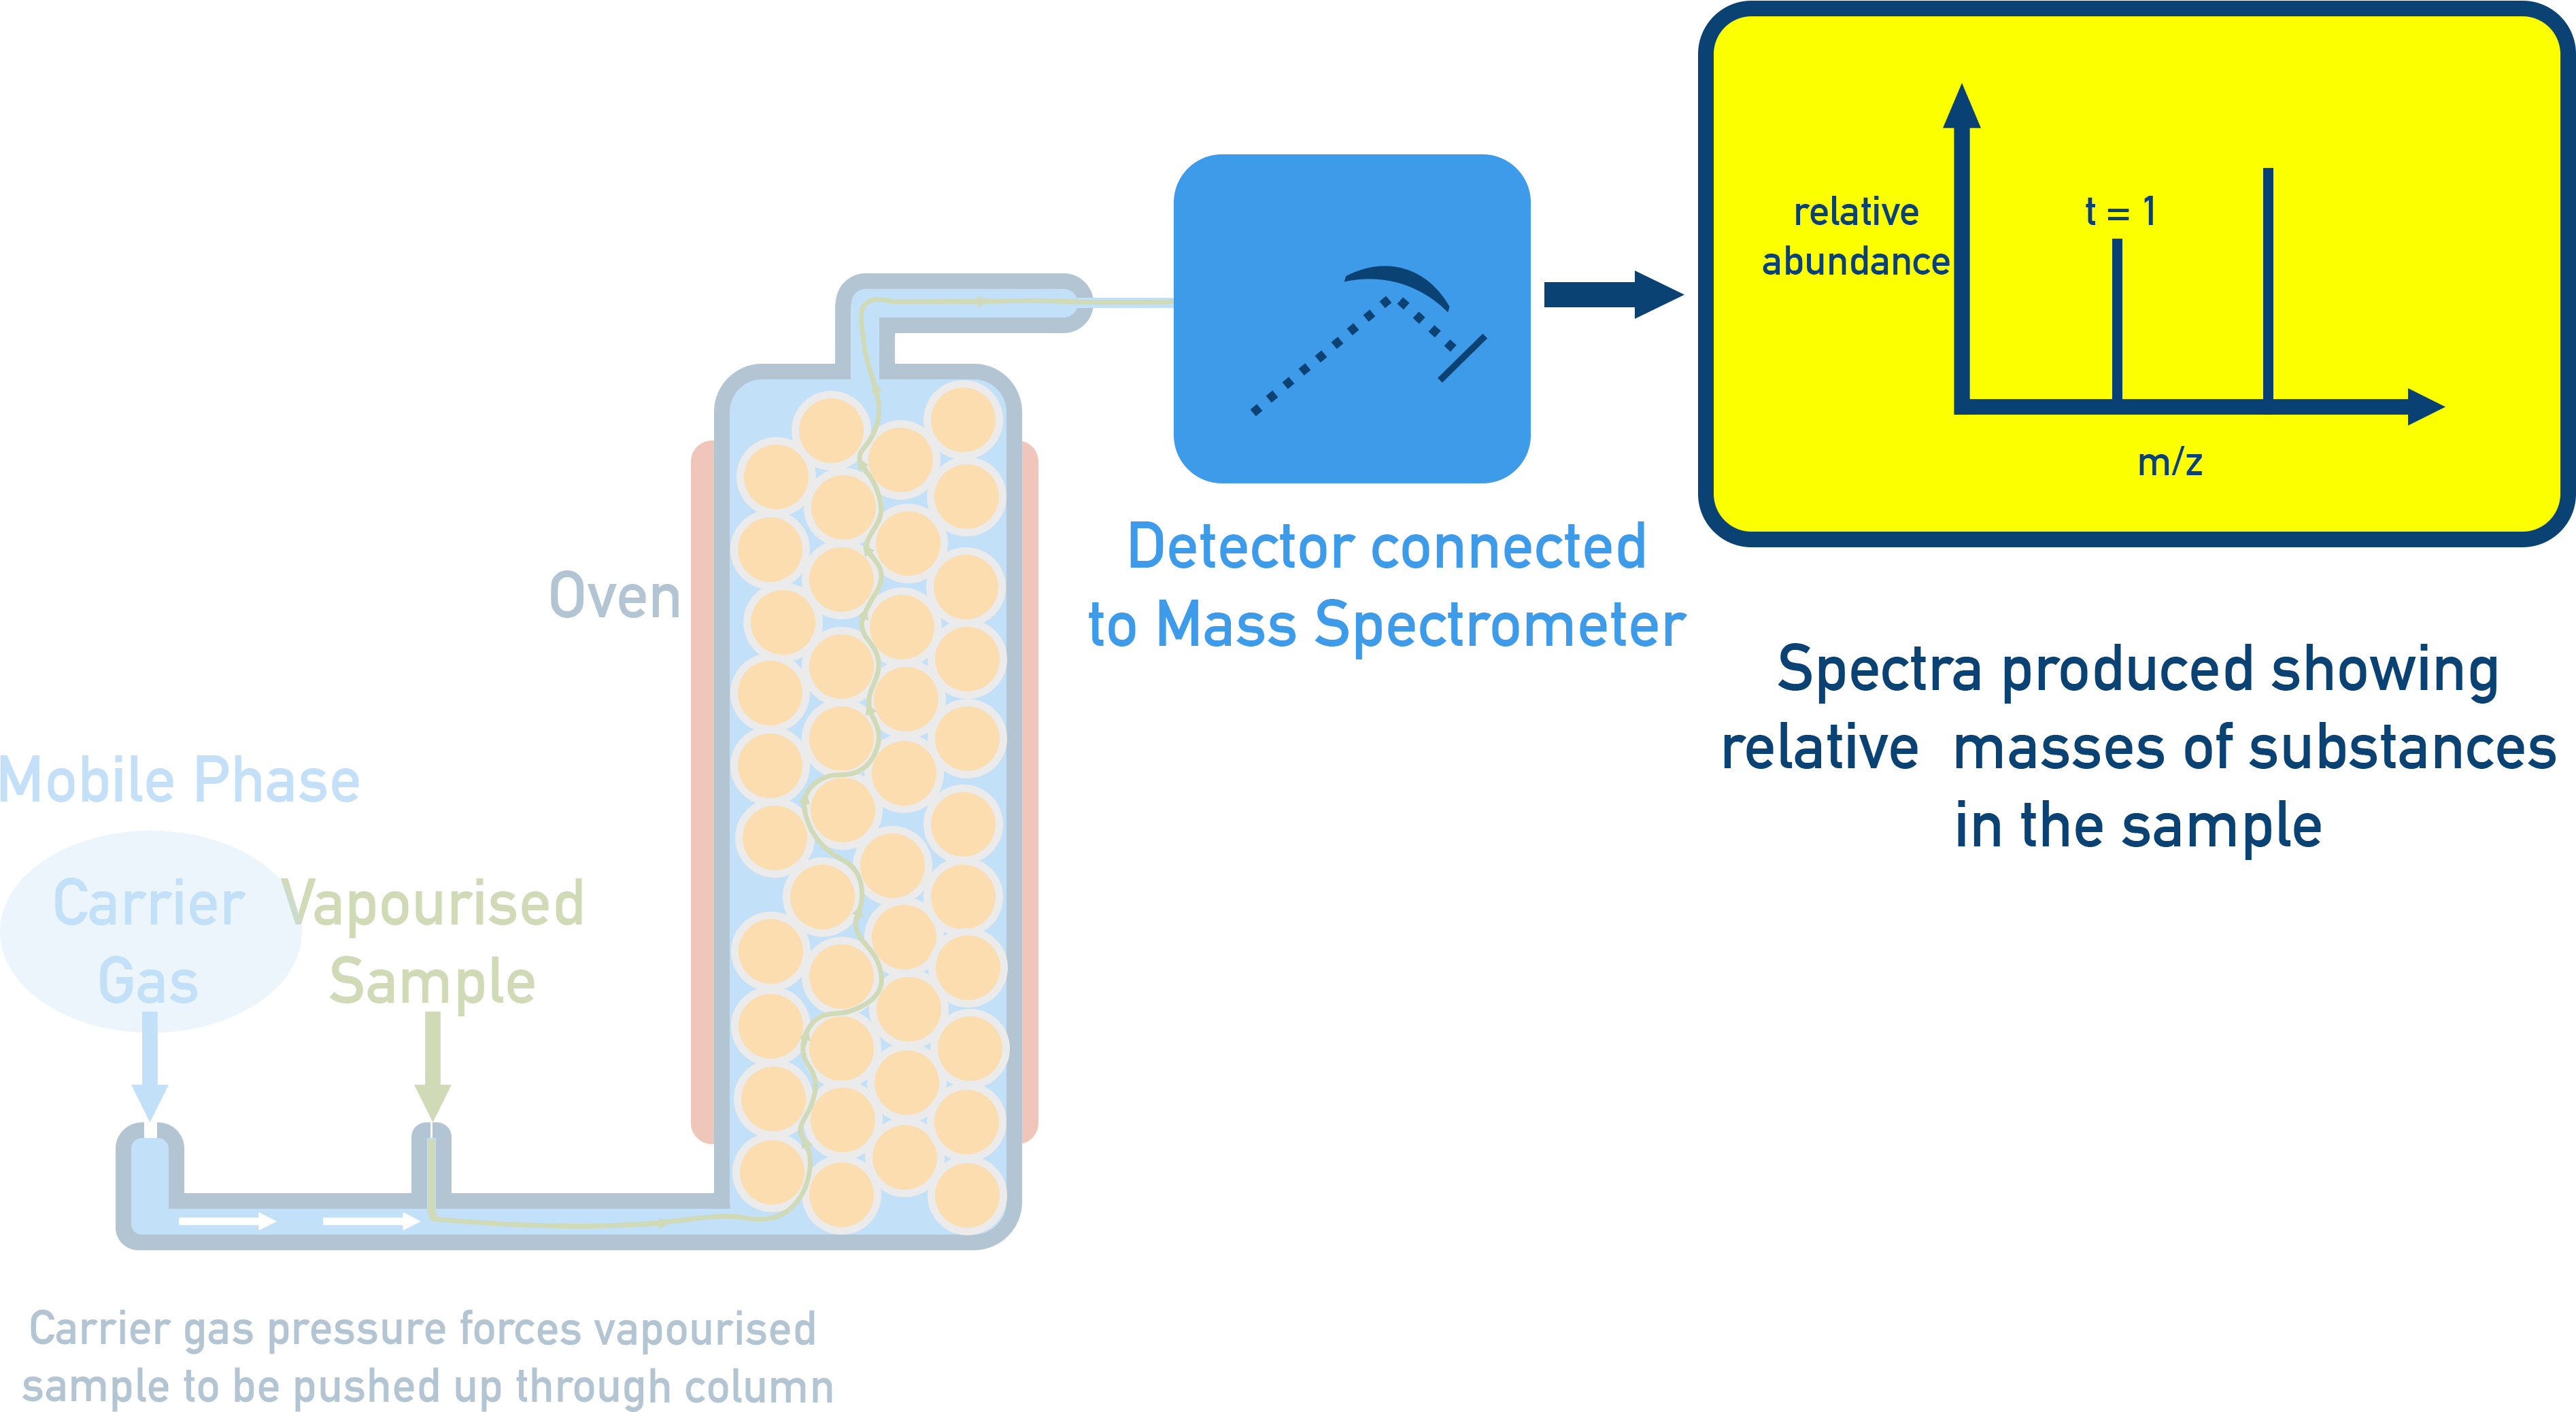
The spectra produced gives molecular mass data which can be used to confirm structures.
Comparing Rf Values and Retention Times
Depending on the technique used, different measurements are made.
- Rf Value (TLC): Measures how far a substance moves in the mobile phase.
Rf = Distance moved by compound ÷ Distance moved by solvent.
Larger Rf values mean greater solubility in the mobile phase. - Retention Time (GC): Measures how long a substance takes to pass through the column.
Longer retention times mean stronger interactions with the stationary phase. - Both values are compared to known standards for identification.
Summary
- Chromatography separates mixtures using a stationary phase and a mobile phase.
- TLC uses a coated plate and a liquid solvent; substances are identified using Rf values.
- Column chromatography employs a packed column; components elute at different times.
- Gas chromatography uses an inert carrier gas and a heated column; components are identified by retention times.
- GC–MS couples separation (GC) with identification (MS) to confirm structures via molecular mass data.
- Separation depends on solubility in the mobile phase and strength of interaction with the stationary phase.