
Maxwell-Boltzmann Distribution
Quick Notes
- Maxwell-Boltzmann distributions describe the distribution of kinetic energy in a gas.
- Key features of the curve:
- Starts at the origin (0,0) → no particles have zero energy.
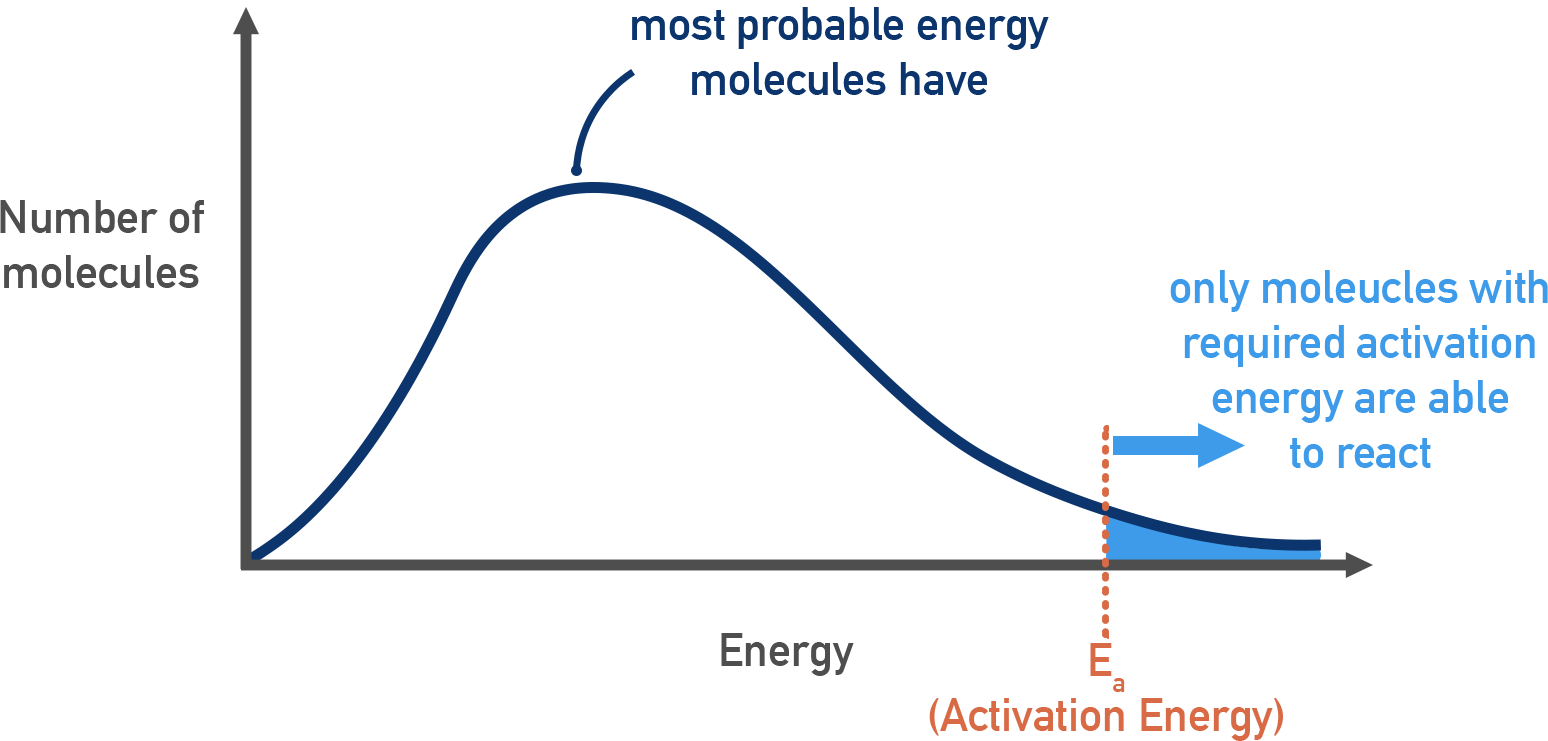
- Peaks at the most probable energy → the energy that most particles have.
- Has a long tail to the right → some particles have very high energy.
- Only particles with energy ≥ activation energy (Ea) can react.
- Increasing temperature: curve shifts right and flattens, more particles ≥ Ea = faster reaction.
- Adding a catalyst: lowers activation energy, increasing the fraction of particles that can react.
Full Notes
Maxwell-Boltzmann distributions are graphs that show how available energy is spread out and shared amongst molecules of a gas. They help explain why:
- Not all molecules have the same energy.
- Only a small fraction of molecules have enough energy to react.
- Increasing temperature increases reaction rate.
Features of the Maxwell-Boltzmann Curve
- Starts at the origin (0,0) → no particles have zero energy.
- Peaks at the most probable energy → the energy most particles have.
- Has a long tail to the right → a few molecules have very high energy (never crosses x-axis again).
- Area under the curve = total number of molecules.
- Only molecules with energy ≥ activation energy (Ea) can react.
Temperature and Catalysts
How changing temperature and using a catalyst affect the rate of a reaction can be explained visually using Maxwell-Boltzmann distribution curves.
Effect of Temperature:
Increasing temperature causes the curve to shift right and flatten slightly.
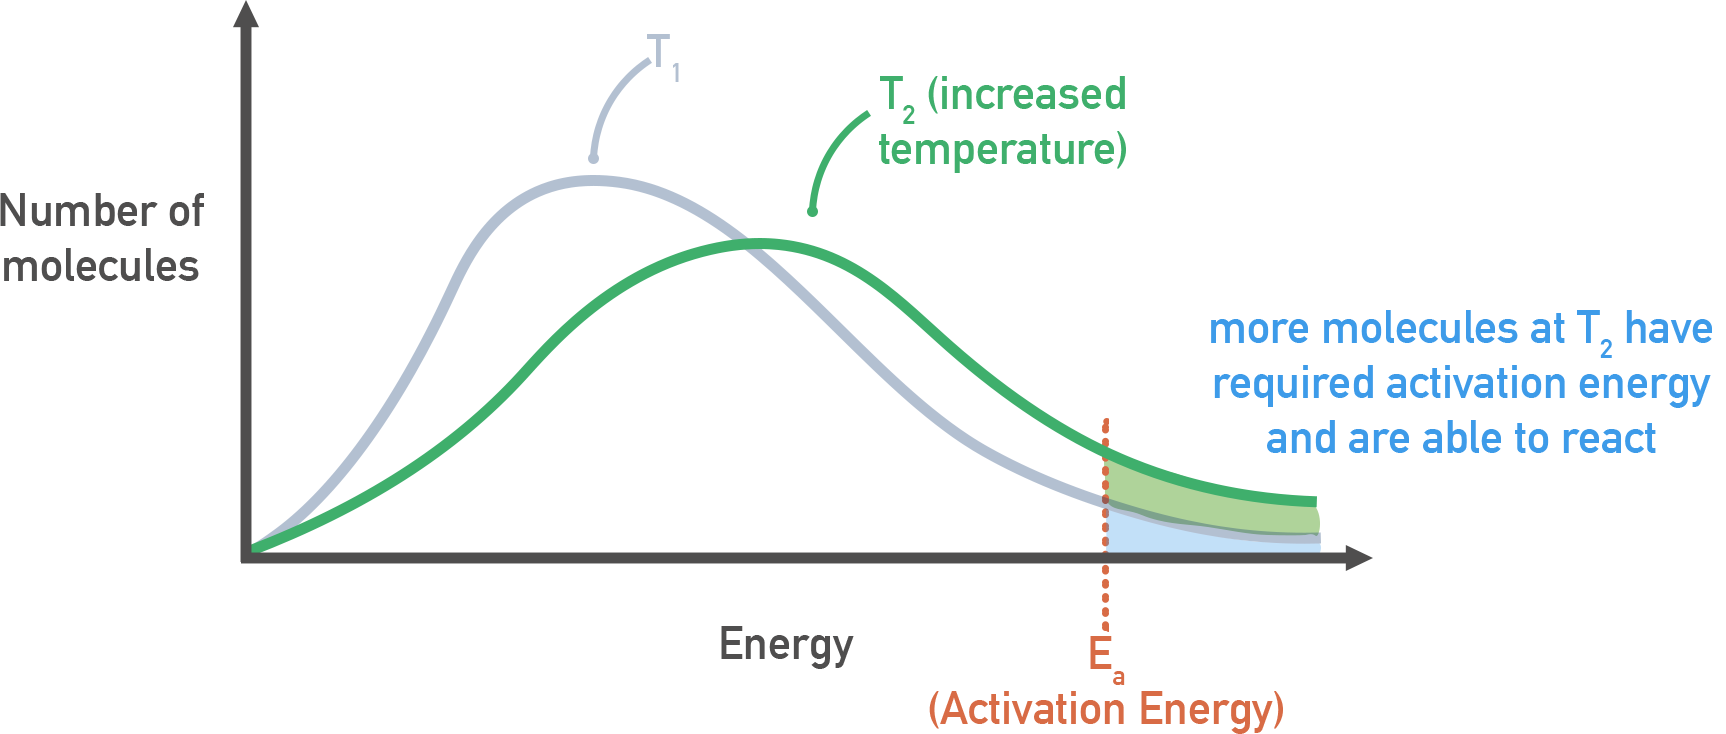
- More particles exceed activation energy (Ea).
- Frequency of successful collisions increases.
- Reaction rate increases sharply, even with small temperature rise.
Effect of a Catalyst:
Using a catalyst lowers the activation energy barrier, moving the Ea line left on the curve.
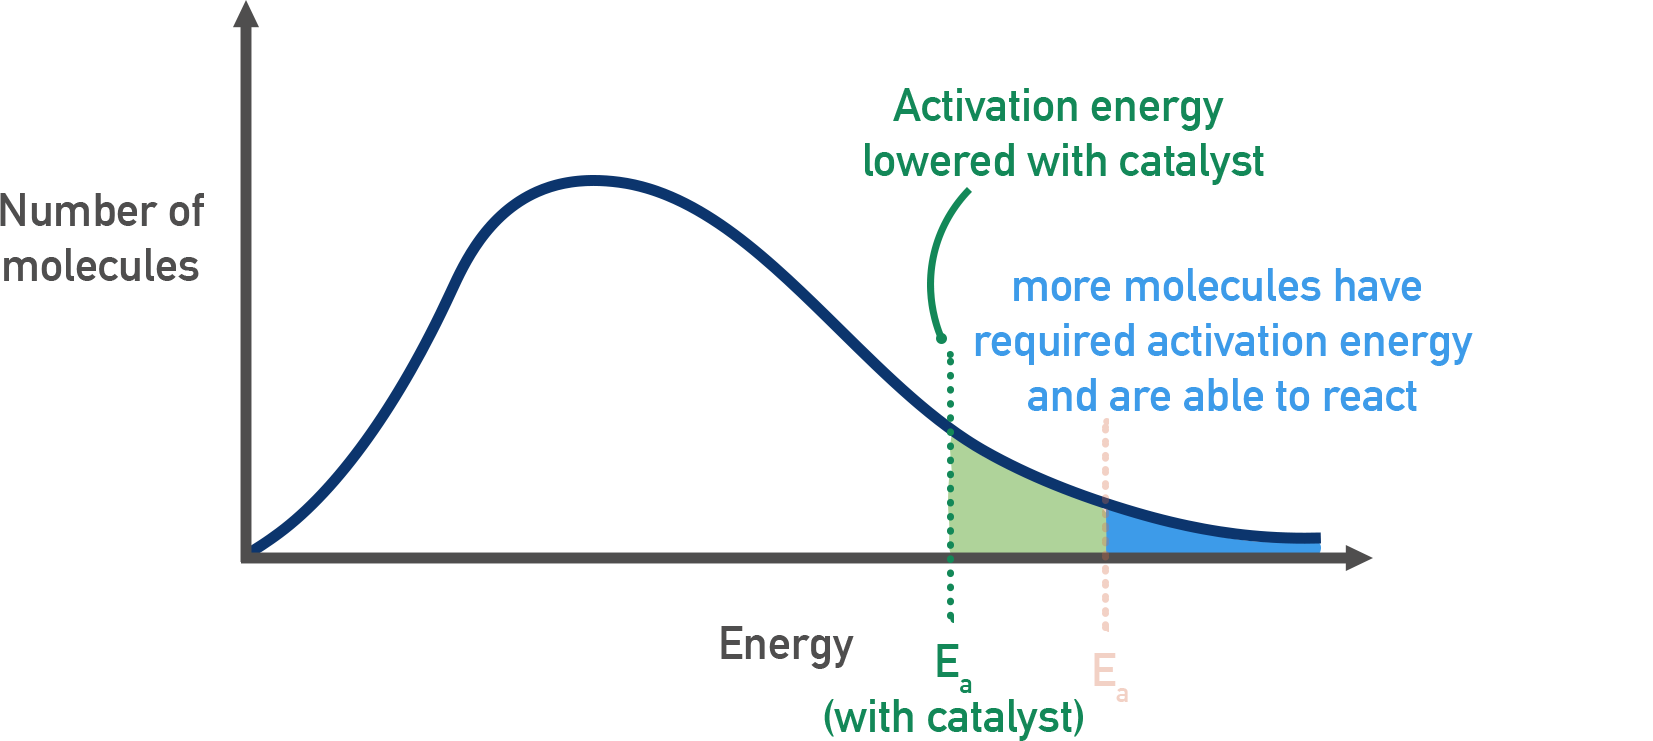
More particles now have sufficient energy (≥ Ea) meaning the reaction is faster.

Increasing the temperature or using a catalyst increases the area under the curve beyond Ea. This represents the proportion of particles that can react. It explains why reactions don’t happen instantly – only a fraction of particles have enough energy at any time.
Summary
- Maxwell-Boltzmann distribution shows how particle energies are spread in gases.
- Only particles with energy ≥ activation energy can react.
- Temperature increases shift the curve right and flatten it, giving more particles above Ea.
- Catalysts lower the activation energy barrier, increasing successful collisions.