
Chromatography
Quick Notes
- Thin-Layer Chromatography (TLC)
- Separates compounds based on relative solubilities in solvent (mobile phase) and affinities to the stationary phase
- Rf value = distance moved by compound ÷ distance moved by solvent
- We can compare Rf values to known data for identification
- Gas Chromatography (GC)
- Separates volatile substances by retention time in the column
- Retention time = time taken for a component to pass through the column
- Peak area in a chromatogram is proportional to amount of substance
Full Notes
What Is Chromatography?
Chromatography separates compounds in a mixture based on differences in their movement between two phases:
- Stationary phase – Solid or liquid that ‘holds on’ to compounds.
- Mobile phase – Liquid or gas that carries and moves compounds.
Substances that are more soluble in the solvent will spend more time in the mobile phase compared to less soluble substances and move further in the same time, while those with stronger interactions with the stationary phase move less.
Key Principle: Different substances in a mixture move at different speeds, depending on how strongly they interact with each phase. This causes the substances to separate out over time or distance.
Thin-Layer Chromatography (TLC)
In TLC, a sample is dotted near the base of a plate coated with silica or alumina (the stationary phase). The plate is placed in a solvent (the mobile phase) which rises up the plate by capillary action.
Substances that are more soluble in the mobile phase travel further and those that interact more with the stationary phase travel less.
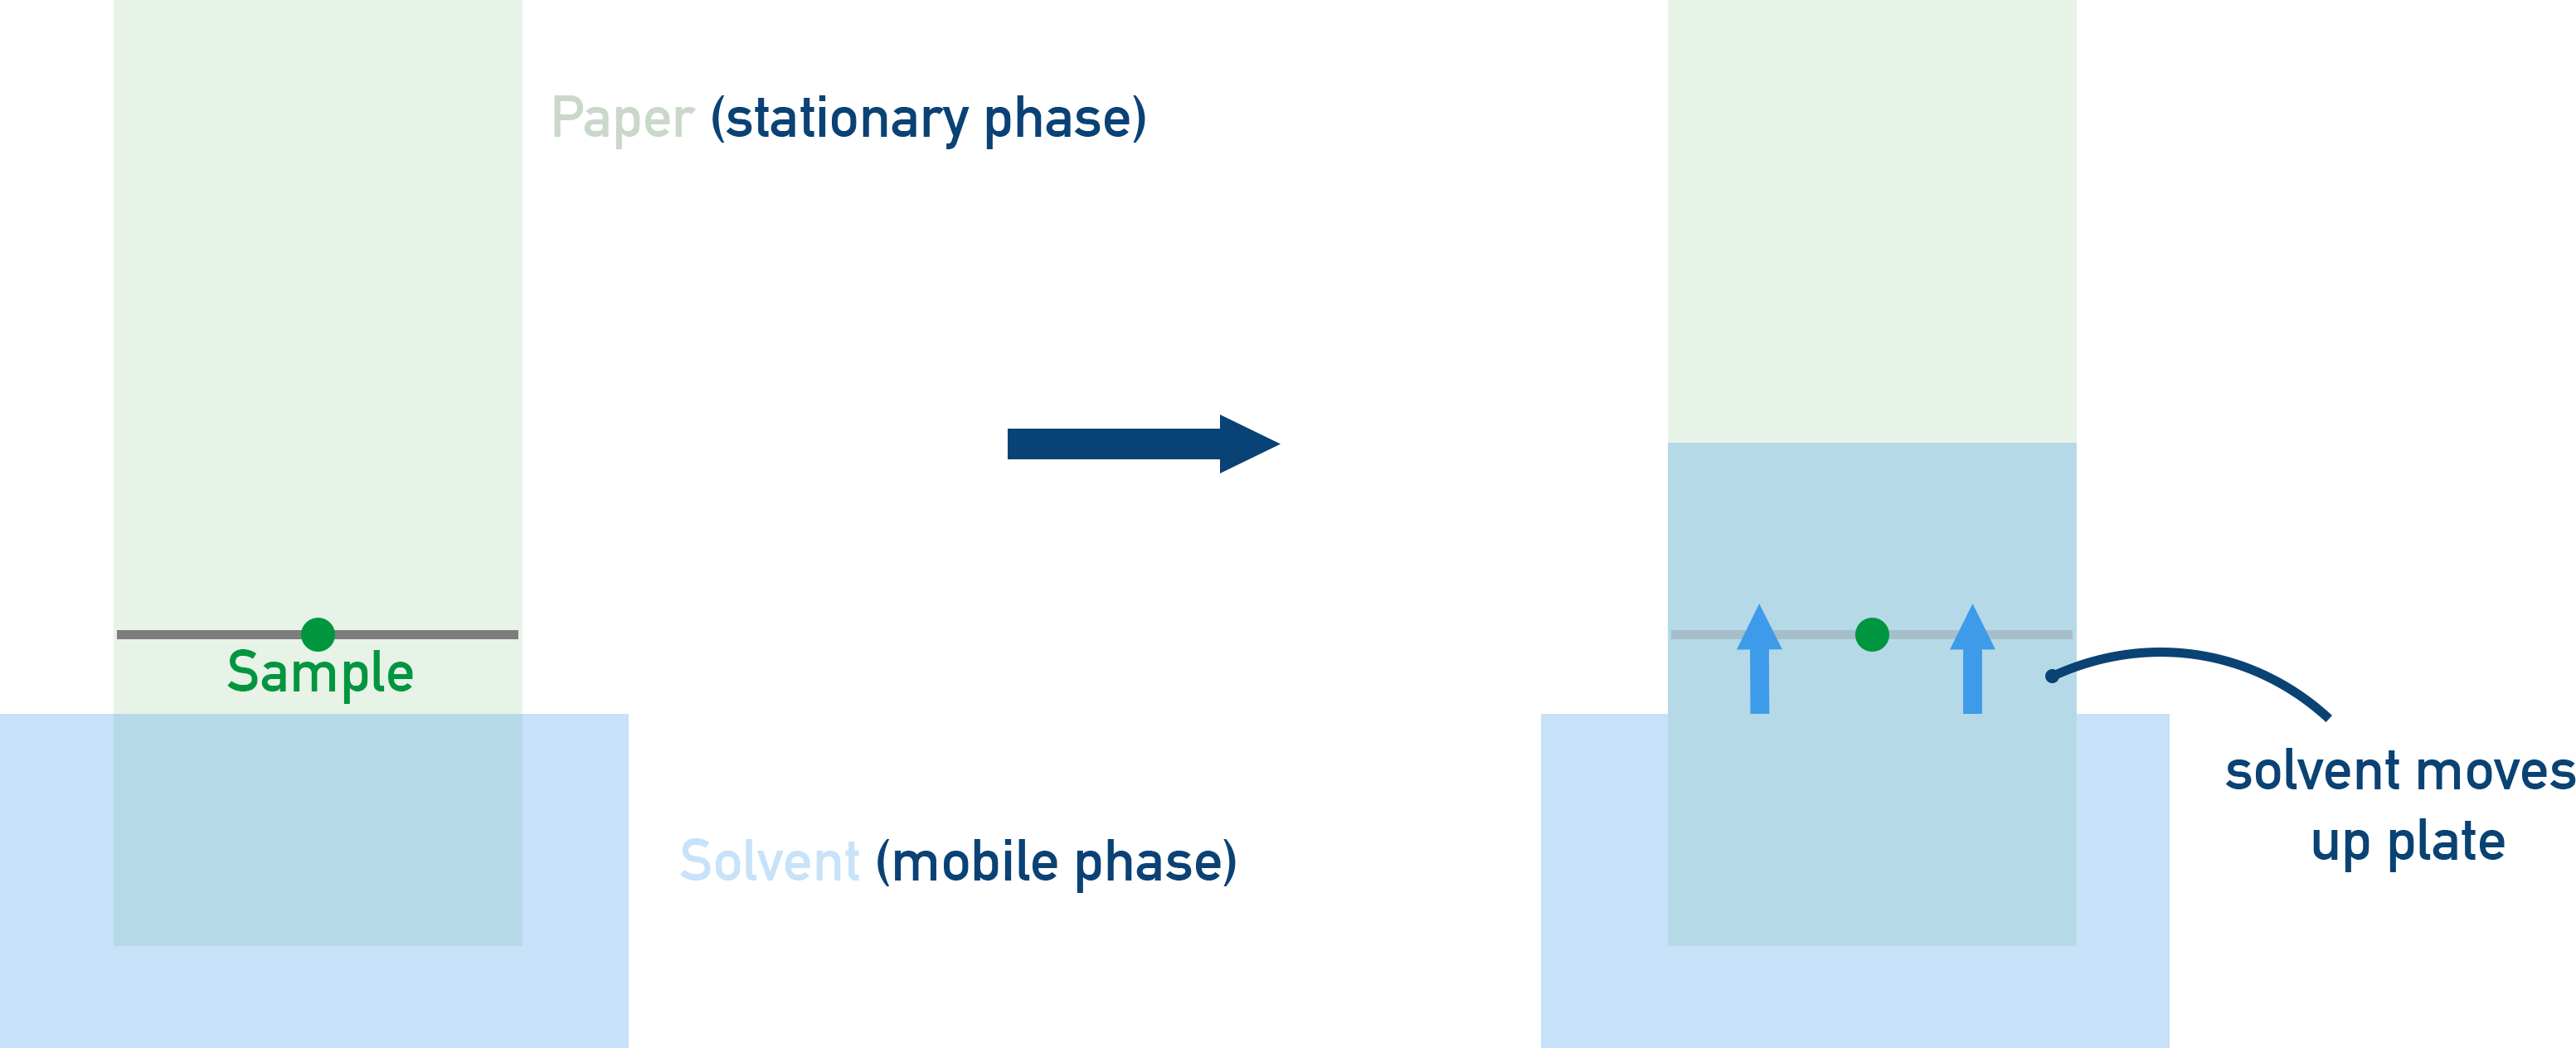
Stationary phase: A plate coated with silica or alumina.
Mobile phase: A liquid solvent (e.g., ethanol).
Process:
- A small sample is spotted onto the TLC plate.
- The plate is placed in a solvent, which moves up by capillary action.
- Different components move different distances based on solubility and attraction to the stationary phase.
Retention factor (Rf) calculation
Rf values for samples are compared to known standards to identify them.
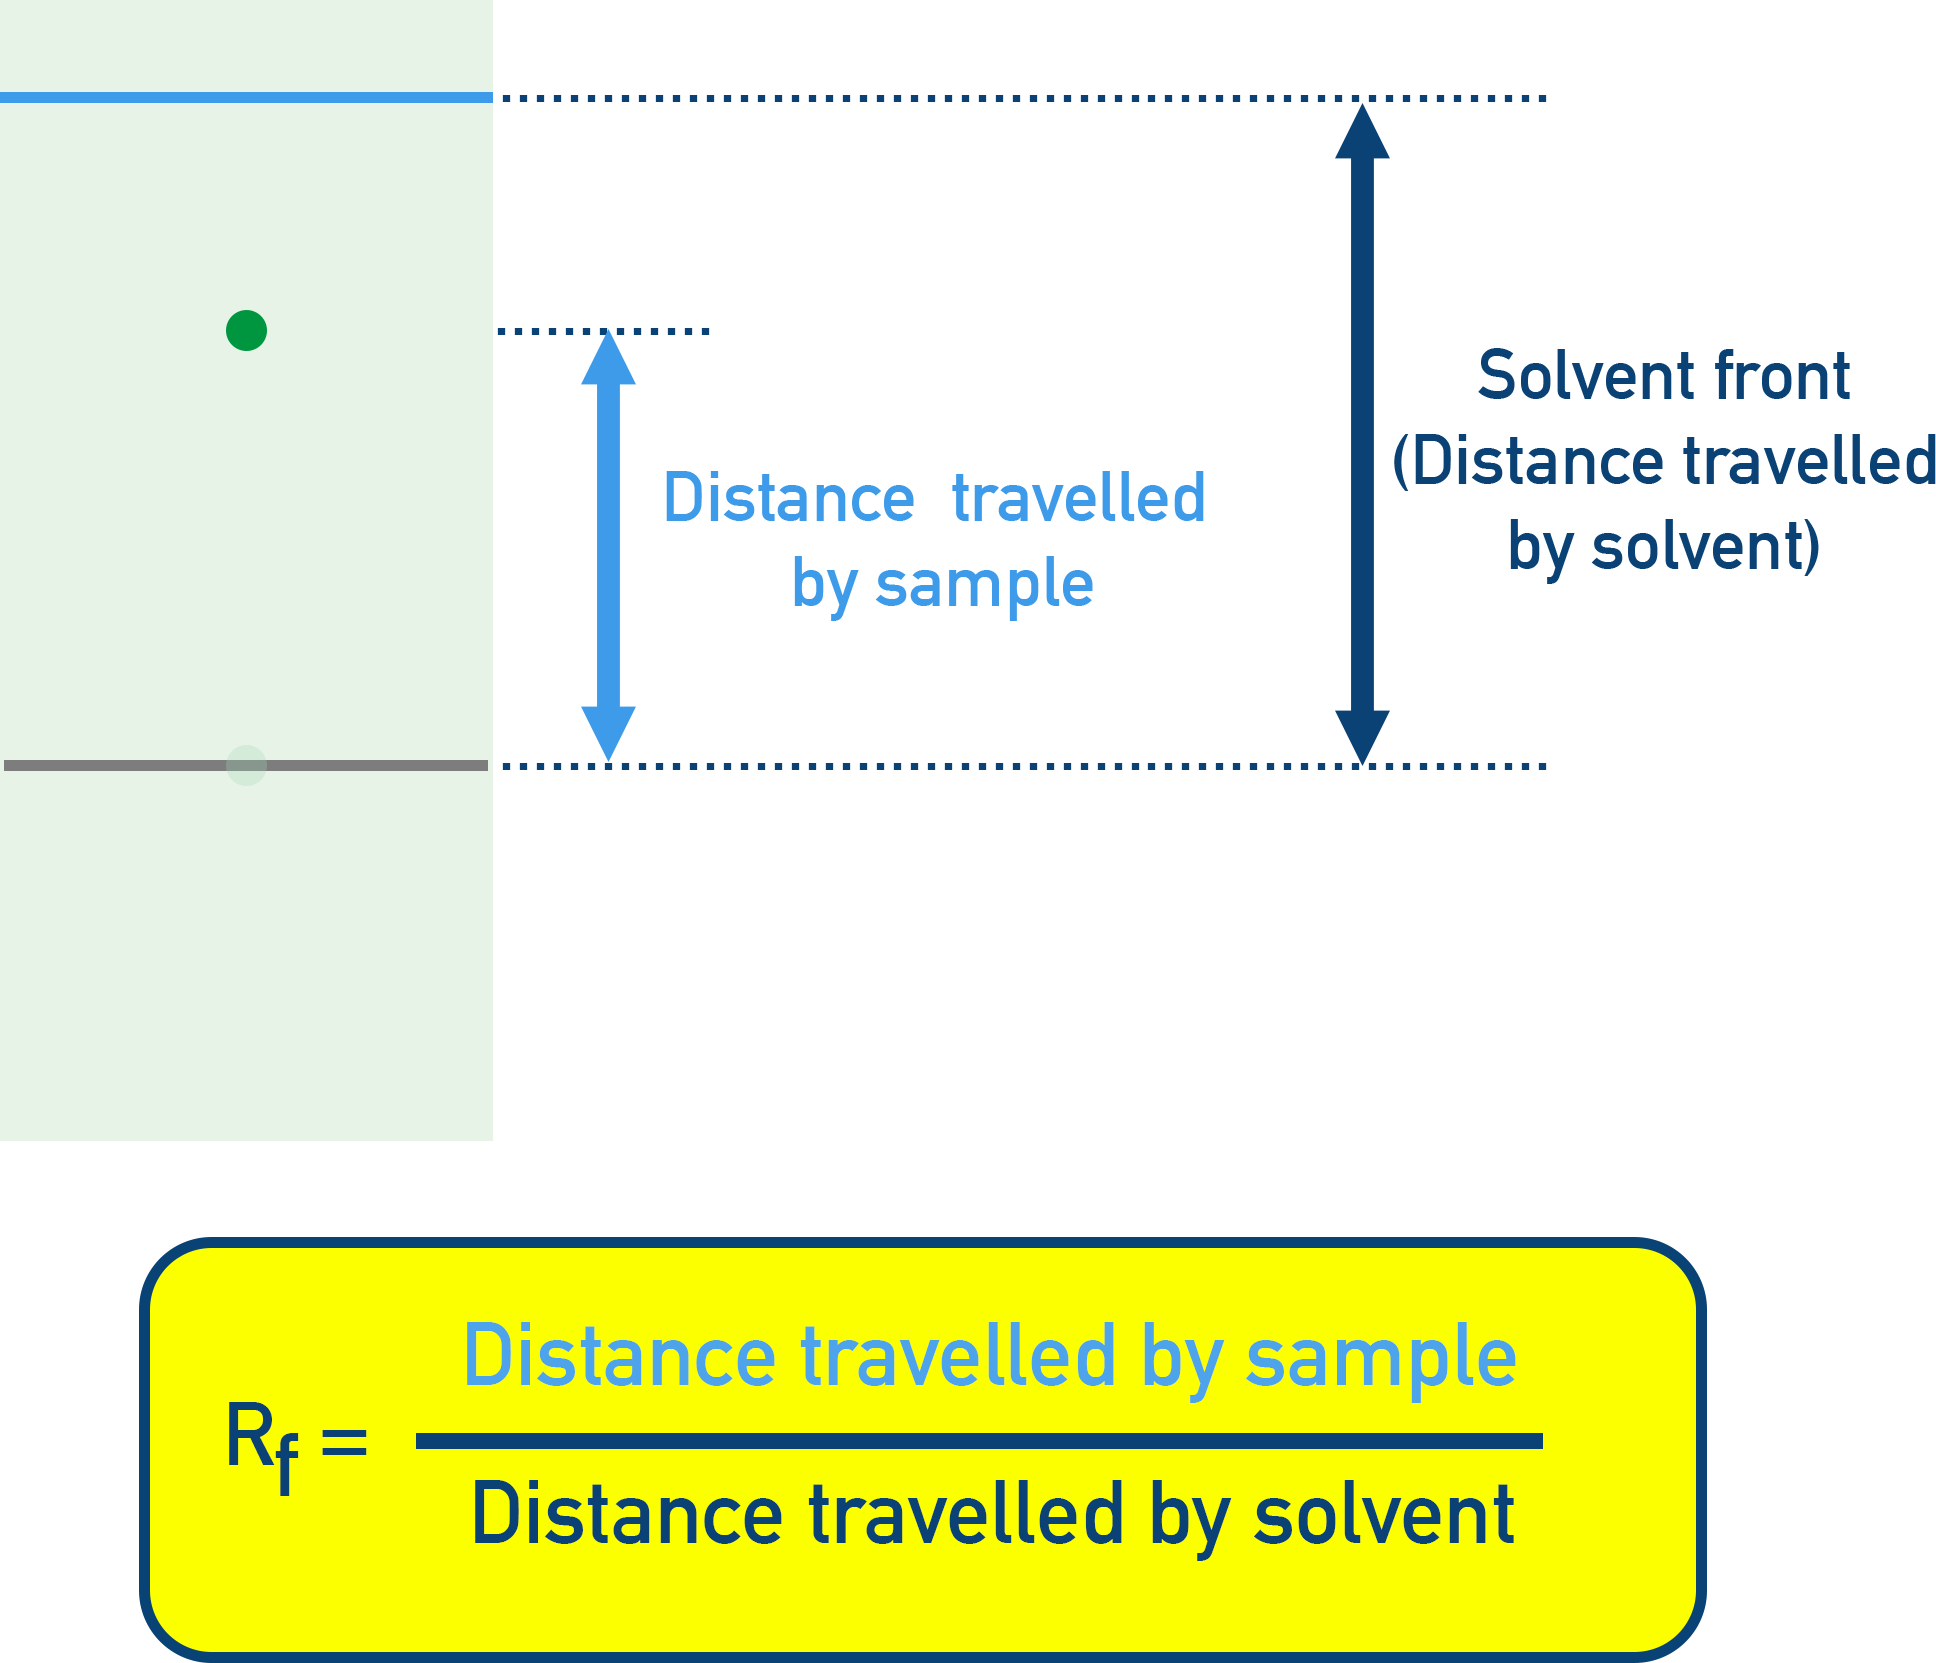
Rf = Distance moved by compound ÷ Distance moved by solvent
The greater the Rf value, the more soluble the sample is in the mobile phase (solvent).
For example, polar substances with a polar solvent will have a greater Rf value than non-polar substances with a polar solvent.
As most organic compounds are colourless, spots are often visualised under UV light or using a locating agent.
Gas Chromatography (GC)
Gas Chromatography (GC) is used to separate and identify volatile organic compounds (compounds that easily evaporate and turn into a gas).
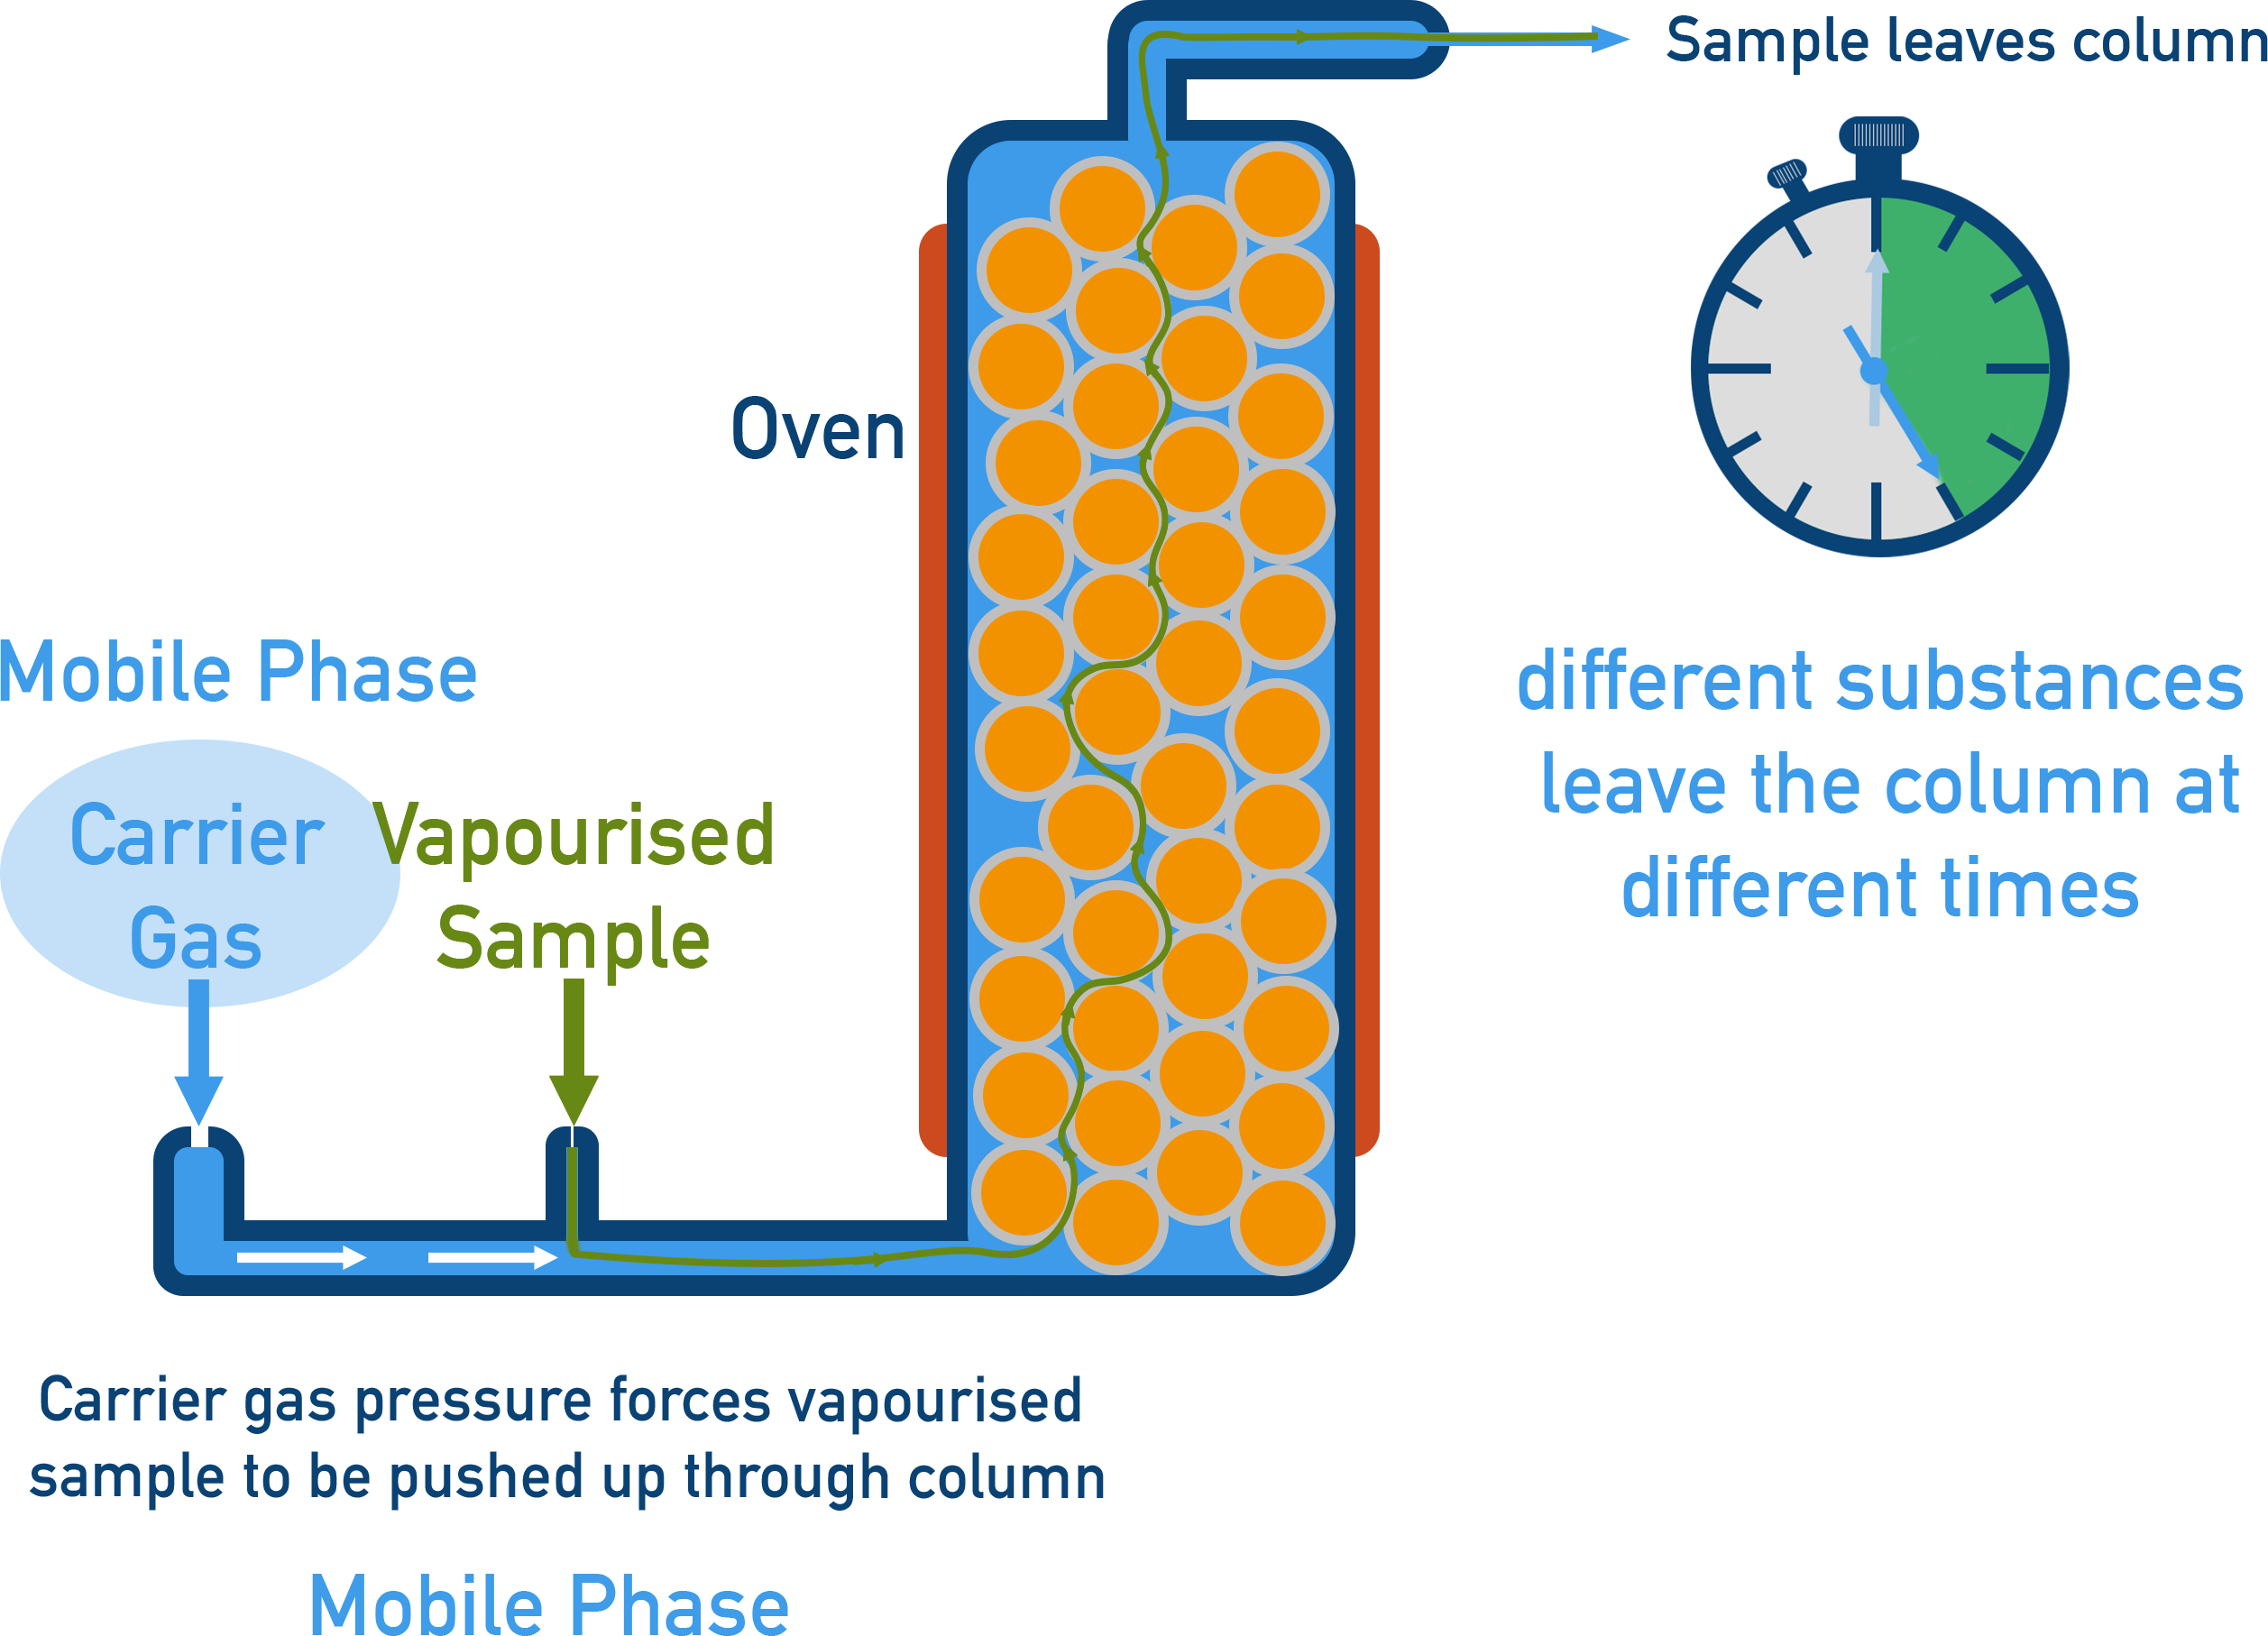
A sample is vaporised and carried by an inert gas (mobile phase) through a column containing a liquid or solid stationary phase.
Compounds in the mixture interact differently with the stationary phase, resulting in different retention times.
The time each compound takes to pass through the column is used for identification.
Interpreting a Chromatogram
Graphs called chromatograms are produed where each peak represents one compound or substance in the mixture.
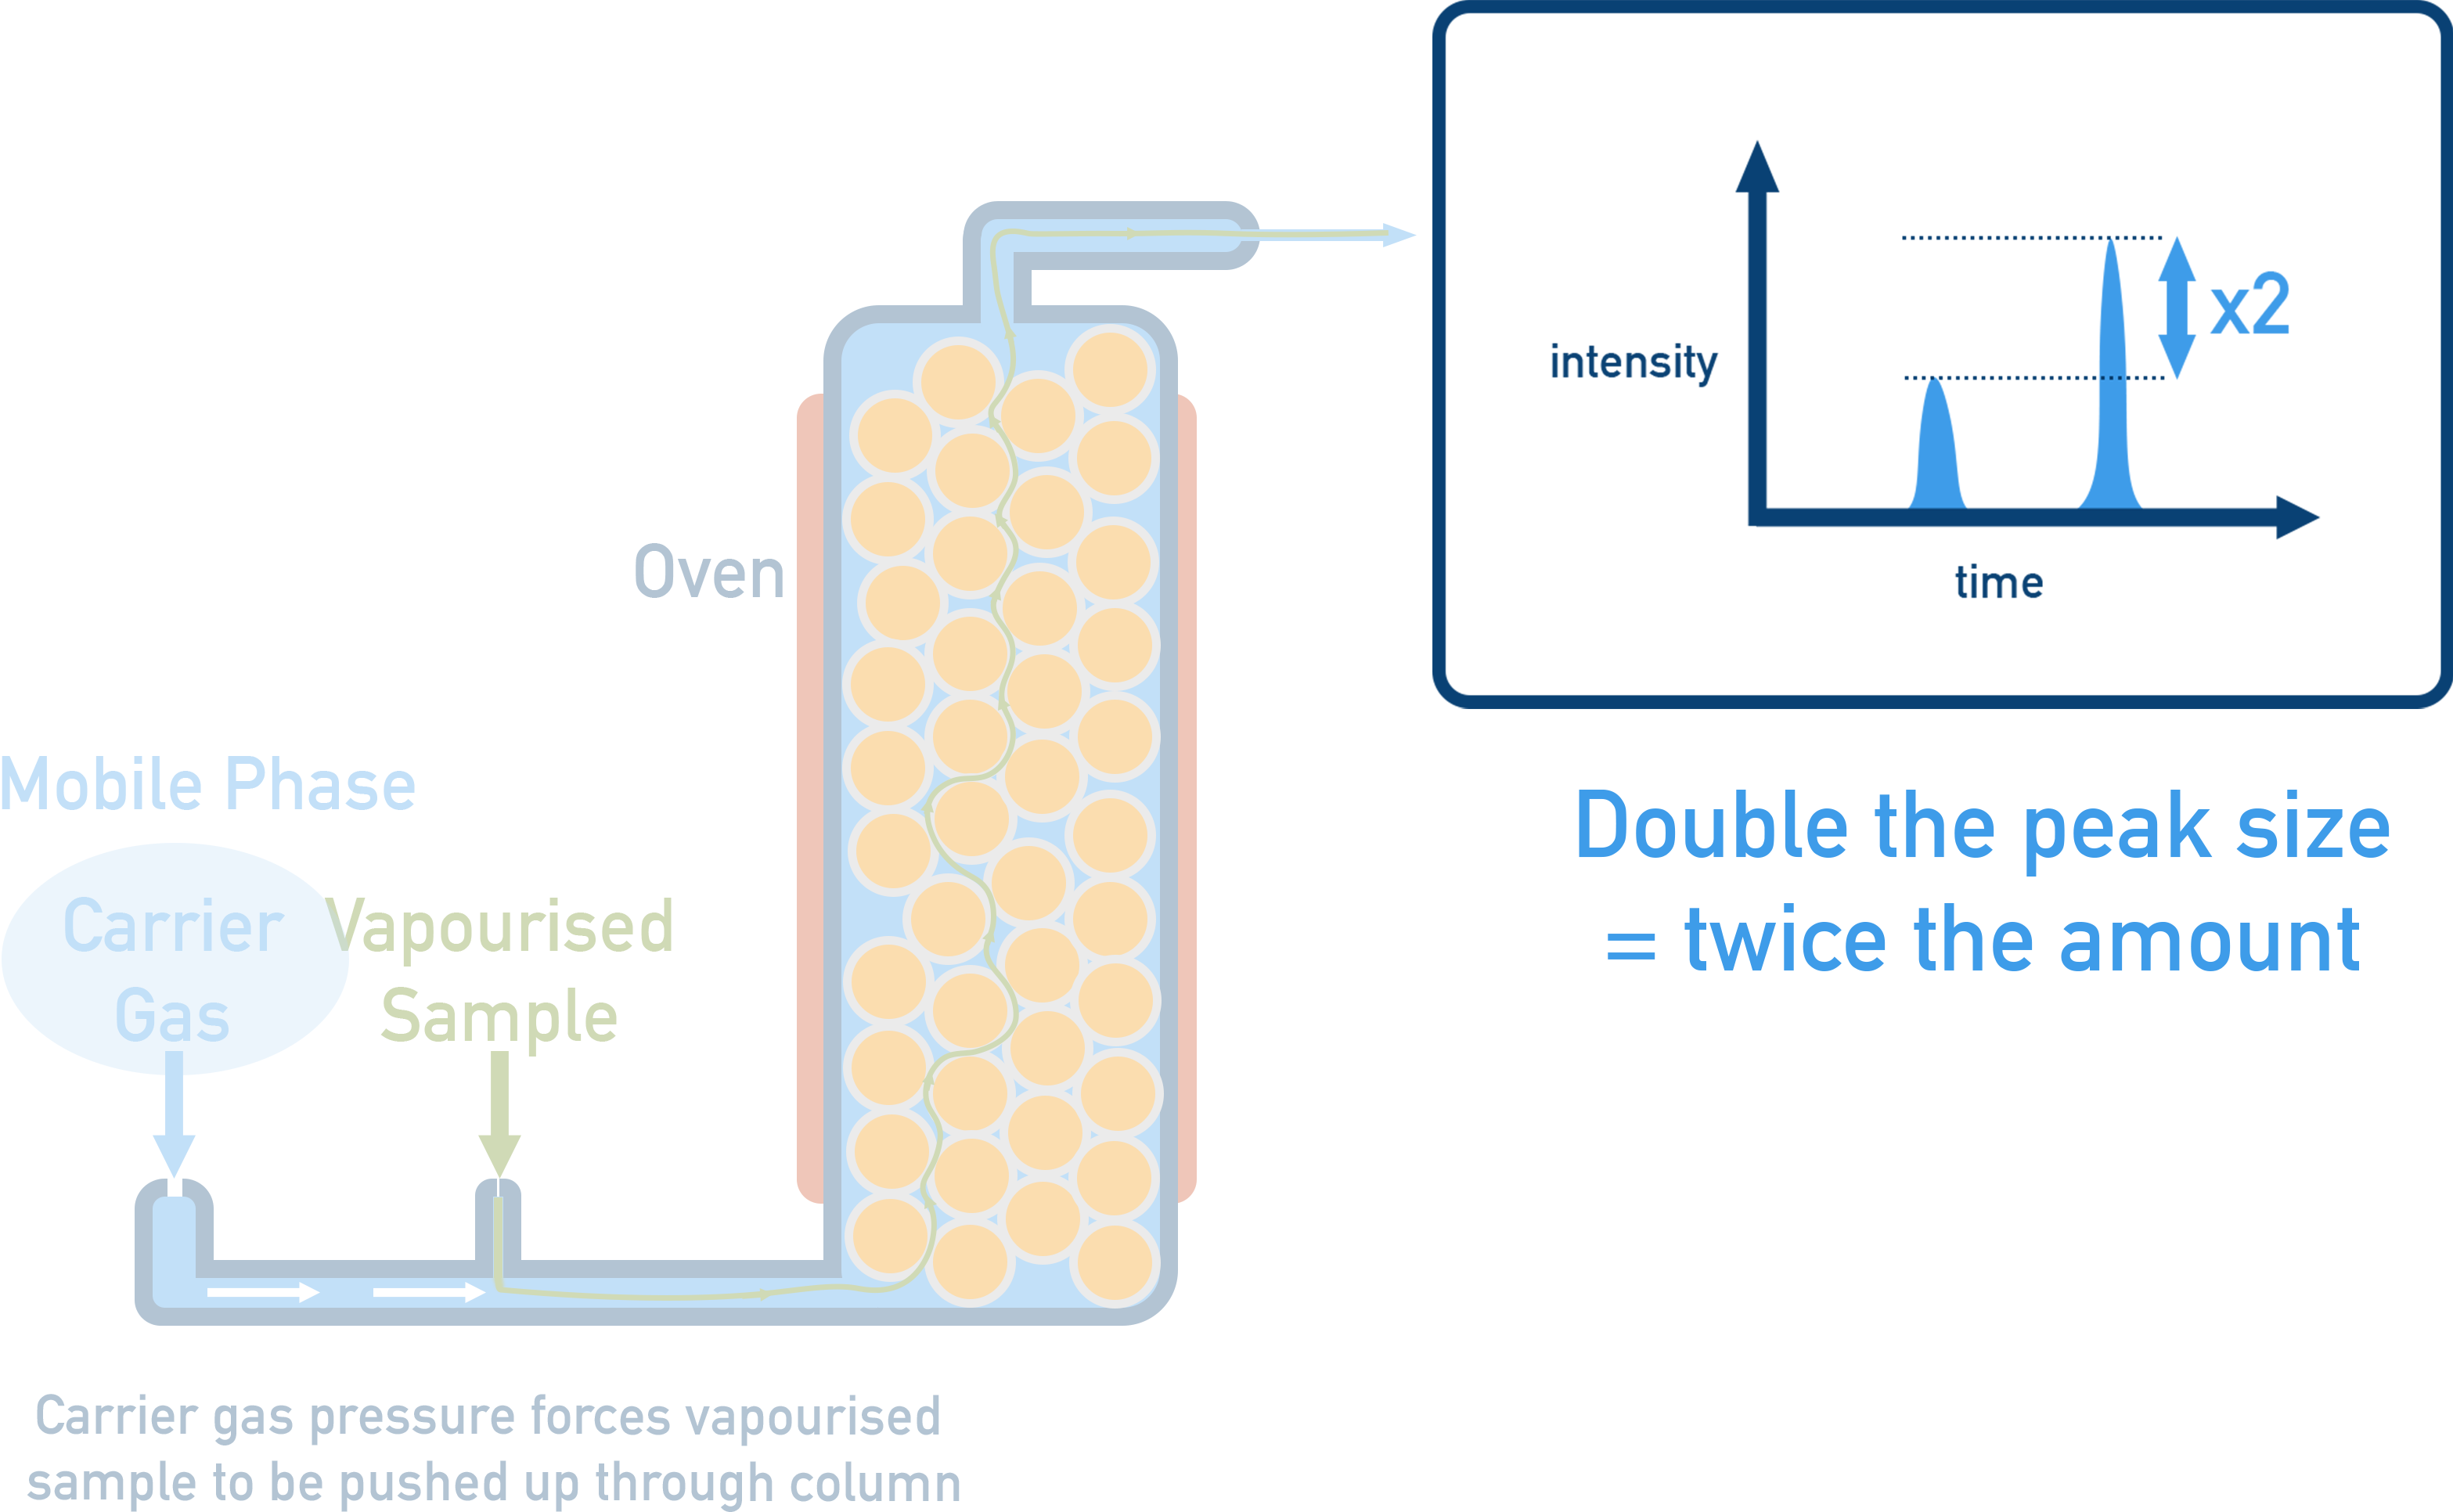
- Retention time (x-axis) identifies the compound (compared to known standards) as different compounds will have different retention times.
- Peak area (y-axis) indicates the amount of the compound present (a greater amount of a compound will give a greater peak area).
To calculate percentage composition, divide the area under each peak by the total area, then multiply by 100.
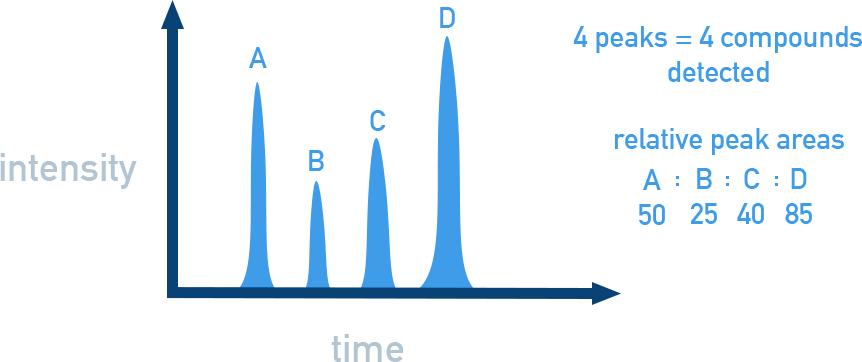
For the following chromatogram, there are four peaks, meaning four compounds were detected. The relative peak areas show that C made up 20% of the sample mixture.
- Area under peak C = 40
- Total area of all peaks = 200
- % of C = (40 ÷ 200) × 100 = 20%
Summary
- Chromatography separates mixtures using stationary and mobile phases.
- TLC uses Rf values to identify compounds based on solubility and interactions with the stationary phase.
- GC separates volatile compounds by retention times, with peak area proportional to amount present.
- Chromatograms are analysed by retention time for identification and peak areas for composition.