
Combined techniques

Focus on your working when analysing data for structure questions. Show clearly what each piece of data tells you before drawing the final structure. In a six-mark question, the structure itself may only be worth one mark – you can still earn five marks just by interpreting the data well.
Technique Summary Table
| Technique | Main Information Provided |
|---|---|
| Elemental Analysis | Gives empirical formula from % composition |
| Mass Spectrometry | Determines molecular mass and fragment ions for structural clues |
| IR Spectroscopy | Identifies functional groups from absorption frequencies |
| NMR Spectroscopy | Shows hydrogen or carbon environments and splitting patterns to map structure |
Elemental analysis
Gives empirical formula (which can be used along with Mr to determine molecular formula).
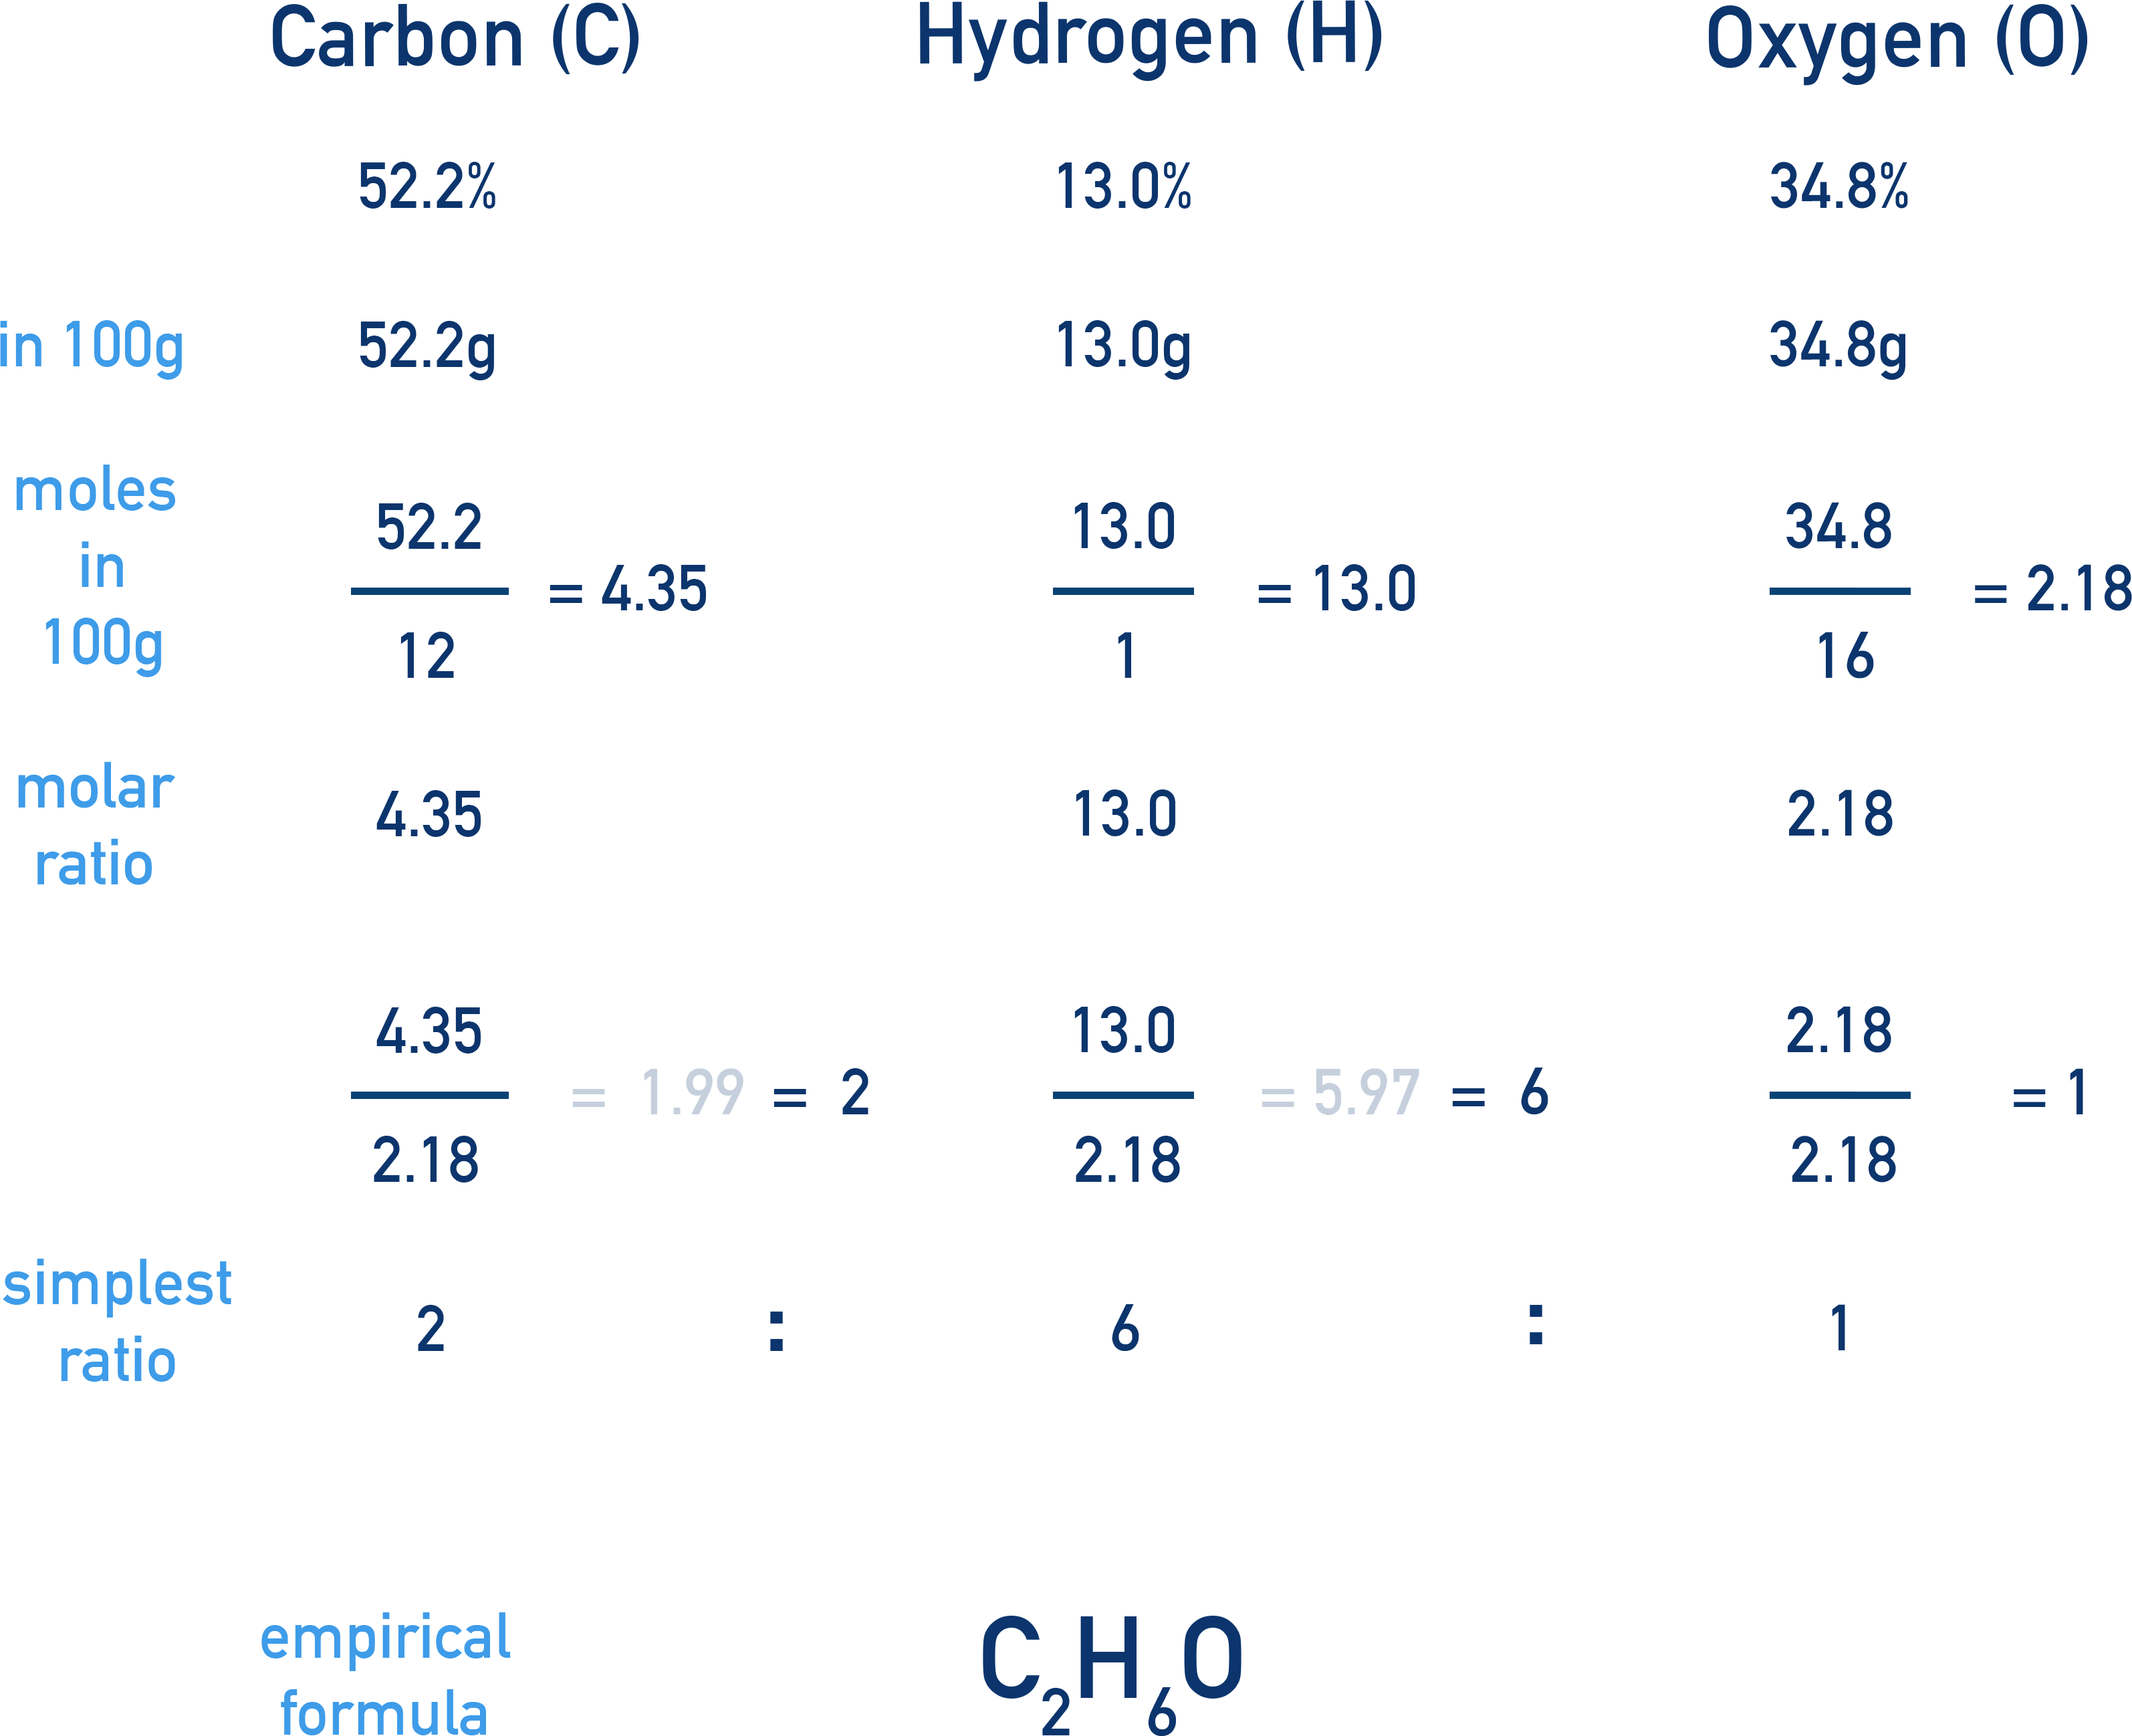
Example Find the empirical formula
For the compound with a composition by mass of C 52.2%, H 13.0% and O 34.8%.
Determine the empirical formula step by step:
- Convert % to masses (assume 100 g): C = 52.2 g, H = 13.0 g, O = 34.8 g
- Convert to moles: C = 52.2 ÷ 12.0 ≈ 4.35, H = 13.0 ÷ 1.0 ≈ 13.0, O = 34.8 ÷ 16.0 ≈ 2.18
- Divide by smallest value (2.18): C = 2, H = 6, O = 1
- Empirical formula = C2H6O
Mass spectrometry
Determines molecular mass and possible fragments.
Example Distinguishing isomers of C4H10
Hydrocarbons A and B both have molecular formula C4H10 (same molecular ion peak at 58), however they have different fragment patterns in their spectra, showing different structures.
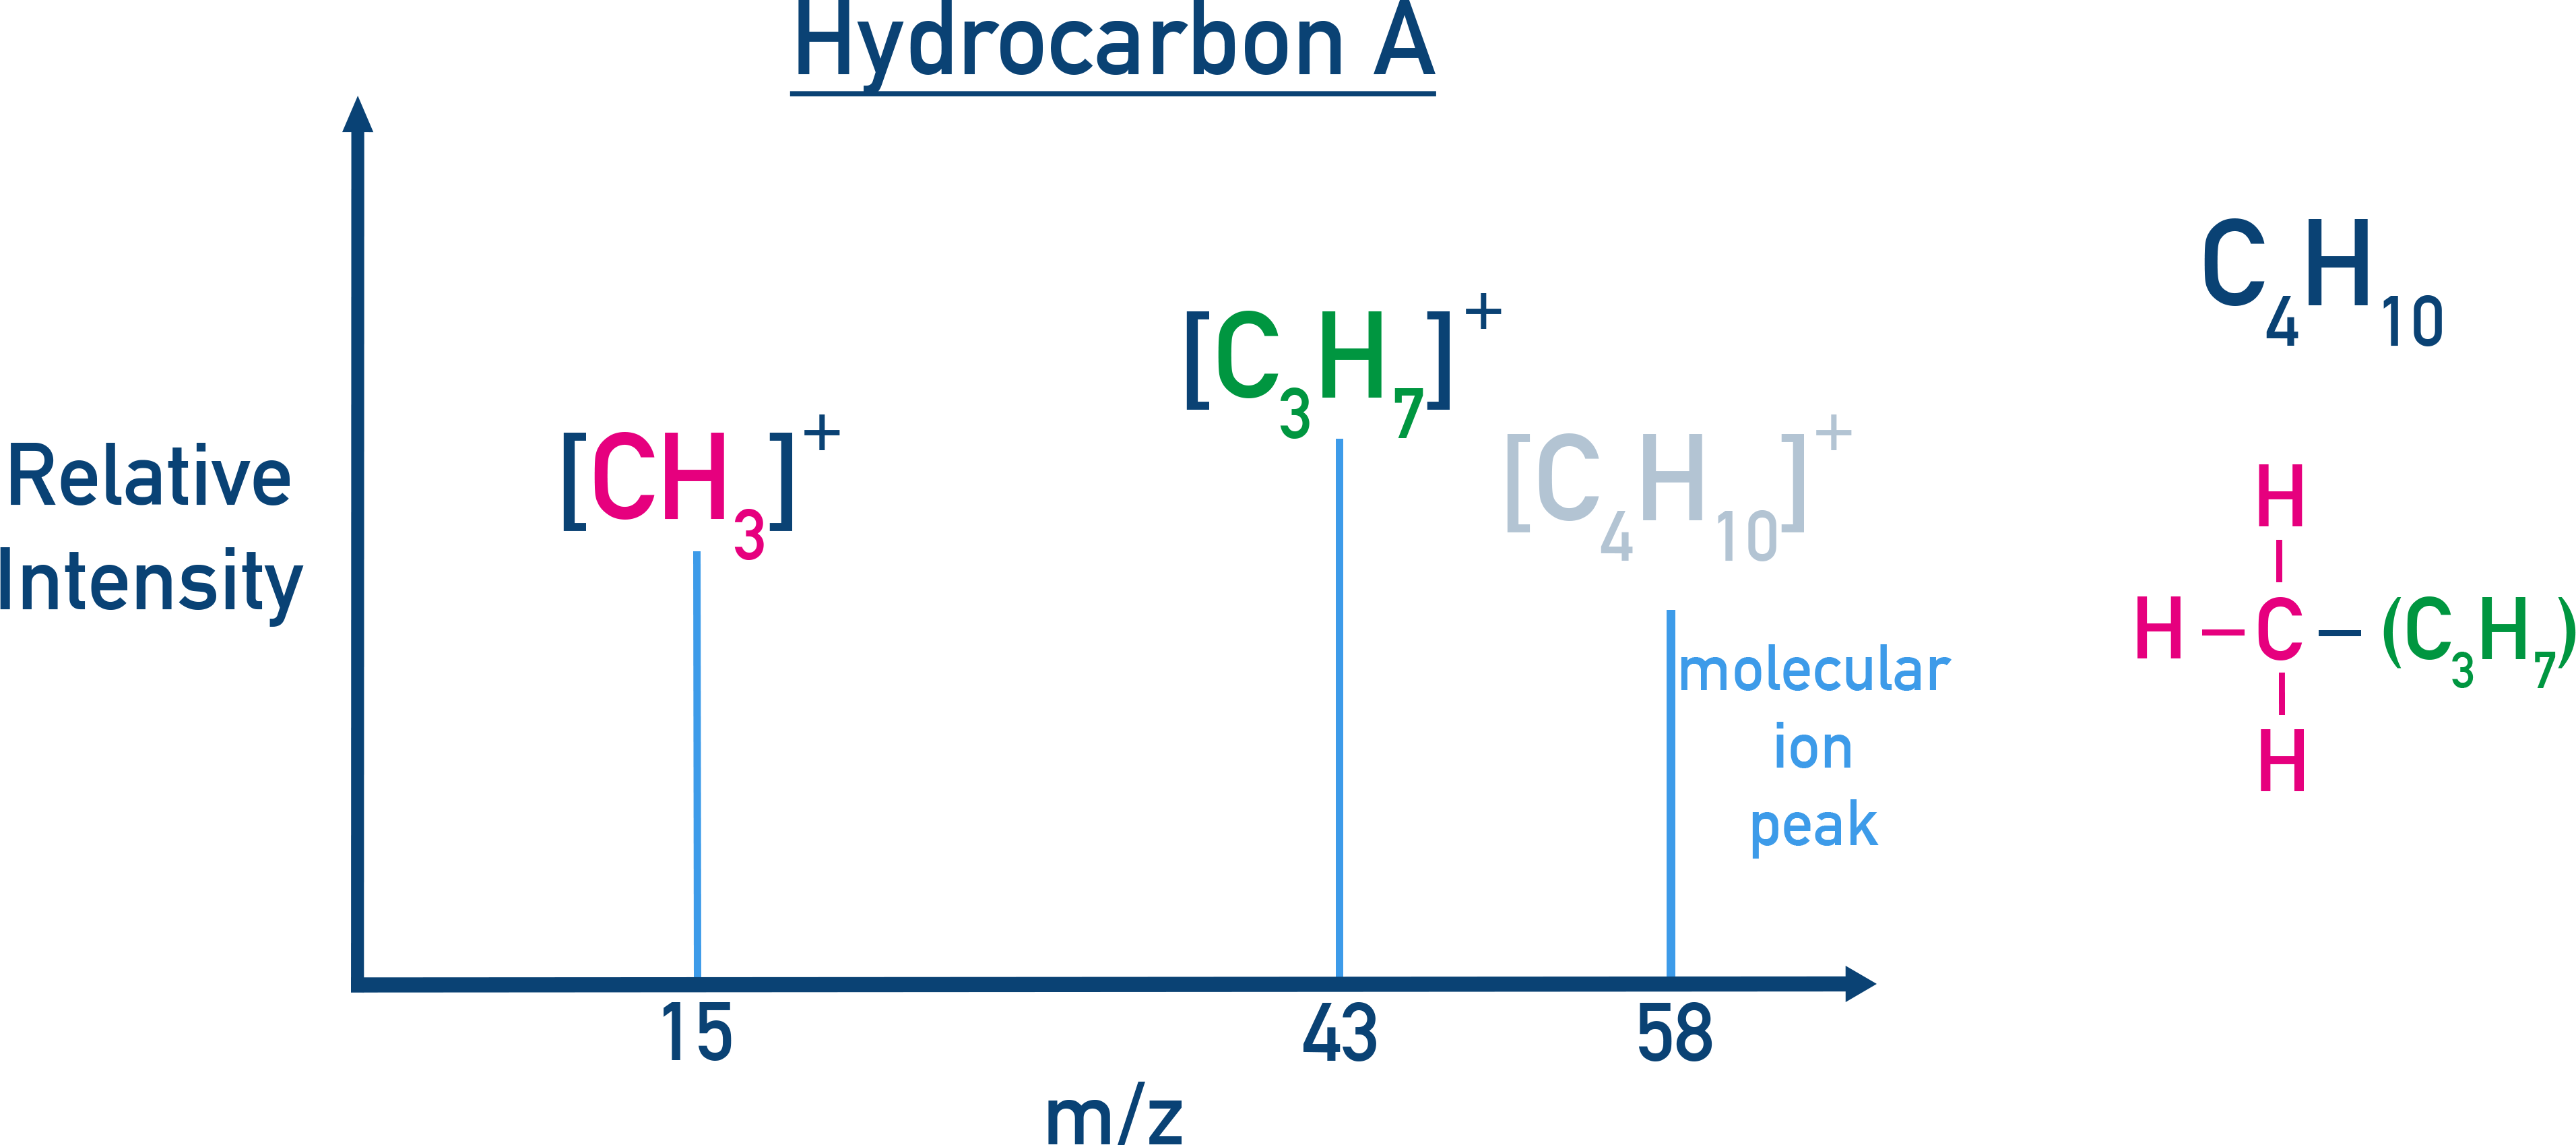
Fragment peaks at 15 and 43 show a CH3 fragment and C3H7 fragment. However, no fragment at 29 means no C2H5 group. This means the likely possible structure is CH3CH(CH3)CH3.
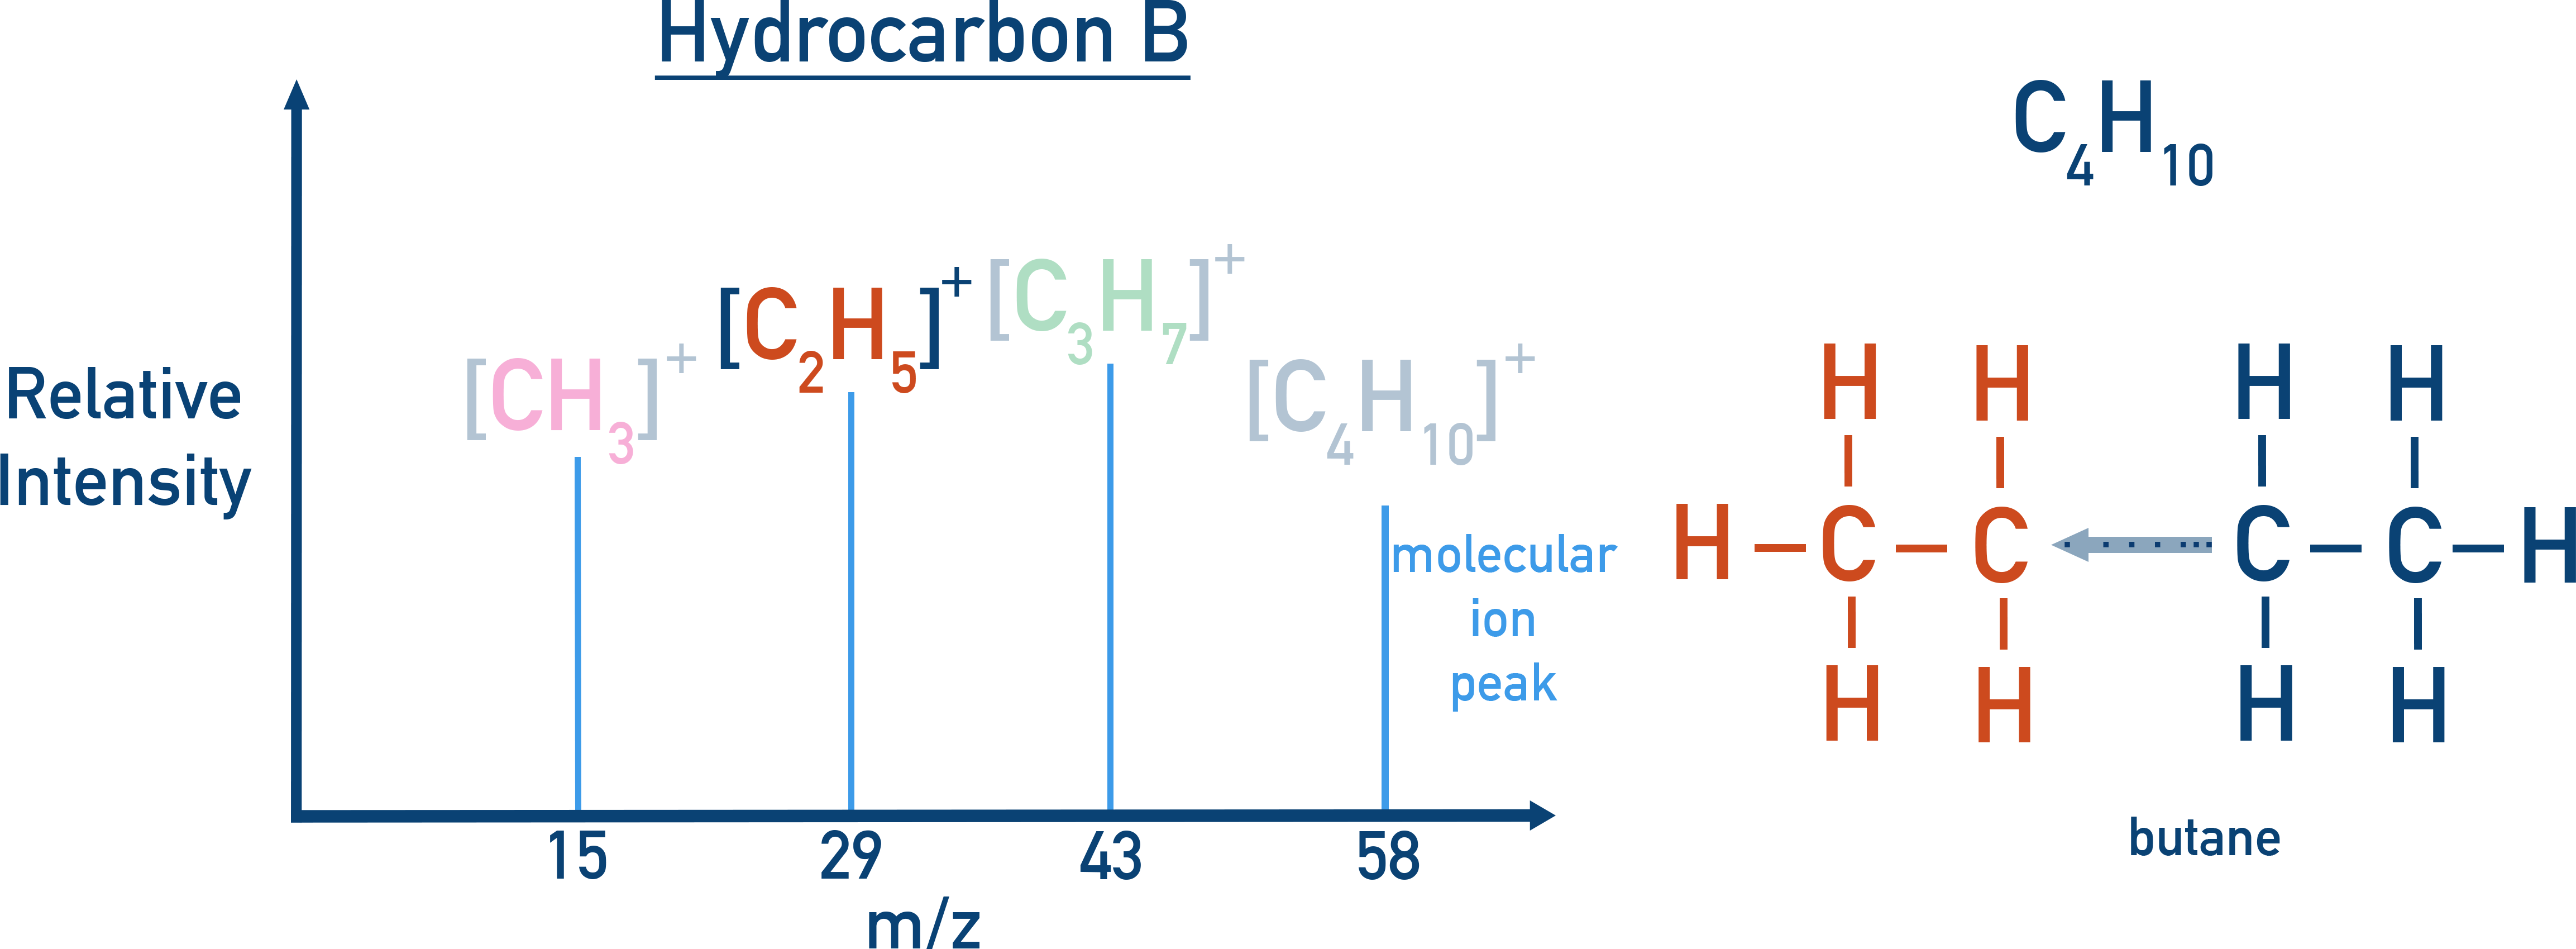
The extra peak at m/z 29 for Hydrocarbon B means it has a C2H5 group in its structure (as well as a CH3 and C3H7 group). This would indicate CH3CH2CH2CH3 as its structure.
IR spectroscopy
Shows presence of functional groups.
Key absorbances you should instantly be able to recognise!
- C=O: ~1700 cm−1
- O–H (broad): ~3200–3600 cm−1
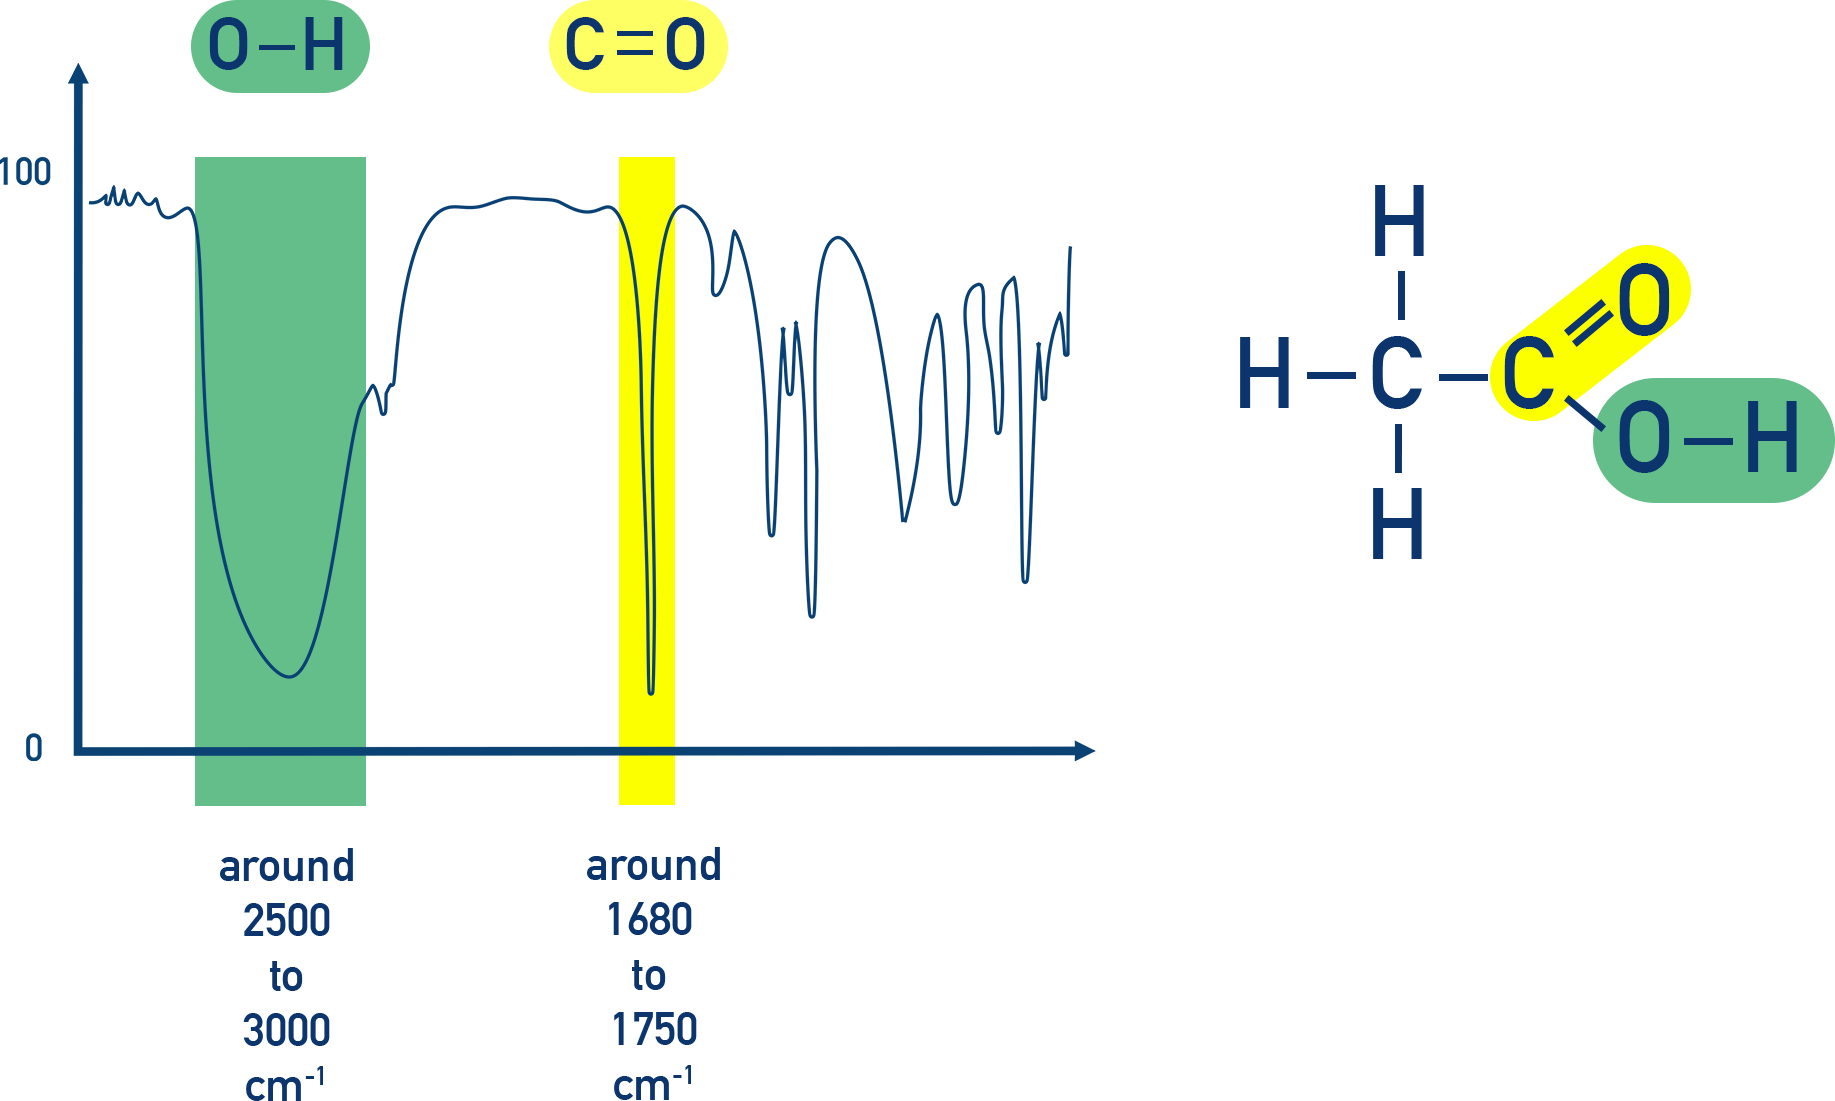
Example Ethanoic acid IR spectrum
Ethanoic acid (CH3COOH) has two absorbances in its IR spectra that help identify it. One for the O–H bond (2500 to 3000) and one for the C=O bond (1680 to 1750).
NMR spectroscopy
Provides detailed information about C or H environments in a molecule.
Example Ethanol ¹H NMR
Ethanol (CH3CH2OH) in ¹H NMR:
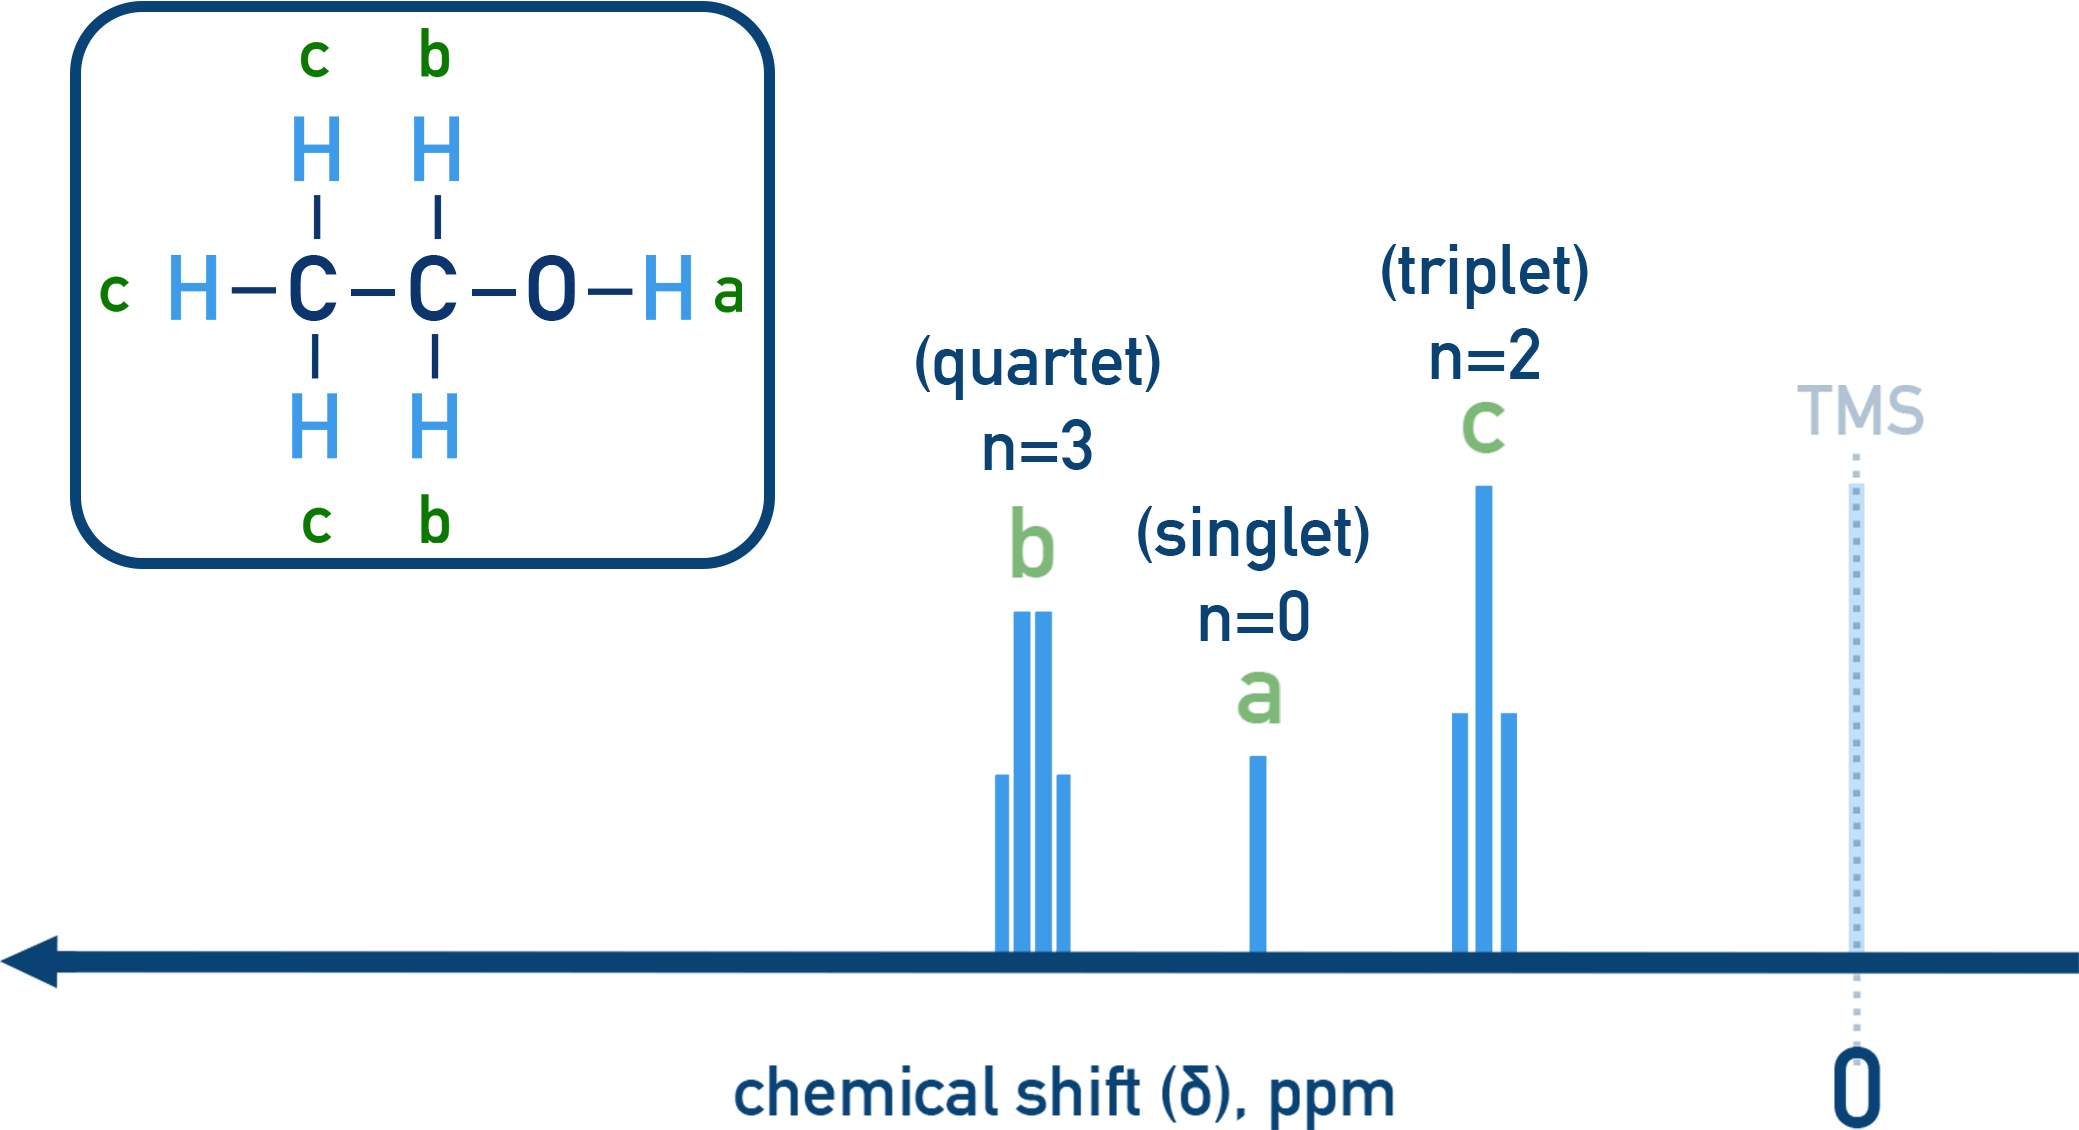
- 3 peaks in the H NMR shows 3 unique H environments.
- CH3 group shows a triplet (next to CH2).
- CH2 group shows a quartet (next to CH3).
- OH appears as a singlet (no splitting).
Summary
- Elemental analysis determines empirical formula.
- Mass spectrometry gives molecular mass and fragments for structural clues.
- IR identifies key functional groups from absorption frequencies.
- NMR provides detailed hydrogen or carbon environments for structure determination.
- Combining all methods allows accurate deduction of molecular structure.