
pH Curves, Titrations, and Indicators
Quick Notes
- Titrations can be used to determine the concentration of an acid or base.
- pH curves show how pH changes during a titration.
- Key regions of a pH curve:
- Initial pH (before titration starts).
- Gradual pH change (as titrant is added).
- Vertical equivalence point region (rapid pH change).
- Final pH (excess titrant added).
- pH curves have slightly different shapes depending on if strong or weak acids and bases are used.
- Equivalence point is where acid and base are in exact stoichiometric proportions – have reacted together perfectly
- Choice of indicator depends on the titration curve – the indicator needs to change colour at a pH that occurs in the vertical part of a pH curve:
- Strong acid vs. strong base – Phenolphthalein or Methyl Orange.
- Strong acid vs. weak base – Methyl Orange.
- Weak acid vs. strong base – Phenolphthalein.
- Weak acid vs. weak base – No suitable indicator, use pH meter.
- Indicator Colour Changes:
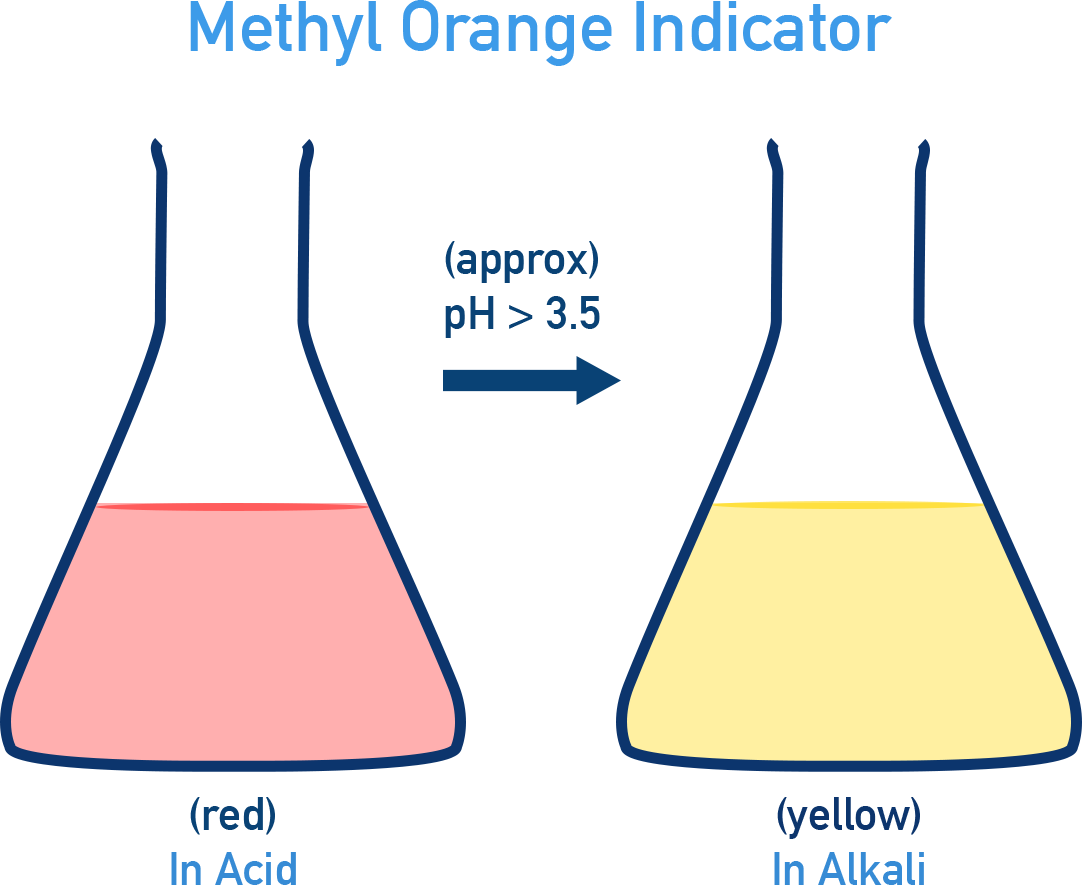
- Methyl Orange: Red (acid) → Yellow (base) (pH ~3.5 – 4.5).
- Phenolphthalein: Colourless (acid) → Pink (base) (pH ~8.3 – 10).
Full Notes
pH Curves and Titration Process
Acid-base titrations determine the exact concentration of an acid or base.
A pH curve is a graph of pH vs. volume of titrant added.
The equivalence point is where the amount of acid exactly reacts with the base - no acid or base remain, only a salt and water.
Practical Titration Example: NaHCO3 with HCl
Reaction: NaHCO3(aq) + HCl(aq) → NaCl(aq) + CO2(g) + H2O(l)
Procedure Summary:
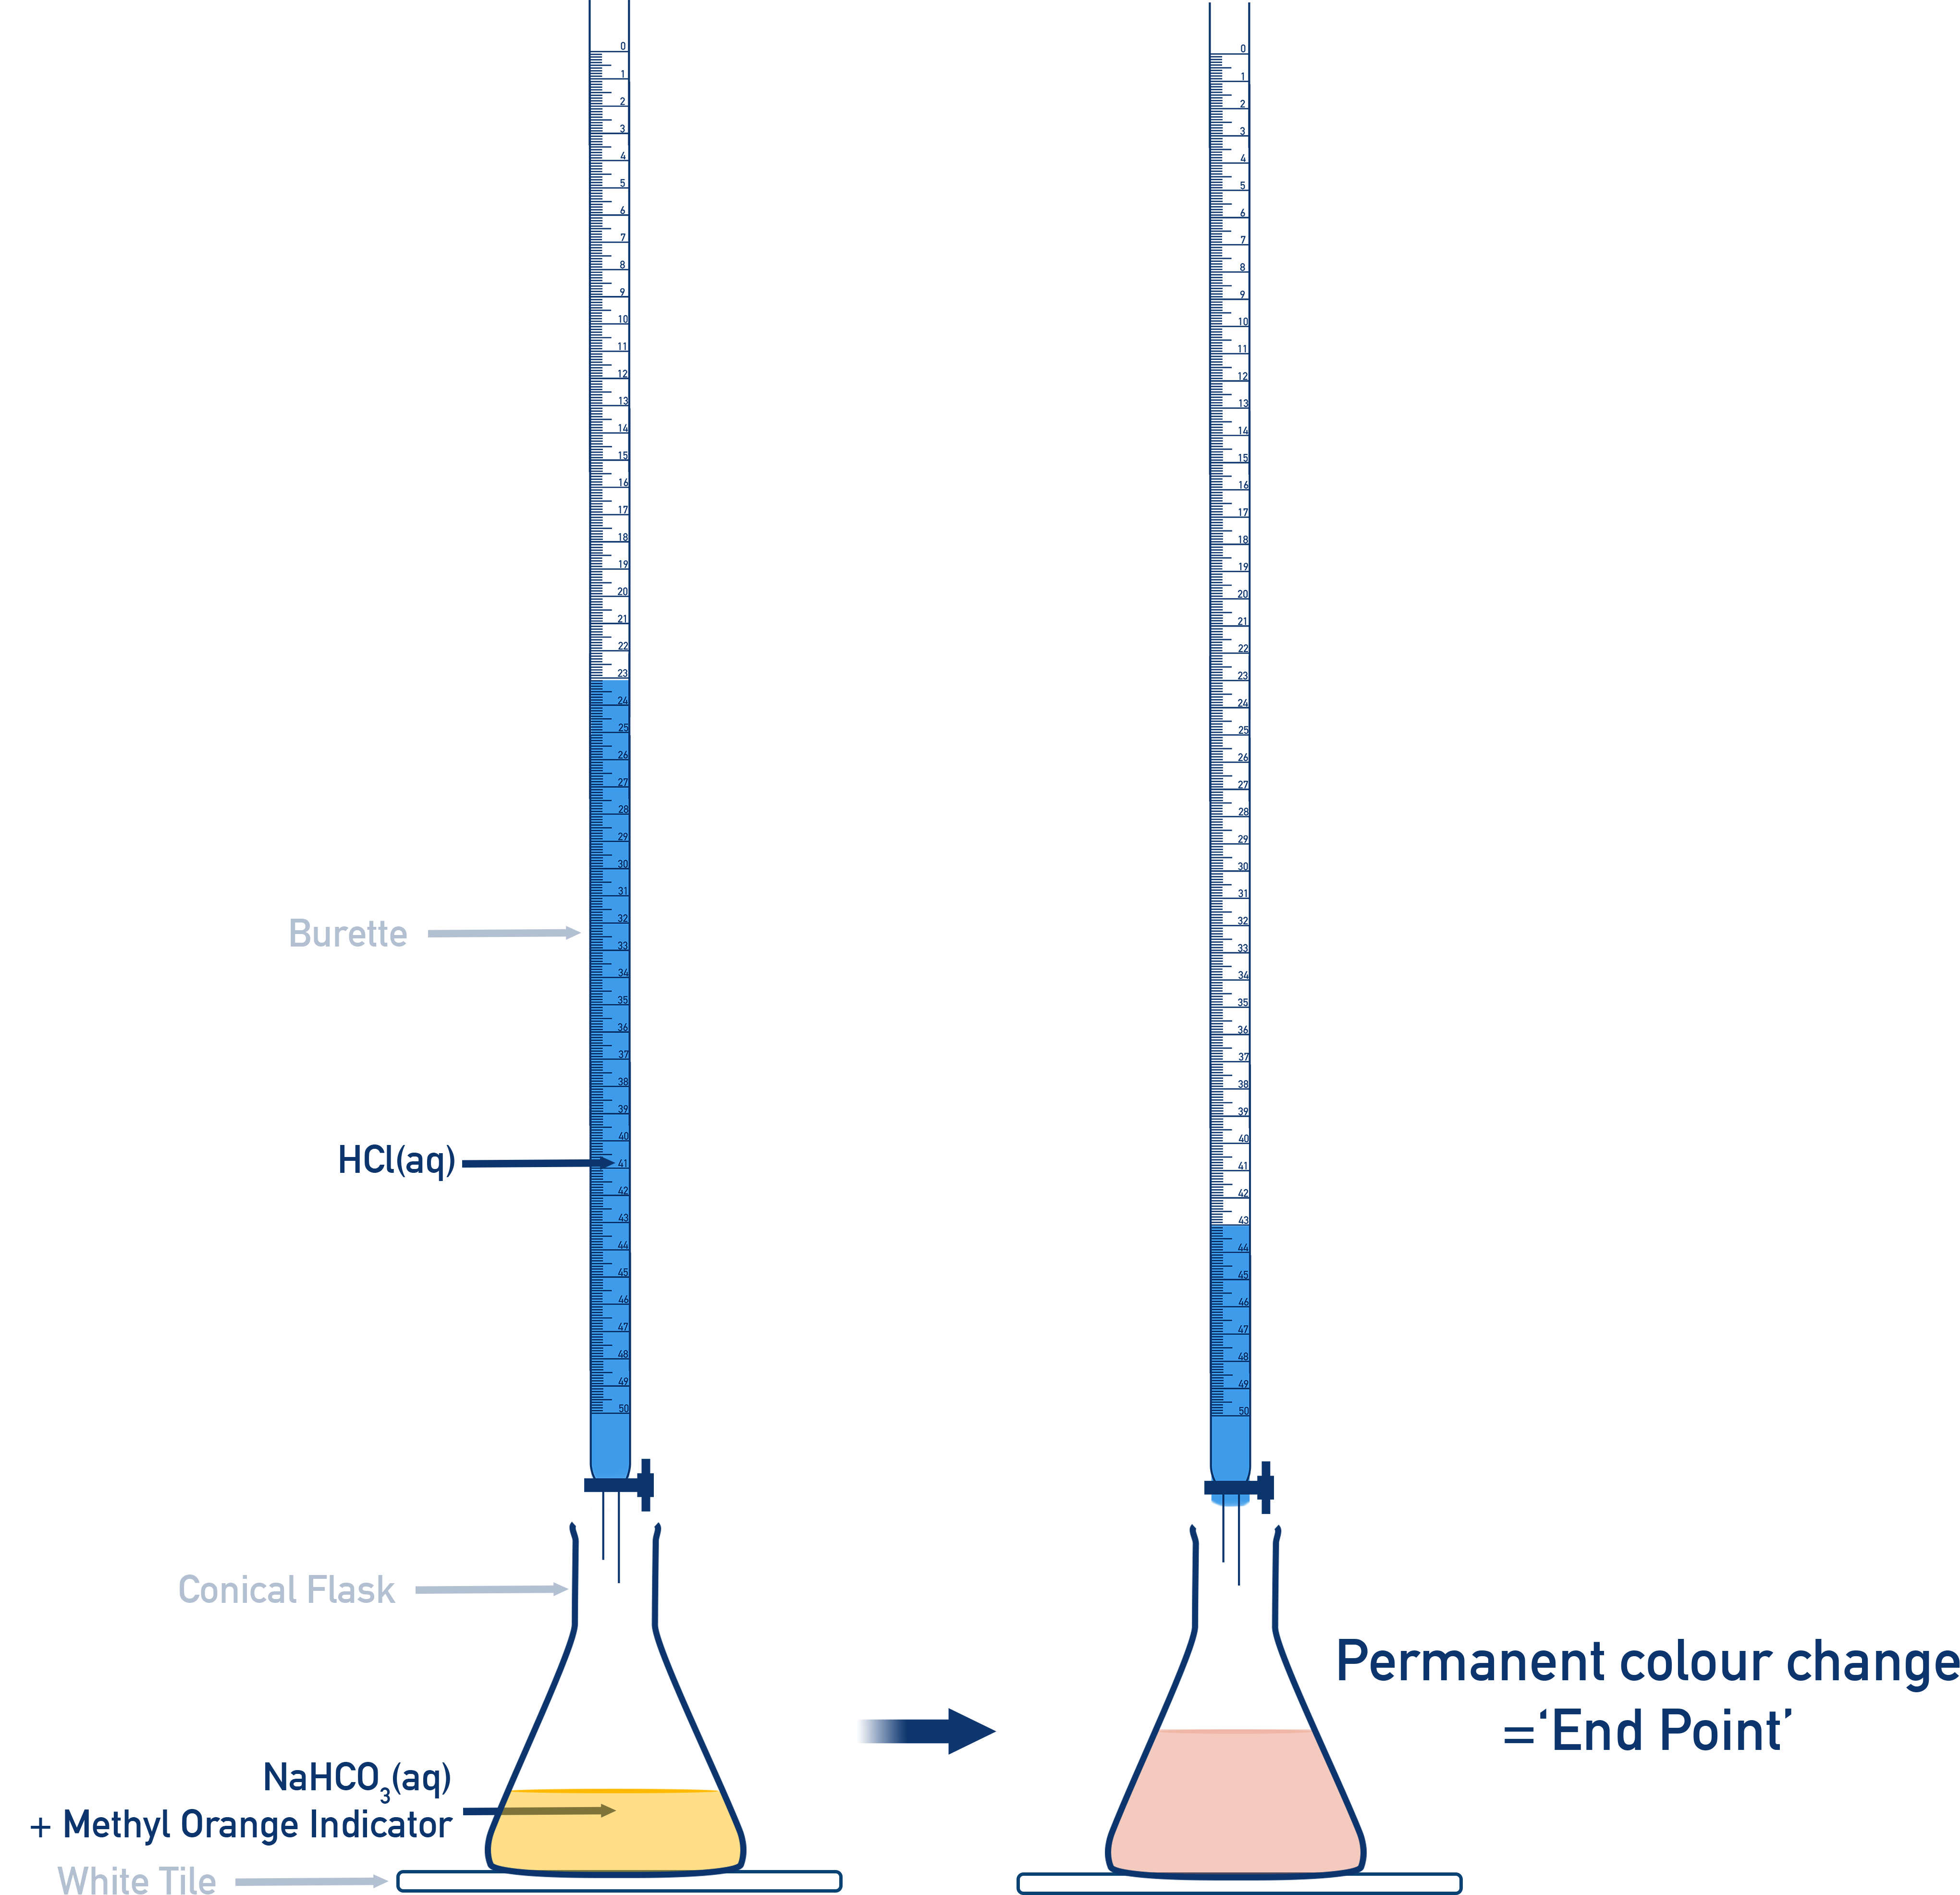
- Place conical flask containing known volume of NaHCO3(aq) solution and methyl orange indicator on a white tile.
- Rough titration first — titrate by adding HCl from the burette while swirling. Add until colour changes from yellow to red.
- Now repeat, however adding HCl dropwise when near rough titration end point, until permanent colour change from yellow to red.
- Record final burette reading and calculate titre.
- Repeat until you have two concordant results within 0.1 cm3.
pH Curves for Different Titrations
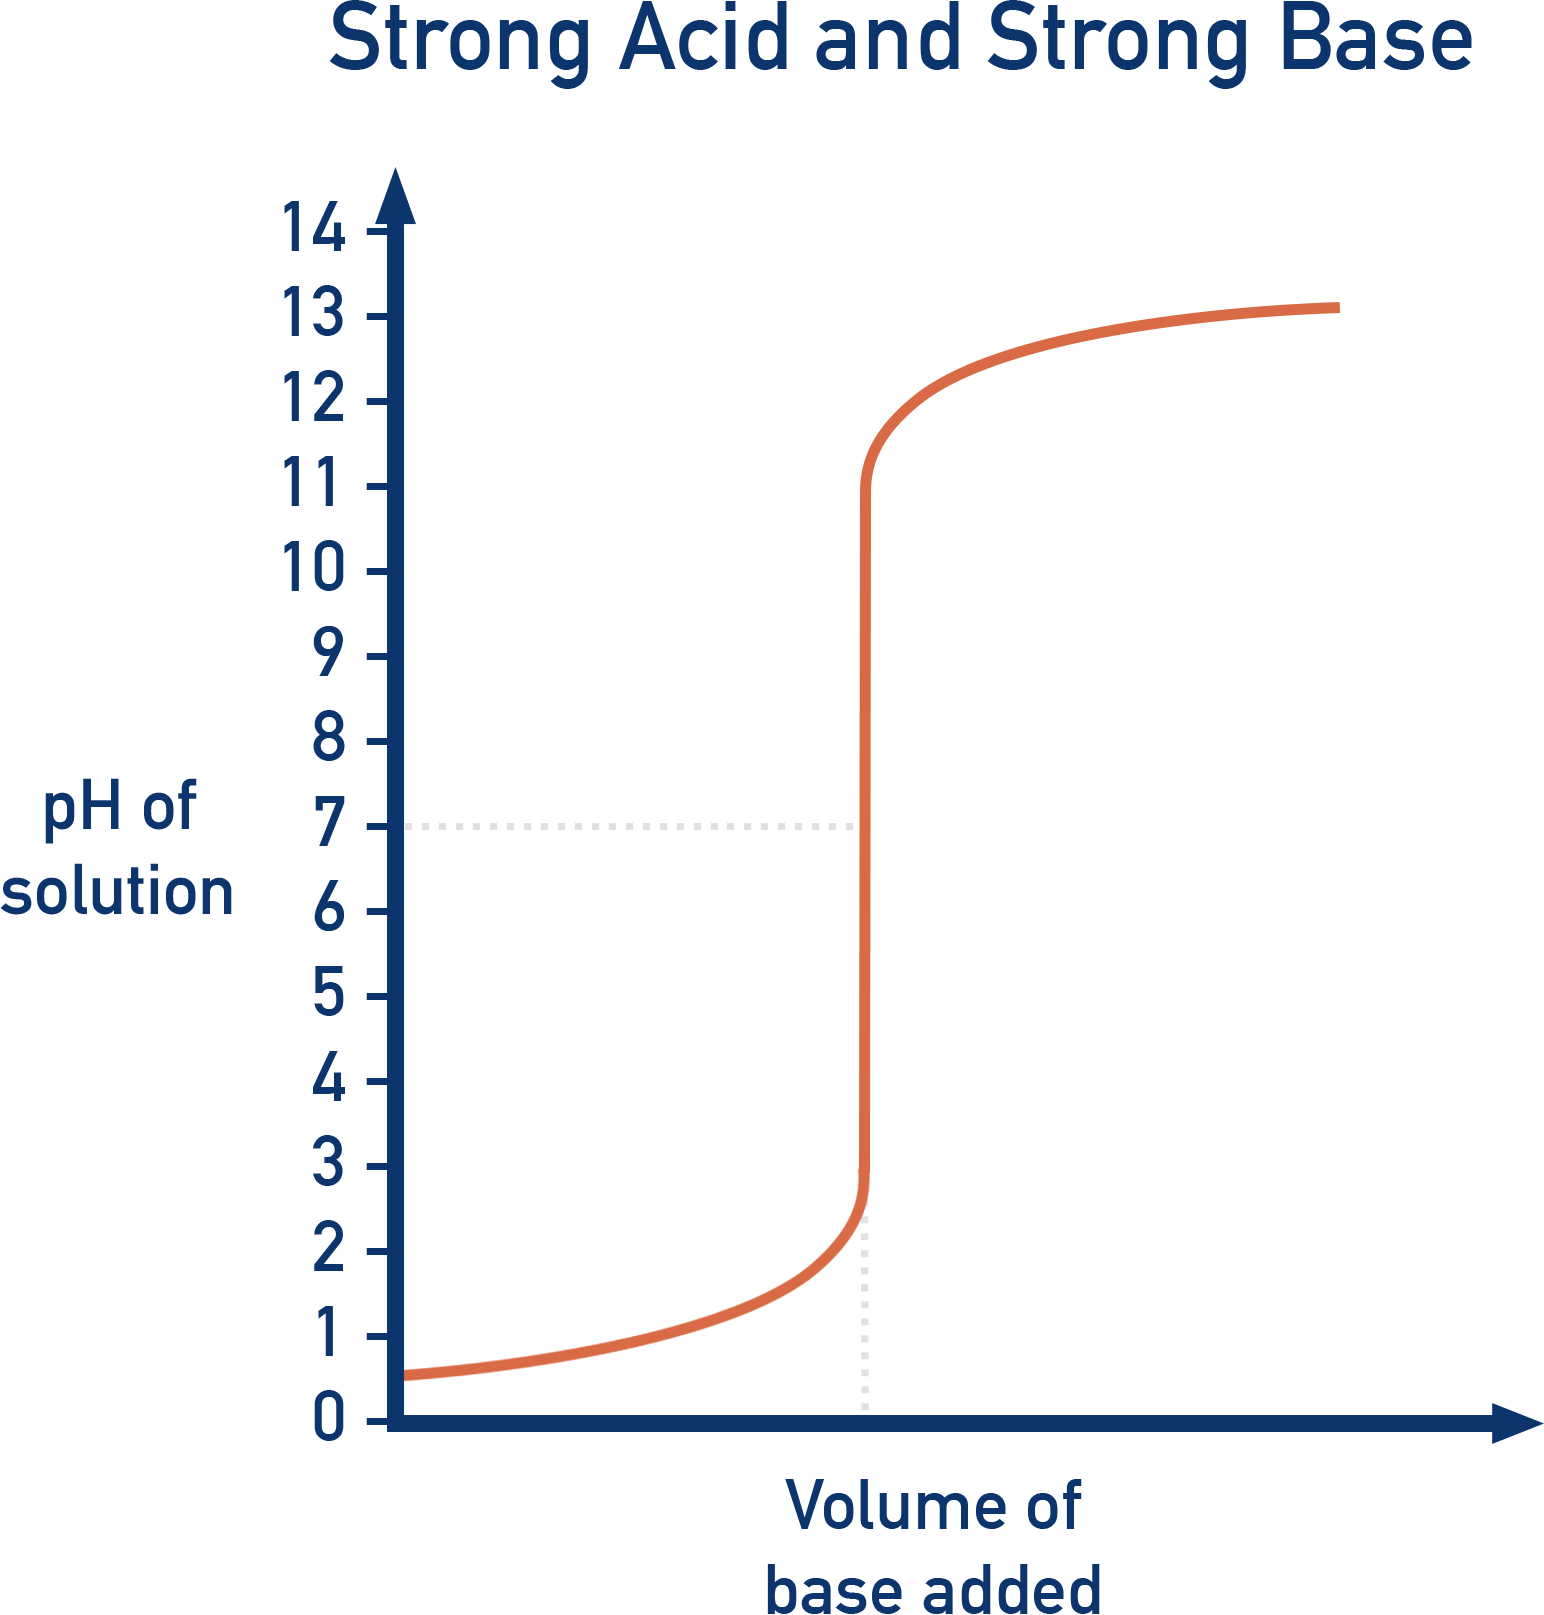
Strong Acid vs. Strong Base (e.g. HCl + NaOH)
- Initial pH: Very low (~1, strong acid).
- Rapid rise around pH 7 (equivalence point).
- Final pH: Very high (~13, strong base).
- Suitable indicators: Phenolphthalein or Methyl Orange.
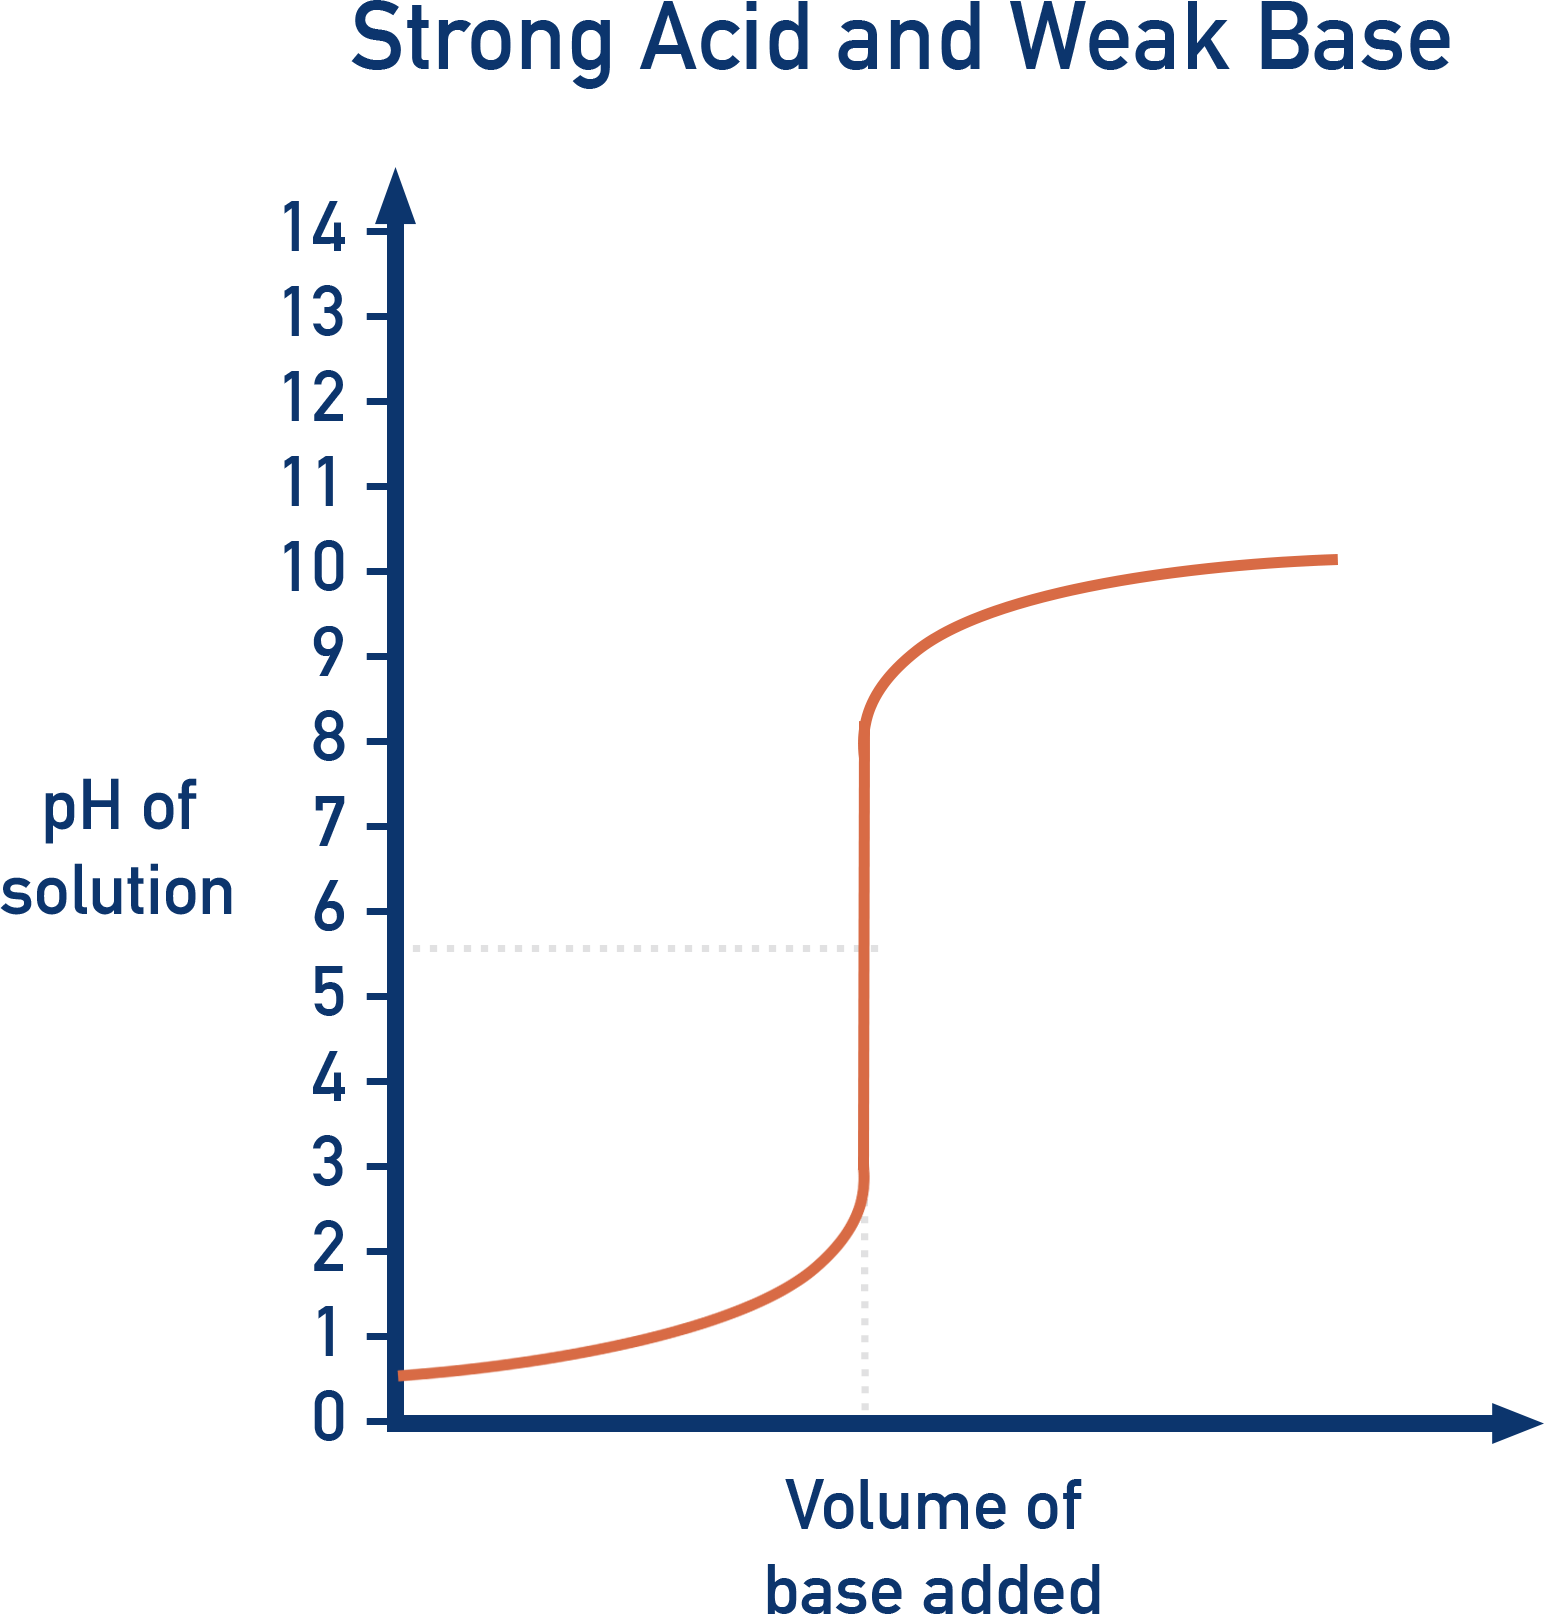
Strong Acid vs. Weak Base (e.g. HCl + NH3)
- Initial pH: Very low (~1, strong acid).
- Equivalence point: Below pH 7 (~5).
- Final pH: Moderate (~9 to 10, weak base).
- Suitable indicator: Methyl Orange.
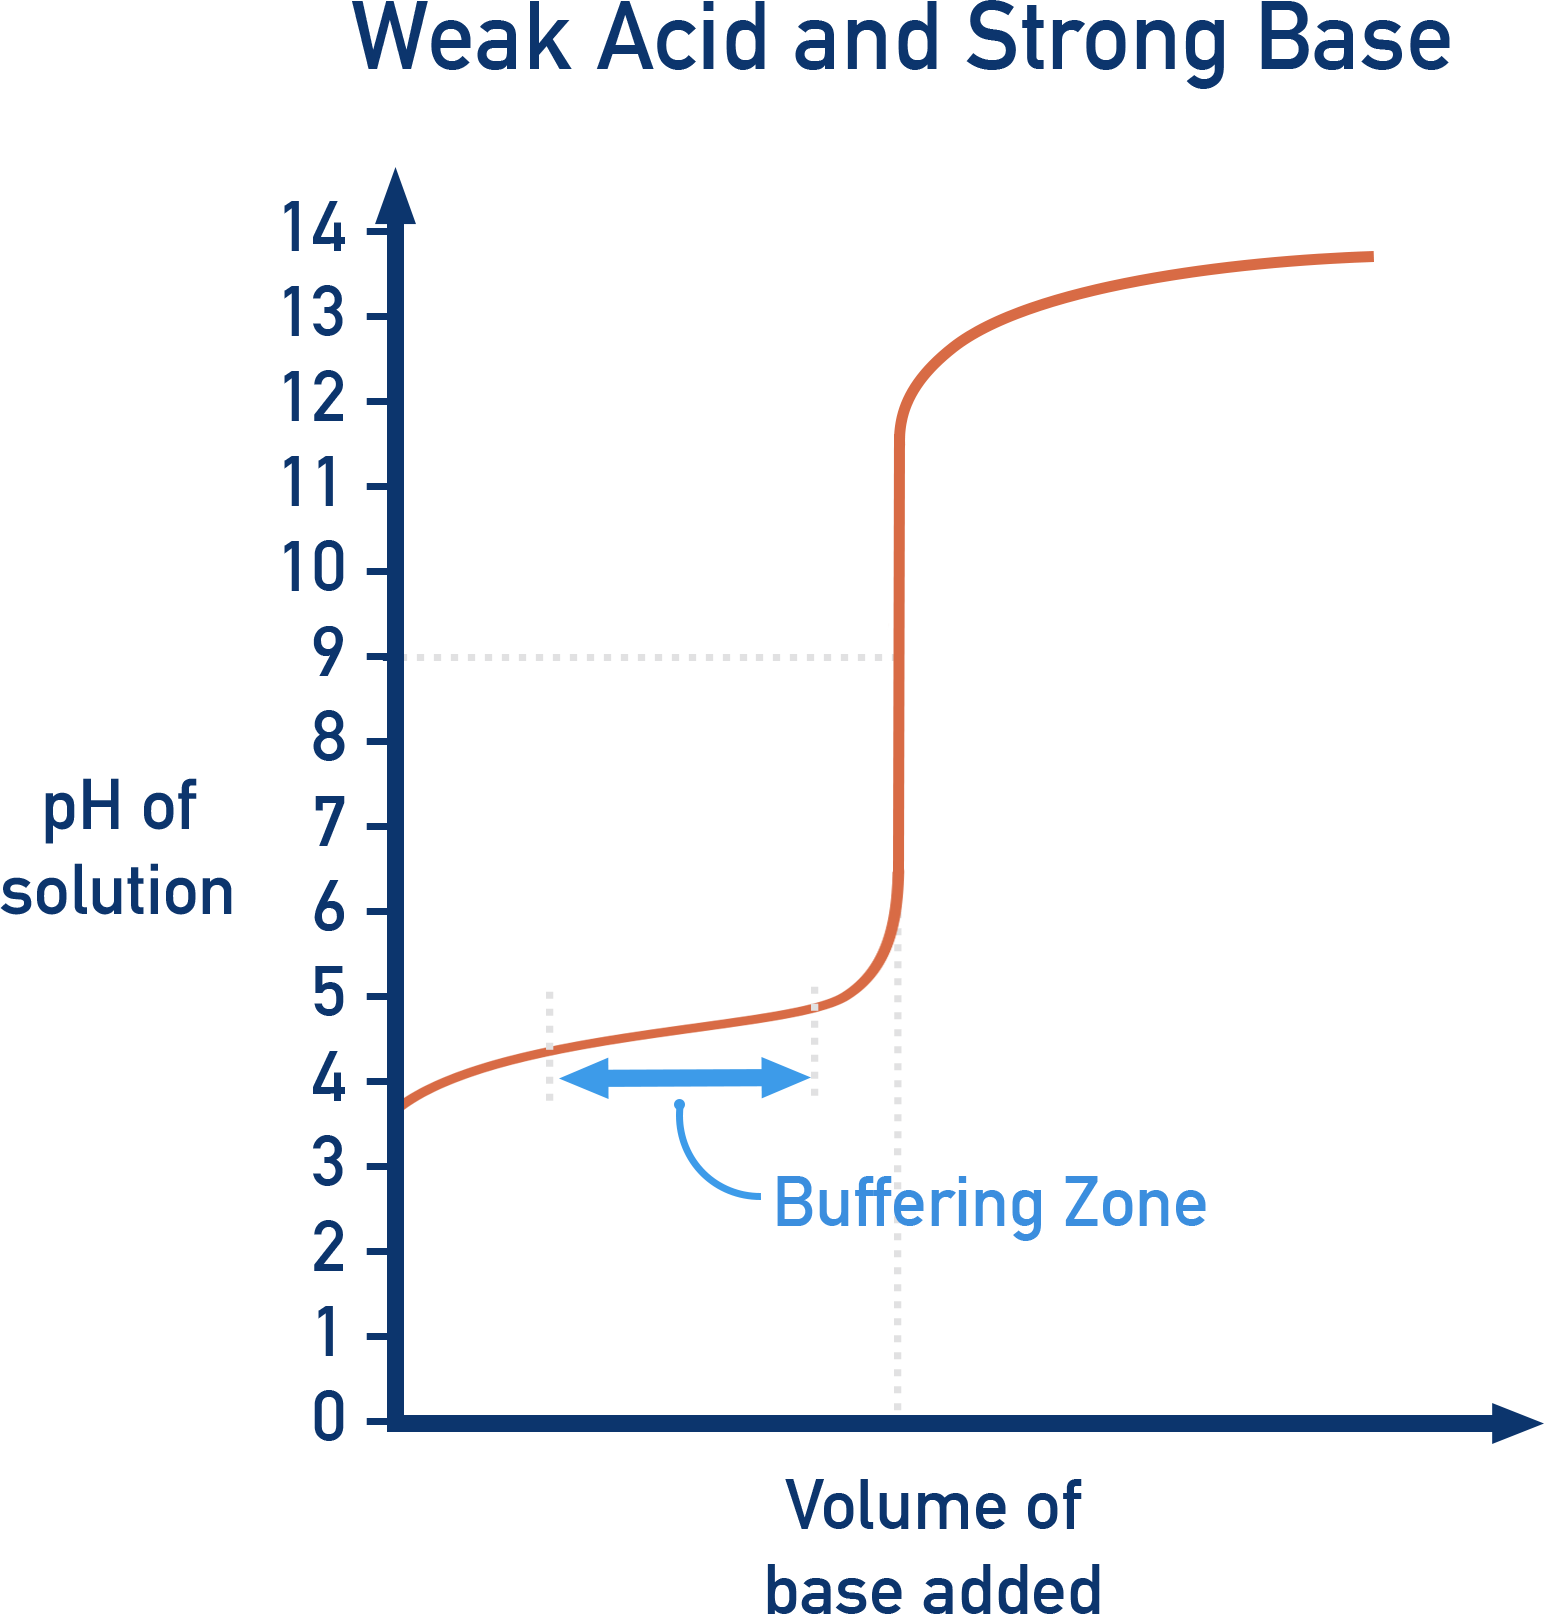
Weak Acid vs. Strong Base (e.g CH3COOH + NaOH)
- Initial pH: Moderate (~4, weak acid).
- Buffer zone - after a small quantity of base is added, a buffer system is formed meaning the pH change is minimised after this point when more base is added (until the system is overwhelmed and the pH changes rapidly).
- Equivalence point: Above pH 7 (~9).
- Final pH: Very high (~13, strong base).
- Suitable indicator: Phenolphthalein.
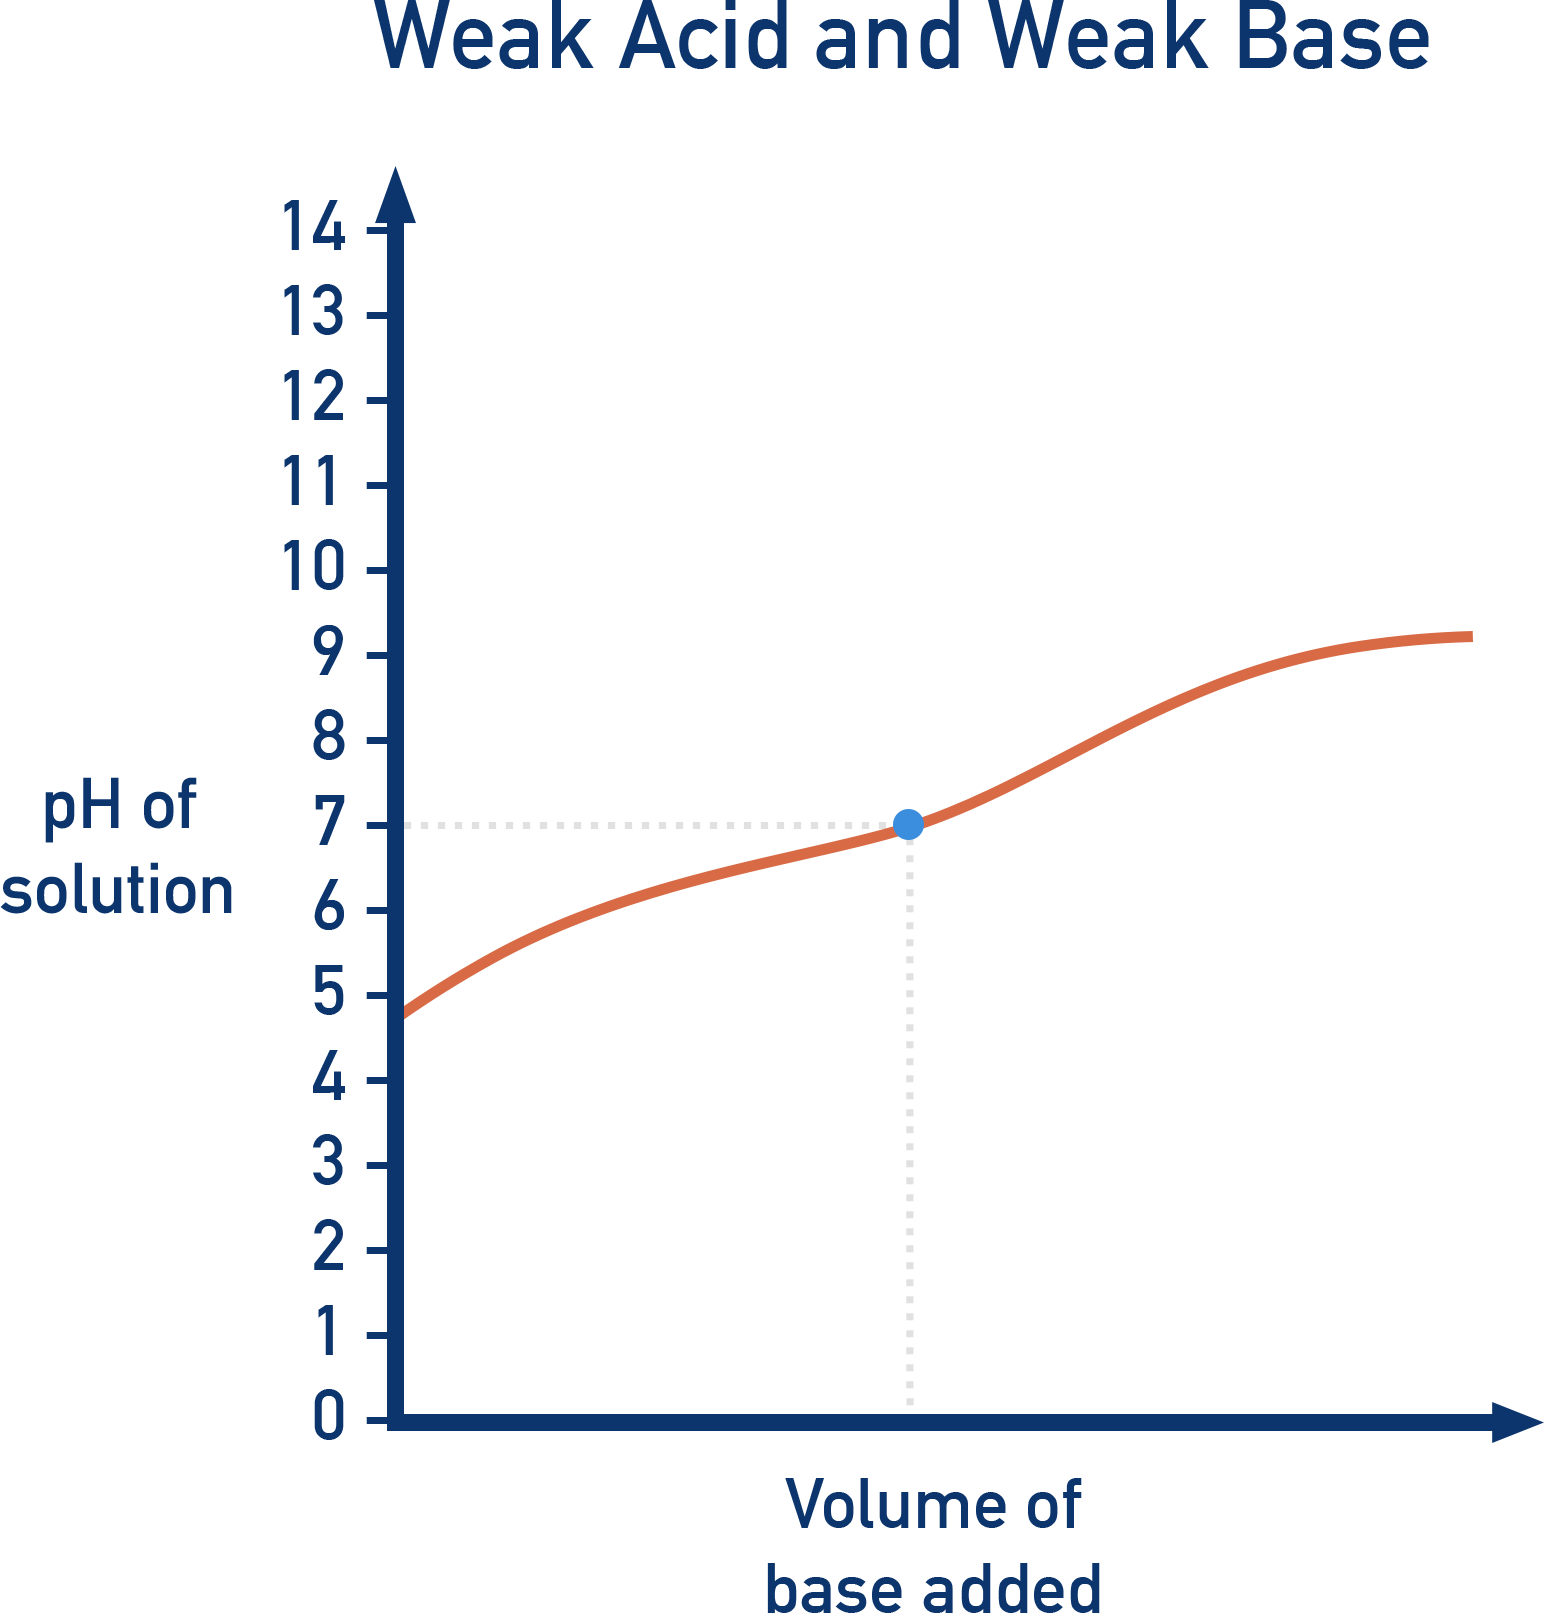
Weak Acid vs. Weak Base (CH3COOH + NH3)
- Initial pH: Moderate (~4, weak acid).
- No sharp pH change → No clear equivalence point.
- pH meter required (no suitable indicator).
Role and Choice of Indicators
During a titration, an indicator is used that changes colour at a certain pH. When the solution reaches this pH, the indicator changes colour – this is how the person carrying out the titration knows it is ‘complete’. The end point of a titration is when enough ‘titrant’ has been added to make the indicator change colour.
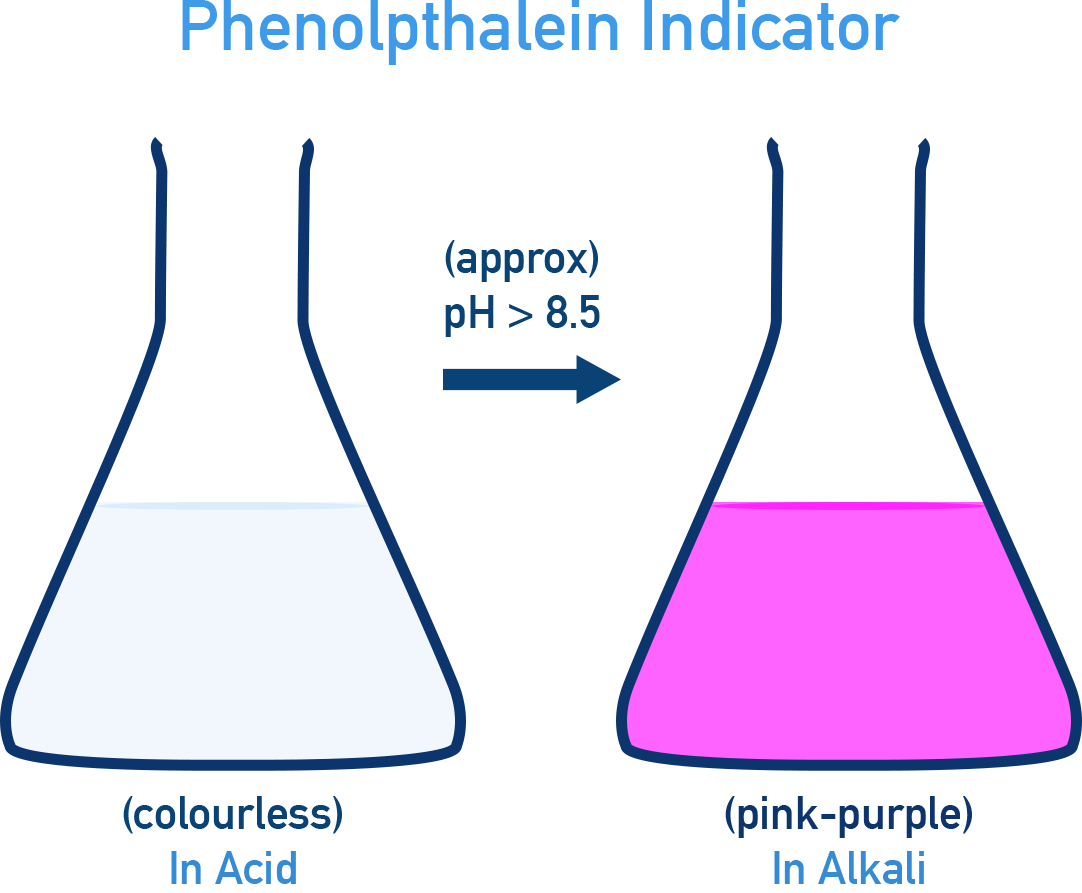
- Phenolphthalein: Colourless (acid) → Pink (base) (pH ~8.3 - 10).
- Methyl Orange: Red (acid) → Yellow (base) (pH ~3.5 - 4.5).
Different indicators can change colour at different pH values, this is why the same indicators aren’t always used for different titrations.
Indicators should be chosen that change colour at a pH that falls within the sharp peak area of a titration curve.
| Titration Type | pH at Equivalence | Suitable Indicator |
|---|---|---|
| Strong Acid vs. Strong Base | 7 | Phenolphthalein, Methyl Orange |
| Strong Acid vs. Weak Base | < 7 | Methyl Orange |
| Weak Acid vs. Strong Base | > 7 | Phenolphthalein |
| Weak Acid vs. Weak Base | No sharp change | No suitable indicator (use pH meter) |

What is the difference between the end point and the equivalence point?
The end point is simply when a colour change occurs as the solution in a titration gets to a particular pH.
The equivalence point refers to the point at which chemically equivalent amounts of acid and base have been mixed in the solution, not the pH of the solution.
Summary Table: Key Concepts in pH Curves and Indicators
| Idea or Concept | Explanation |
|---|---|
| Titration Curve | Graph of pH vs. volume of titrant added |
| Equivalence Point | Acid and base in exact stoichiometric ratio |
| Strong Acid vs. Strong Base | Equivalence point at pH 7 |
| Strong Acid vs. Weak Base | Equivalence point below pH 7 |
| Weak Acid vs. Strong Base | Equivalence point above pH 7 |
| Weak Acid vs. Weak Base | No sharp change, use pH meter |
| Methyl Orange Indicator | Red in acid, yellow in base |
| Phenolphthalein Indicator | Colourless in acid, pink in base |