
Maxwell-Boltzmann Distribution
Quick Notes
- The Maxwell-Boltzmann distribution curve describes the distribution of molecular energies in a gas.
- Key features of the curve:
- Starts at the origin (0,0) → No particles have zero energy.
- Peaks at the most probable energy → The energy that most particles have.
- Has a long tail to the right → Some particles have very high energy.
- Only particles with energy ≥ activation energy (Ea) can react.
- Increasing temperature: Shifts the curve to the right and lowers the peak. More particles have energy ≥ Ea → Faster reaction rate.
- Adding a catalyst: Lowers the activation energy (Ea), increasing the fraction of particles that can react.
Full Notes
Maxwell-Boltzmann Distribution Curves have been outlined with more background theory
here.
This page is just what you need to know for AQA A-level Chemistry :)
Understanding the Maxwell-Boltzmann Distribution
The Maxwell-Boltzmann distribution is a graph that shows how available energy is spread out and shared amongst molecules of a gas.
It helps explain why:
- Not all molecules have the same energy.
- Only a small fraction of molecules have enough energy to react.
- Increasing temperature increases reaction rate.
Features of the Maxwell-Boltzmann Distribution Curve
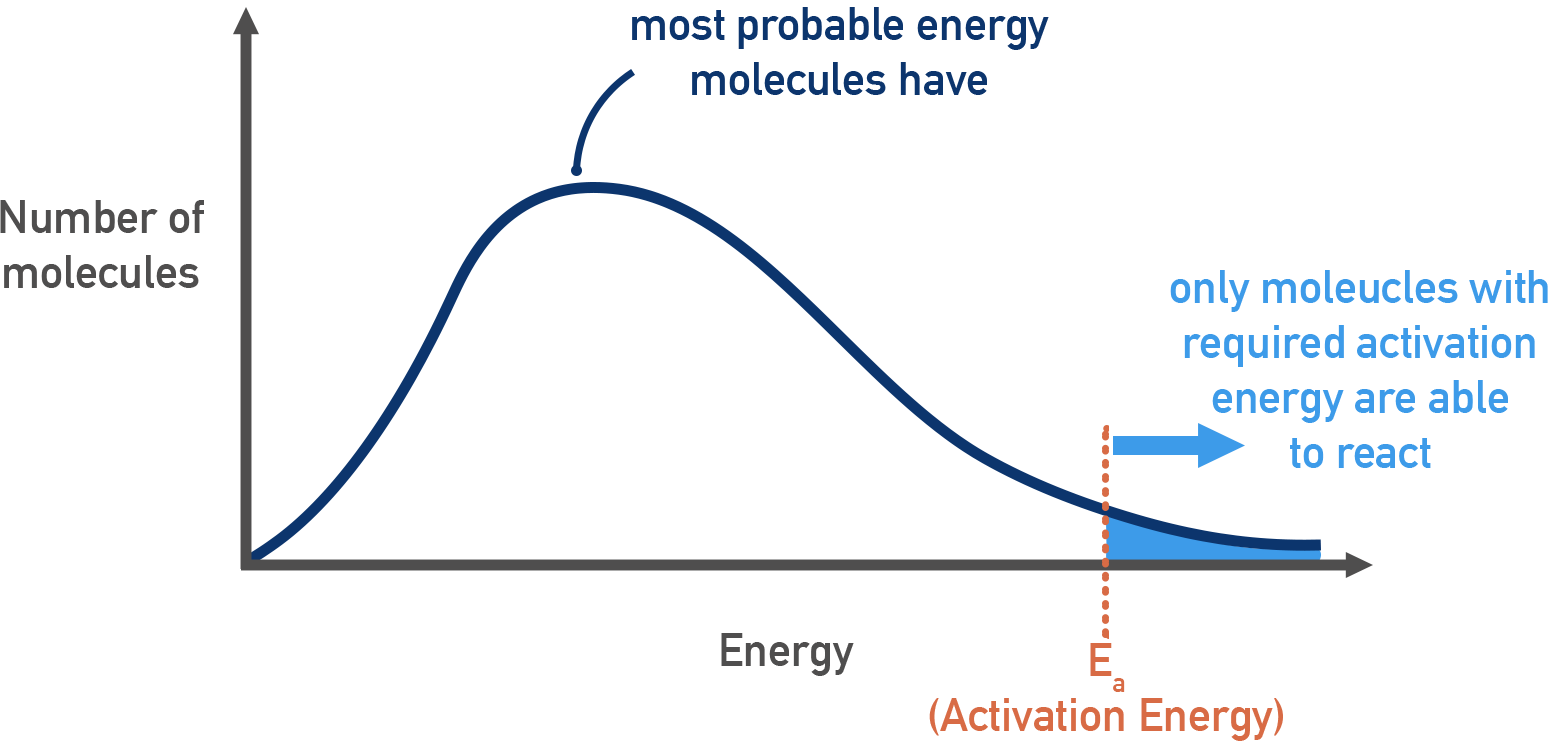
- Starts at the origin (0,0) because no particles have zero energy.
- Peak at the most probable energy represents the energy that most particles have.
- Has a long tail to the right – a few molecules have very high energy (never crosses the x axis again).
- Area under the curve = Total number of molecules.
- Only molecules with energy ≥ activation energy (Ea) can react.
Effect of Temperature on the Distribution
Increasing temperature shifts the curve right and lowers the peak.
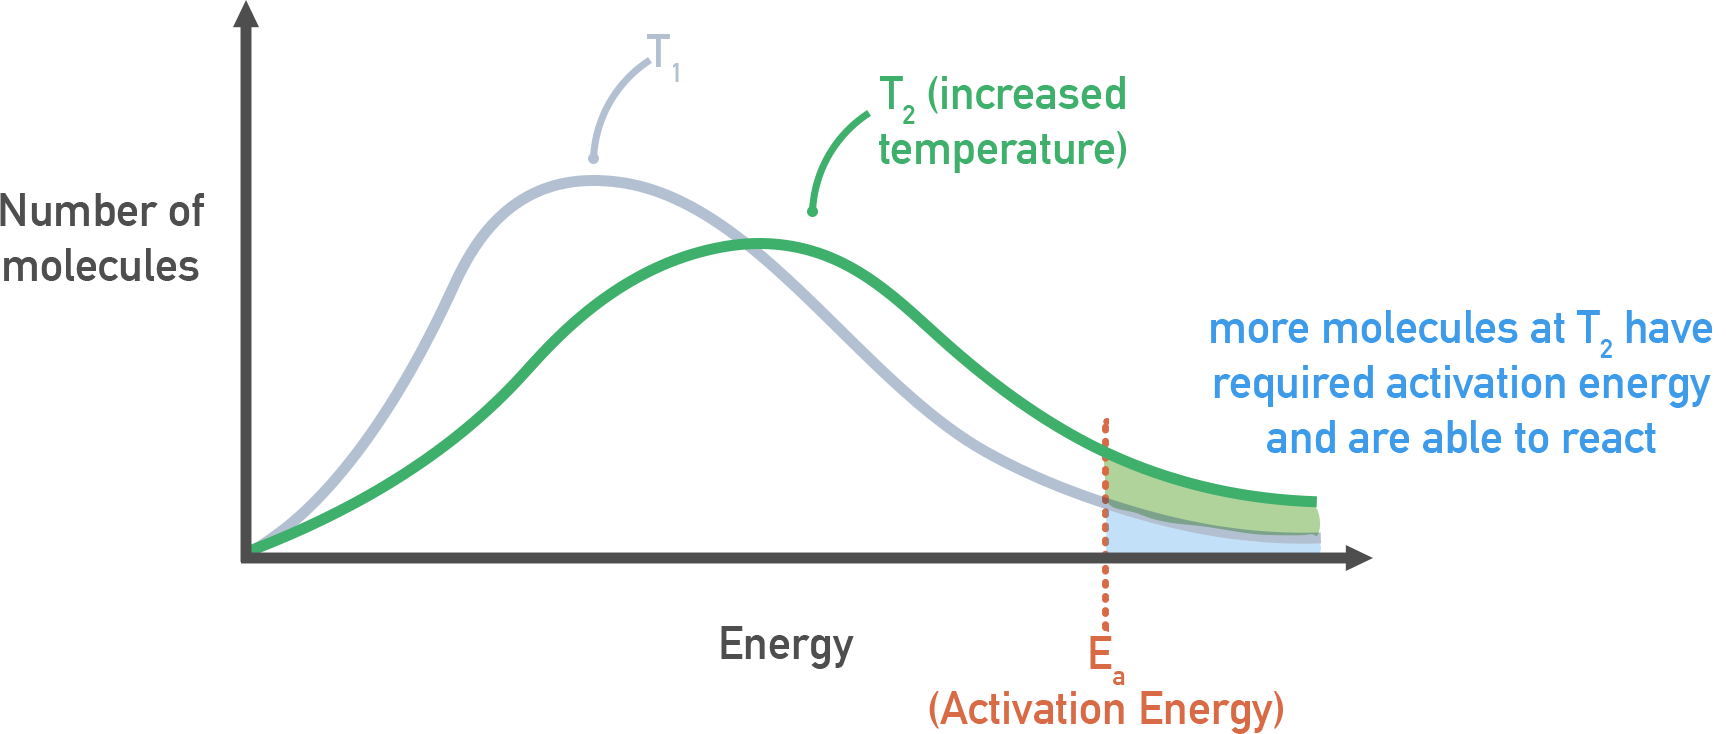
More molecules have energy ≥ Ea, increasing the rate of successful collisions.
The total number of molecules stays the same (area under the curve is unchanged).
Effect of a Catalyst on the Distribution
A catalyst lowers the activation energy (Ea).
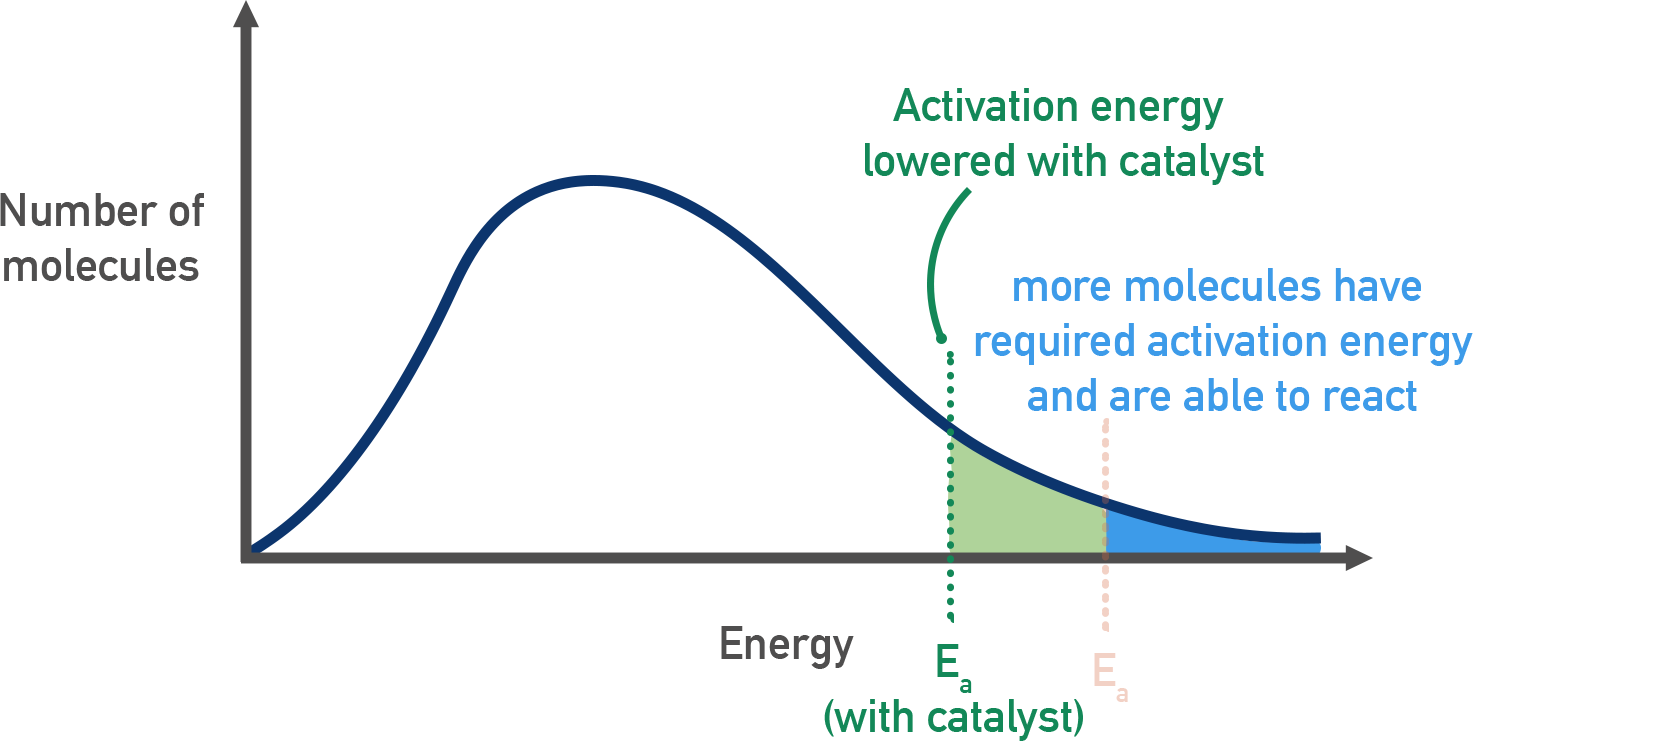
This means more molecules now have energy ≥ Ea, so frequency of successful collisions increases.
The Maxwell-Boltzmann curve shape does not change, but the activation energy shifts left.
Key Comparisons: Temperature vs. Catalyst Effects
| Factor | Effect on Curve | Effect on Reaction Rate |
|---|---|---|
| Increasing Temperature | Shifts curve right, peak lowers | More molecules have E ≥ Ea, faster reaction |
| Adding Catalyst | No shift in curve, but Ea is lower | More molecules can react, faster reaction |
Summary
- Maxwell–Boltzmann curve: origin at zero, most probable energy peak, long tail to the right.
- Only particles with E ≥ Ea can react; area under the curve is constant.
- Higher temperature increases the fraction above Ea; catalysts lower Ea.