Video Tutorial Titration Curves
Quick Notes Titration Curves
- Titrations are commonly used to find the unknown concentration of an acid (or base) by reacting it perfectly with a base (or acid) of known concentration.
- The volume of ‘known’ concentration solution added is called a titre and is used to determine the moles of acid or base in the volume of unknown concentration used in the titration.
- Titration curves show how the pH of an acidic or basic solution changes as a basic or acidic solution is added to it.
- The end point of a titration is the point at which an indicator changes colour at a certain pH. This should be as close to the equivalence point as possible.
- The equivalence point of a titration is the point at which 'chemically equivalent' amounts of acid and base have been mixed.
- Equivalence points are not always pH 7. An indicator that changes colour at a pH very close to the equivalence point must be used in a titration.
- The neutralisation point of a titration is the point at which the pH of the solution becomes 7 and the concentration of H+(aq) ions and OH-(aq) ions in the solution are the same.
Full Notes Titration Curves
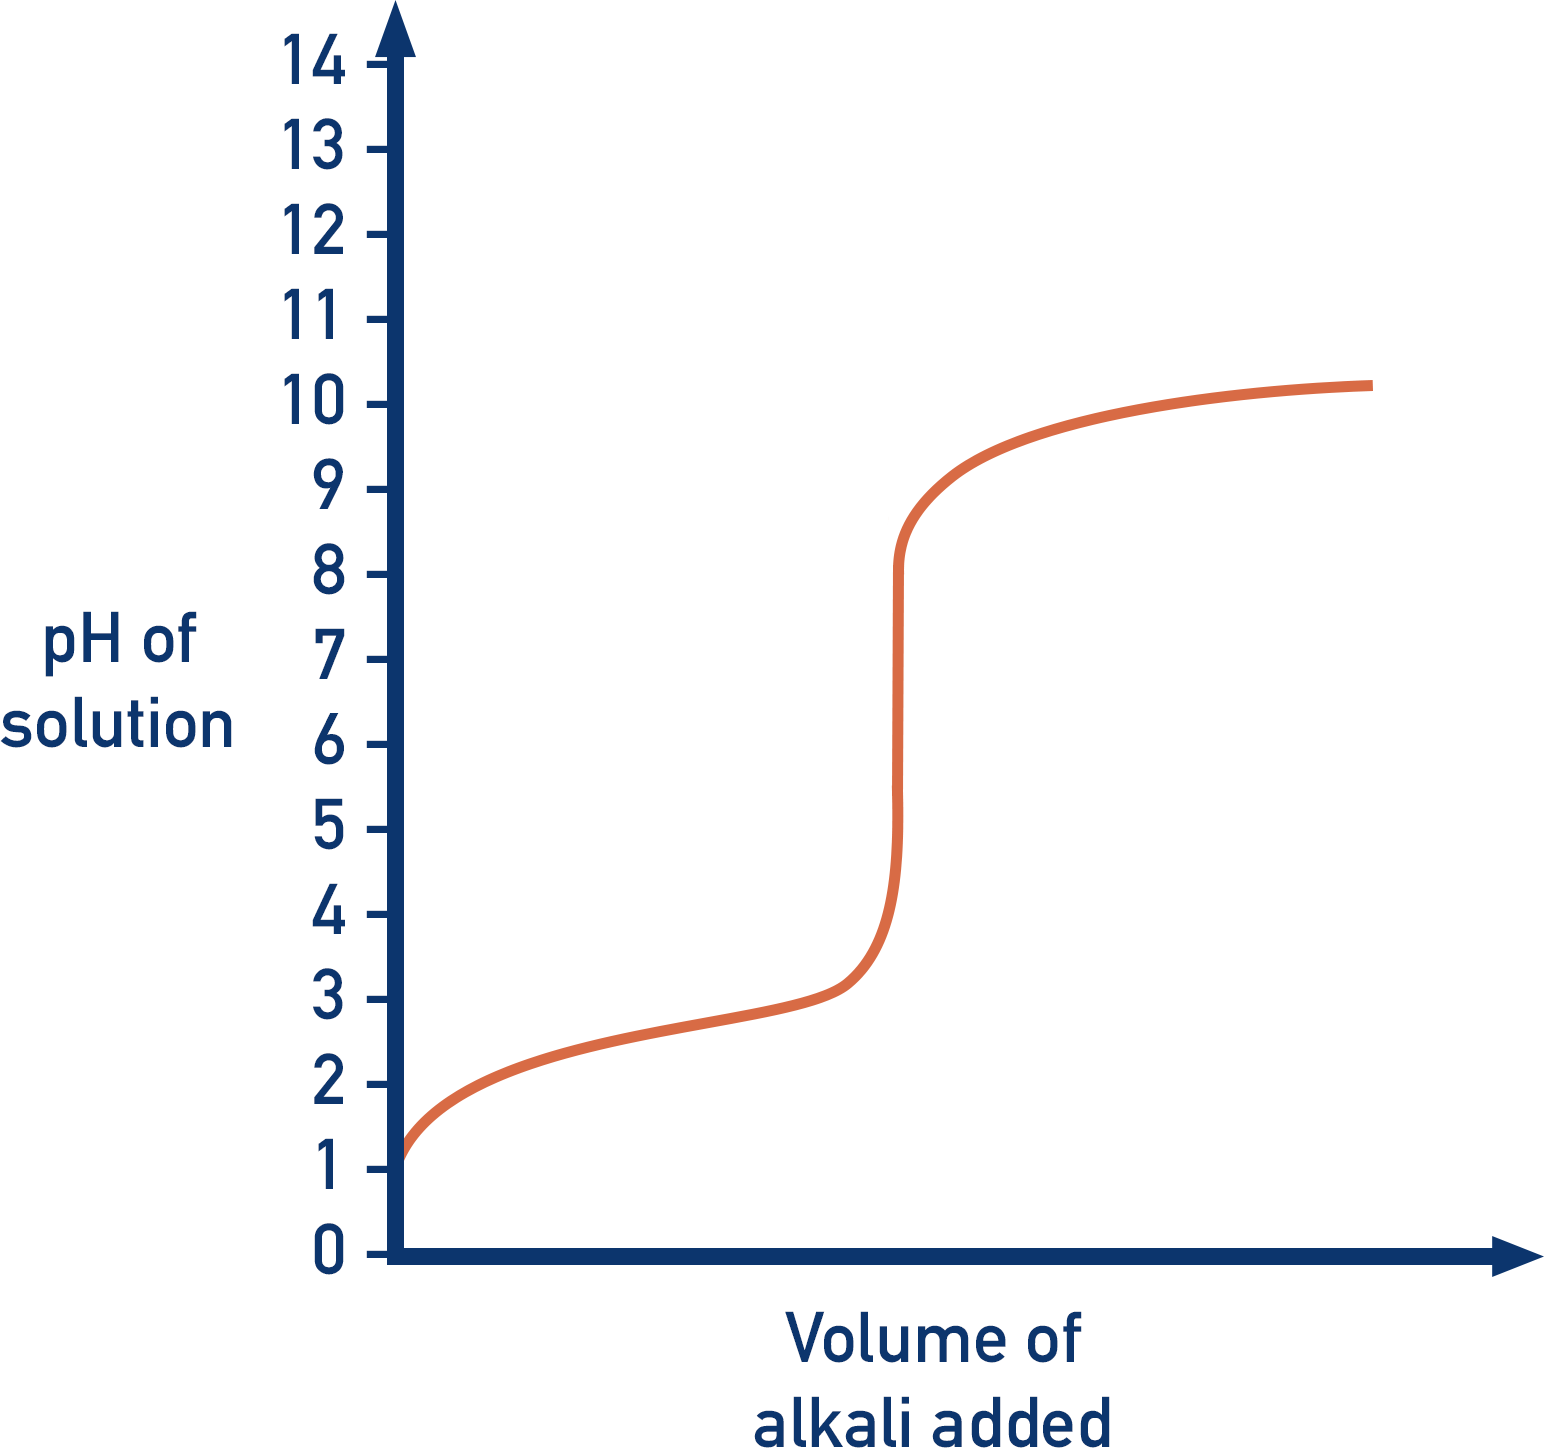
During a titration, pH can be plotted against the volume of acid added to a basic solution (or the other way round!) in a graph. The shape of the graph produced is called a titration curve. Their shapes look straightforward and easy to follow, but there are some key details that must be understood in order to fully ‘read’ a titration curve.
The most confusing terms for A-level chemistry students are normally the ‘end point’ and the ‘equivalence point’ – they are not the same!
During a titration, an indicator is used that changes colour at a certain pH. When the solution reaches this pH, the indicator changes colour – this is how the person carrying out the titration knows it is ‘complete’. The end point of a titration is when enough ‘titrant’ has been added to make the indicator change colour. Different indicators can change colour at different pH values, this is why the same indicators aren’t always used for different titrations.
Note – a titrant is the solution of known concentration and the volume of titrant used in a titration is called the ‘titre’.
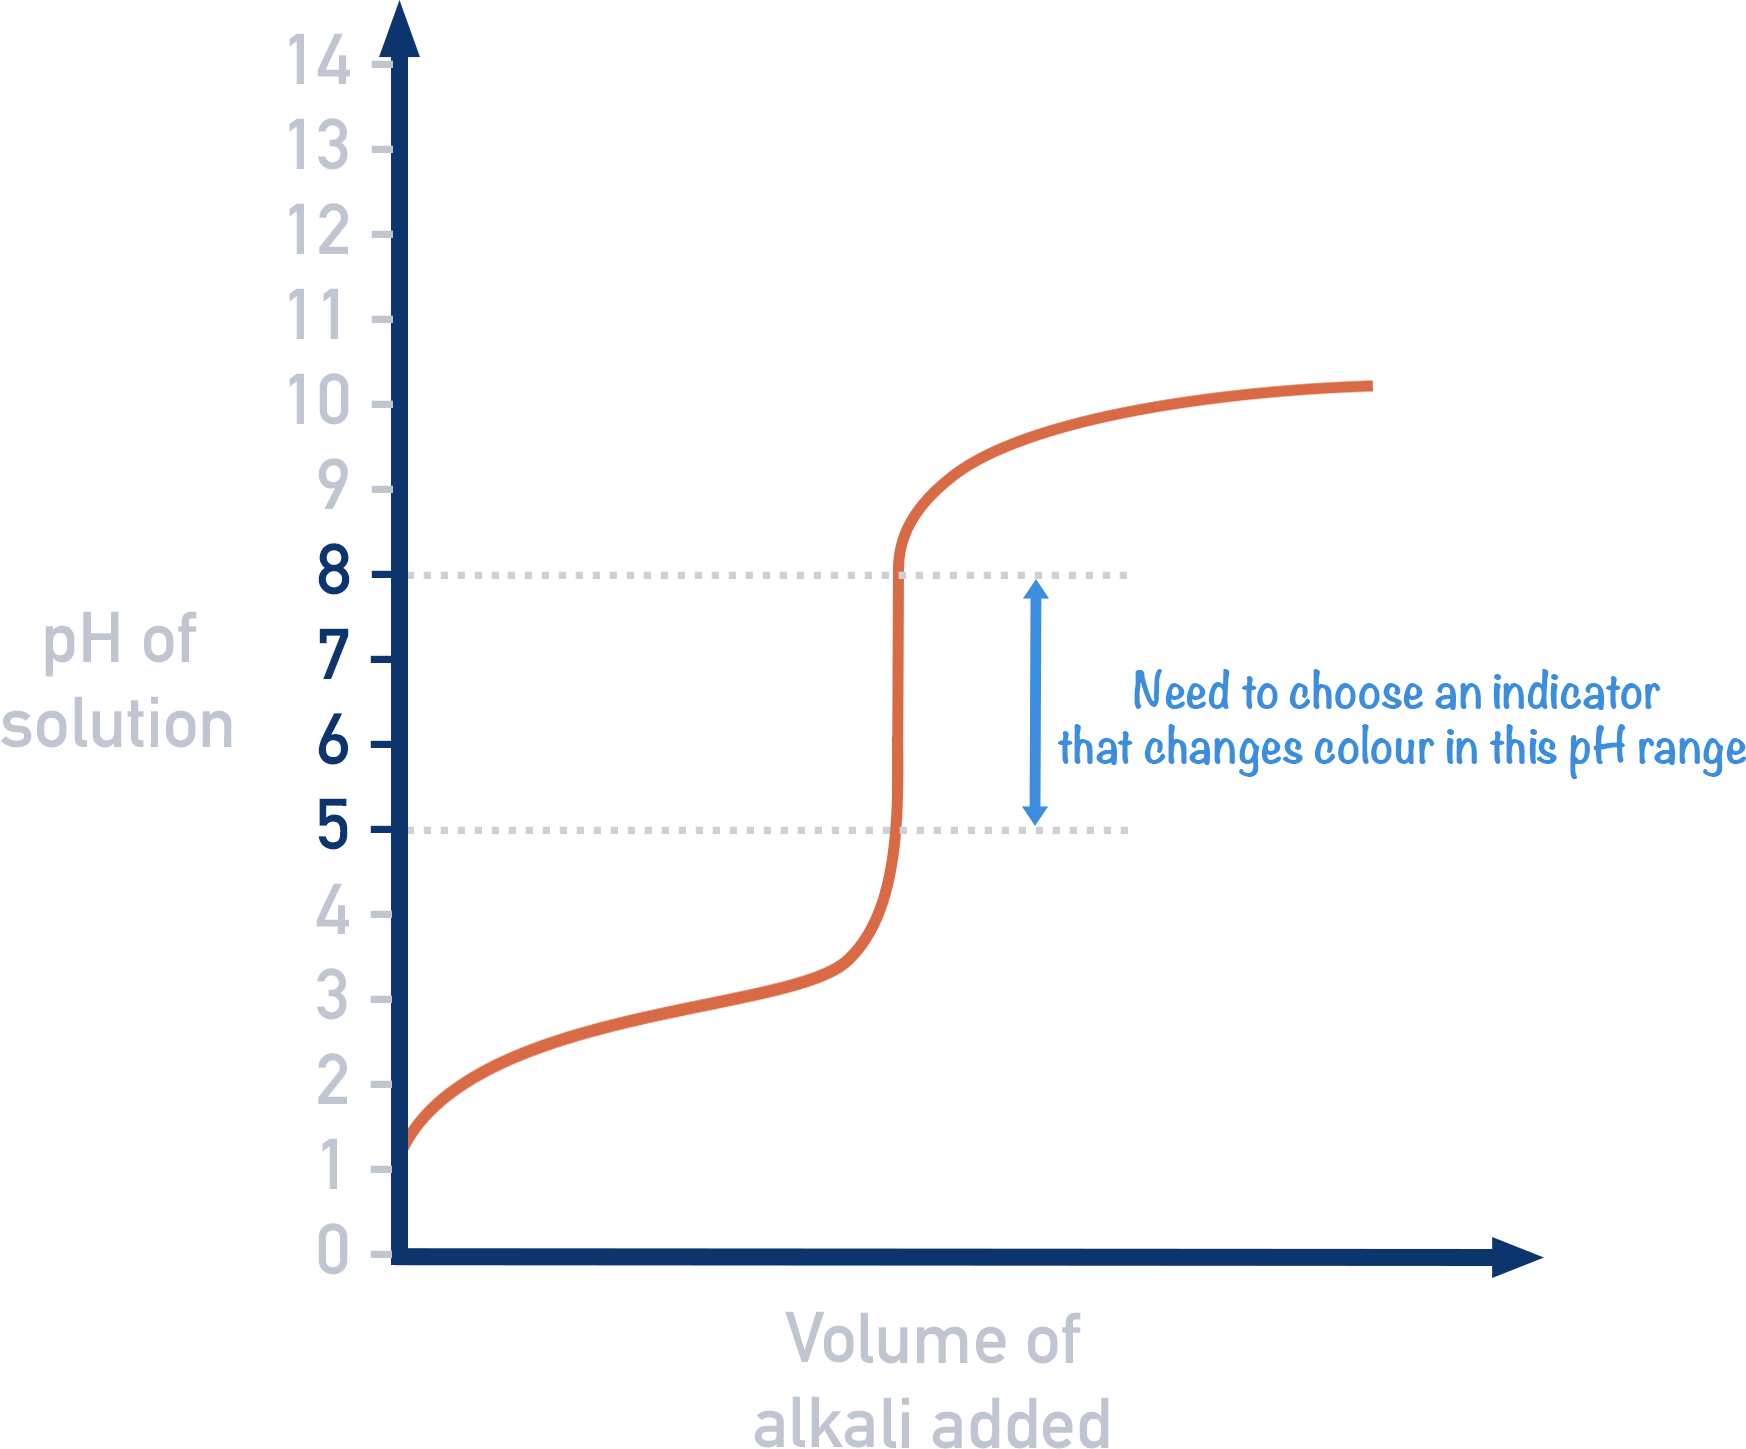
Indicators should be chosen that change colour at a pH that falls within the sharp peak area of a titration curve.
The usual purpose of a titration is to find the concentration of an acidic or basic solution, by using a basic (or acidic) solution with a known concentration (the titrant). The equivalence point of a titration is the point at which just the right amount of titrant has been added to ensure 'chemically equivalent' amounts of acid and base have been mixed (this just means the acid and base have perfectly reacted together and there isn't any amount of either left over). At the equivalence point, the solution should only contain a salt and water.
From the equivalent point, we can determine the moles of either acid or base that were added and then find the moles of base or acid that must have been present in the sample of unknown concentration. This is why the equivalence point is so important!
End Point and Equivalent Point
What is the difference between the end point and the equivalence point?
The end point is simply when a colour change occurs as the solution in a titration gets to a particular pH.
The equivalence point refers to the point at which chemically equivalent amounts of acid and base have been mixed in the solution, not the pH of the solution.
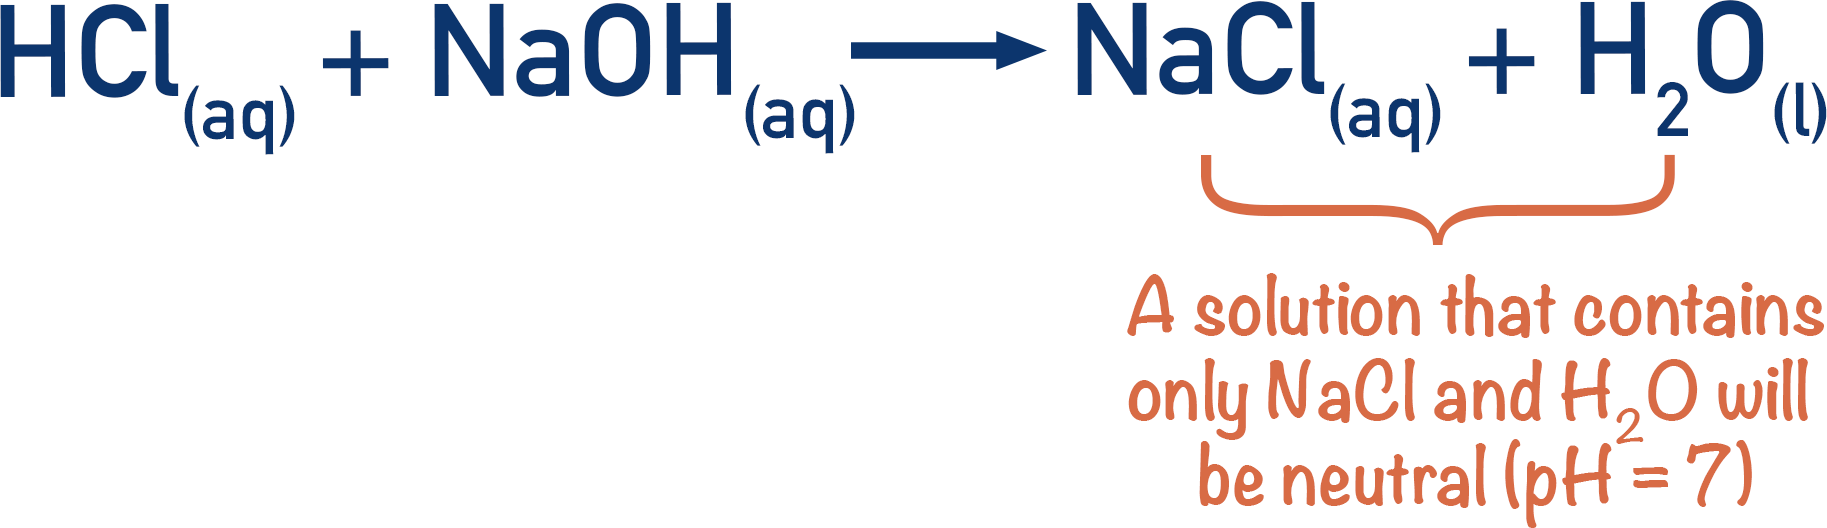
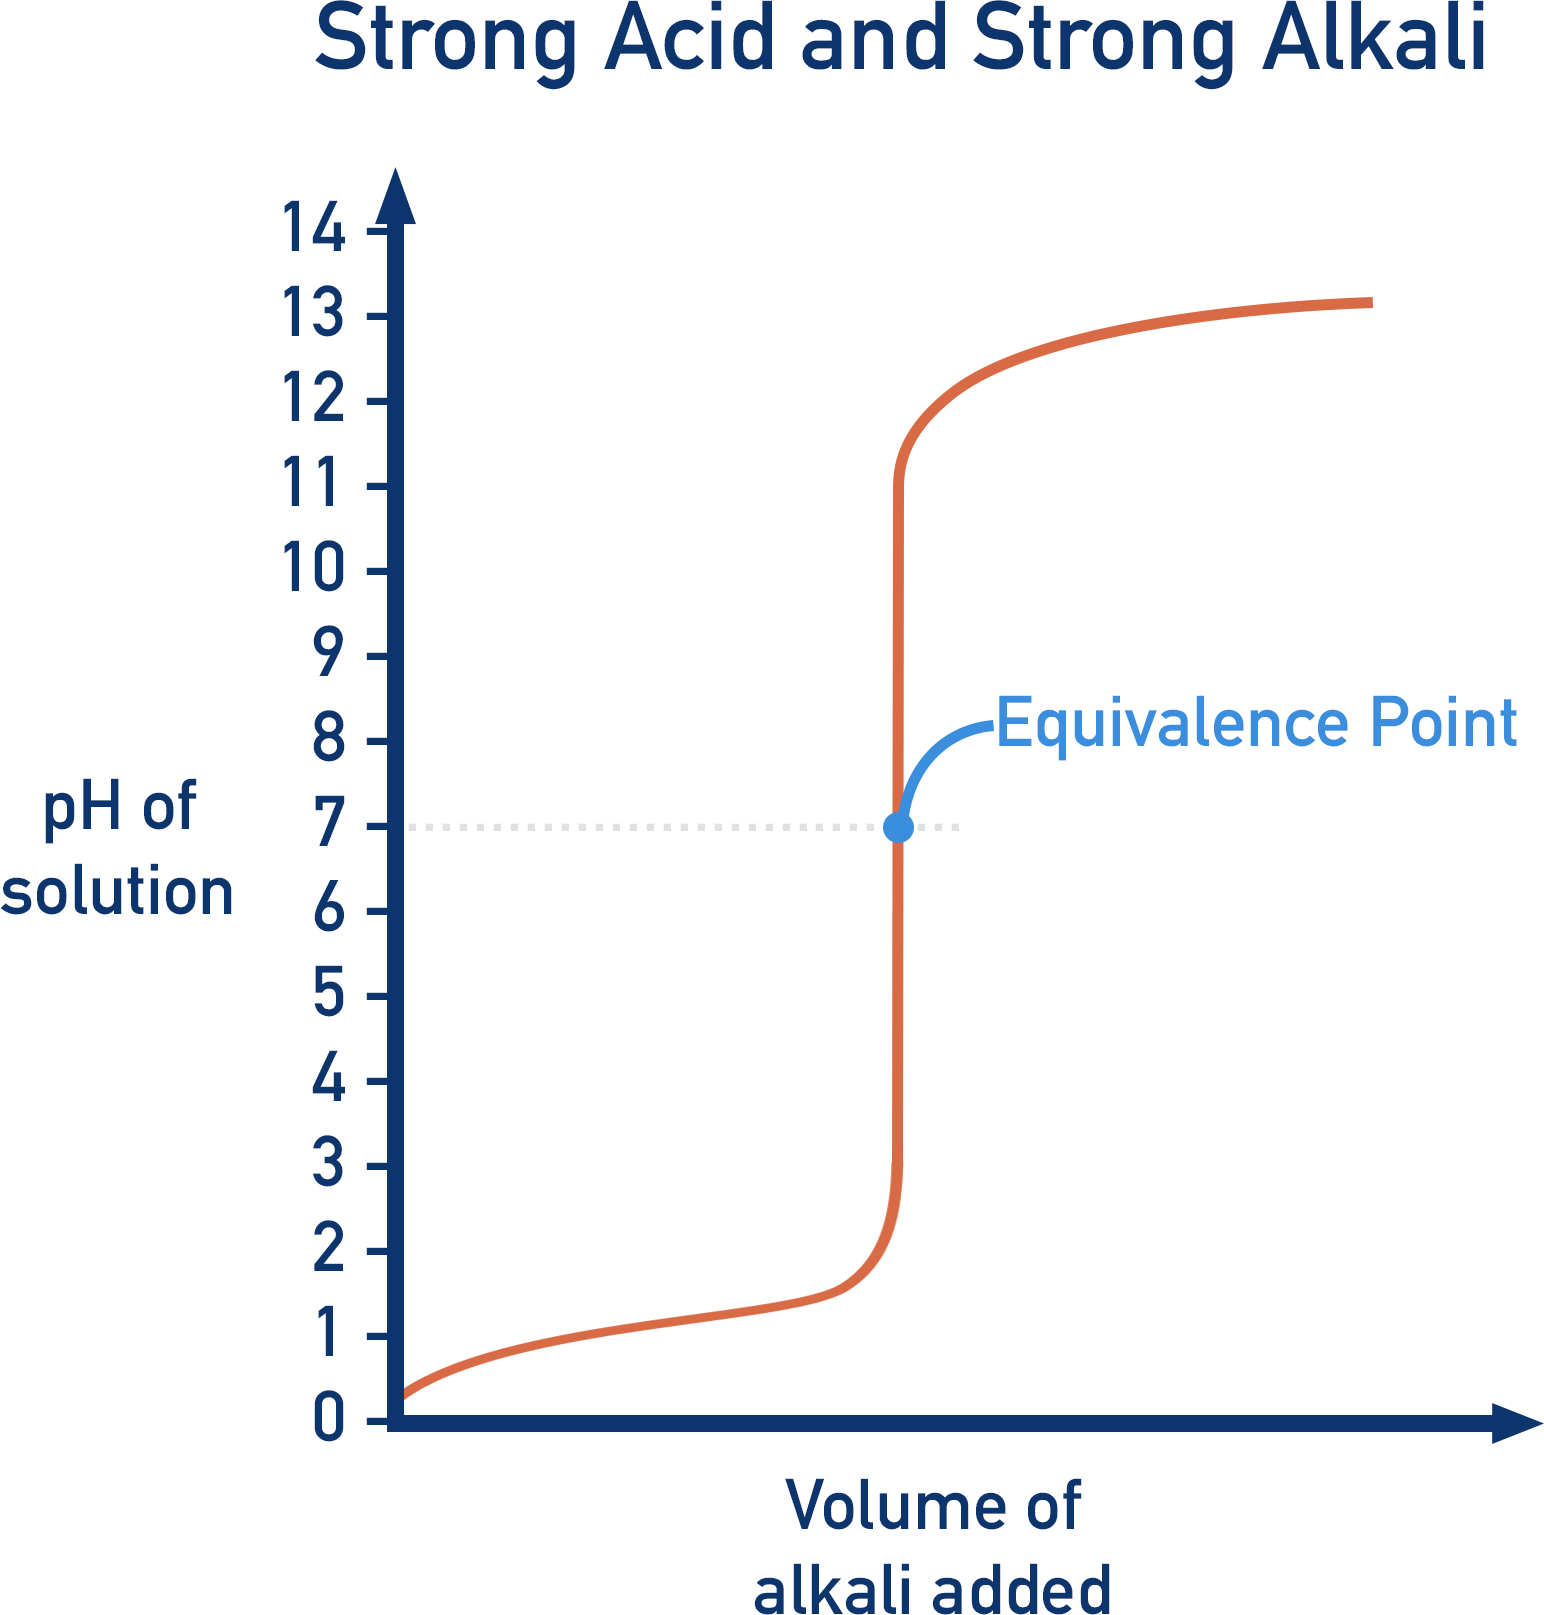
In a titration, we want the end point to be as close to the equivalence point as possible. If a strong acid is titrated with a strong base, the resulting solution has a pH of 7. If we use an indicator that changes colour at pH 7, the end point will be the same as the equivalence point of the solution.
For example:

Water and sodium chloride are the only products produced, neither of which affects pH. The solution is pH 7 and is neutral. Here, the neutralisation point and equivalence points are the same.
Note - The neutralisation point of a titration is the point at which just the right amount of titre has been added to make the pH of the solution 7 (neutral).
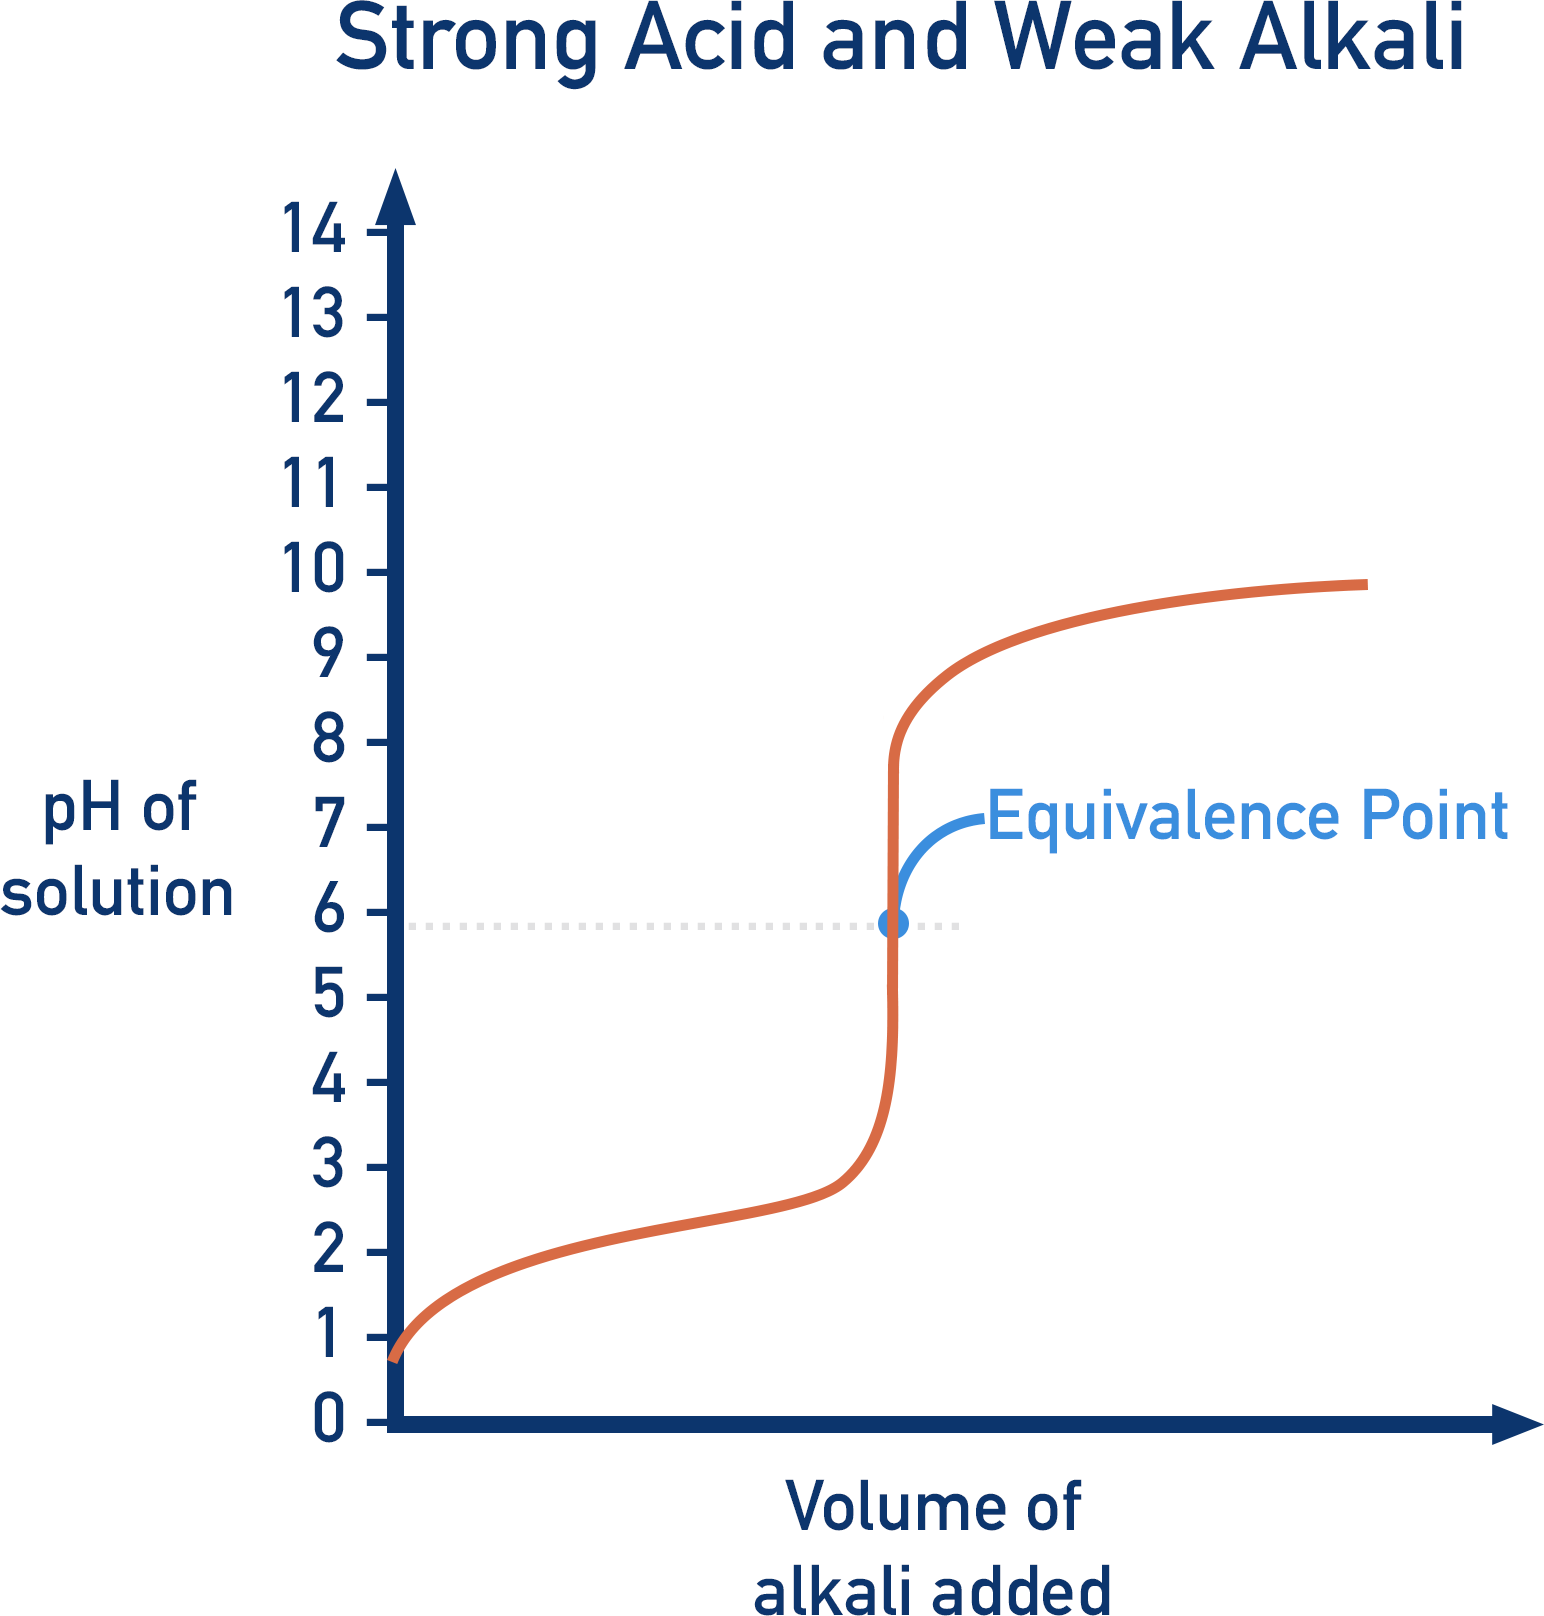
However, if a strong acid is titrated with a weak base, at the equivalence point, the solution produced doesn’t have a pH of 7. The solution is not neutral, even though the moles of acid and base have been perfectly mixed. If an indicator that changes colour at pH 7 was used, the end point of the titration would not be the same as the equivalence point.
For example:

In the above example, the strong acid hydrochloric acid and weak base ammonia, produce ammonium (NH+4) and chloride (Cl-) ions. At the equivalence point there is no HCl or NH3, but only NH+4 and Cl-.
The thing we have to be aware of is that ammonium ions release H+ ions in solution (see Acids and Bases).
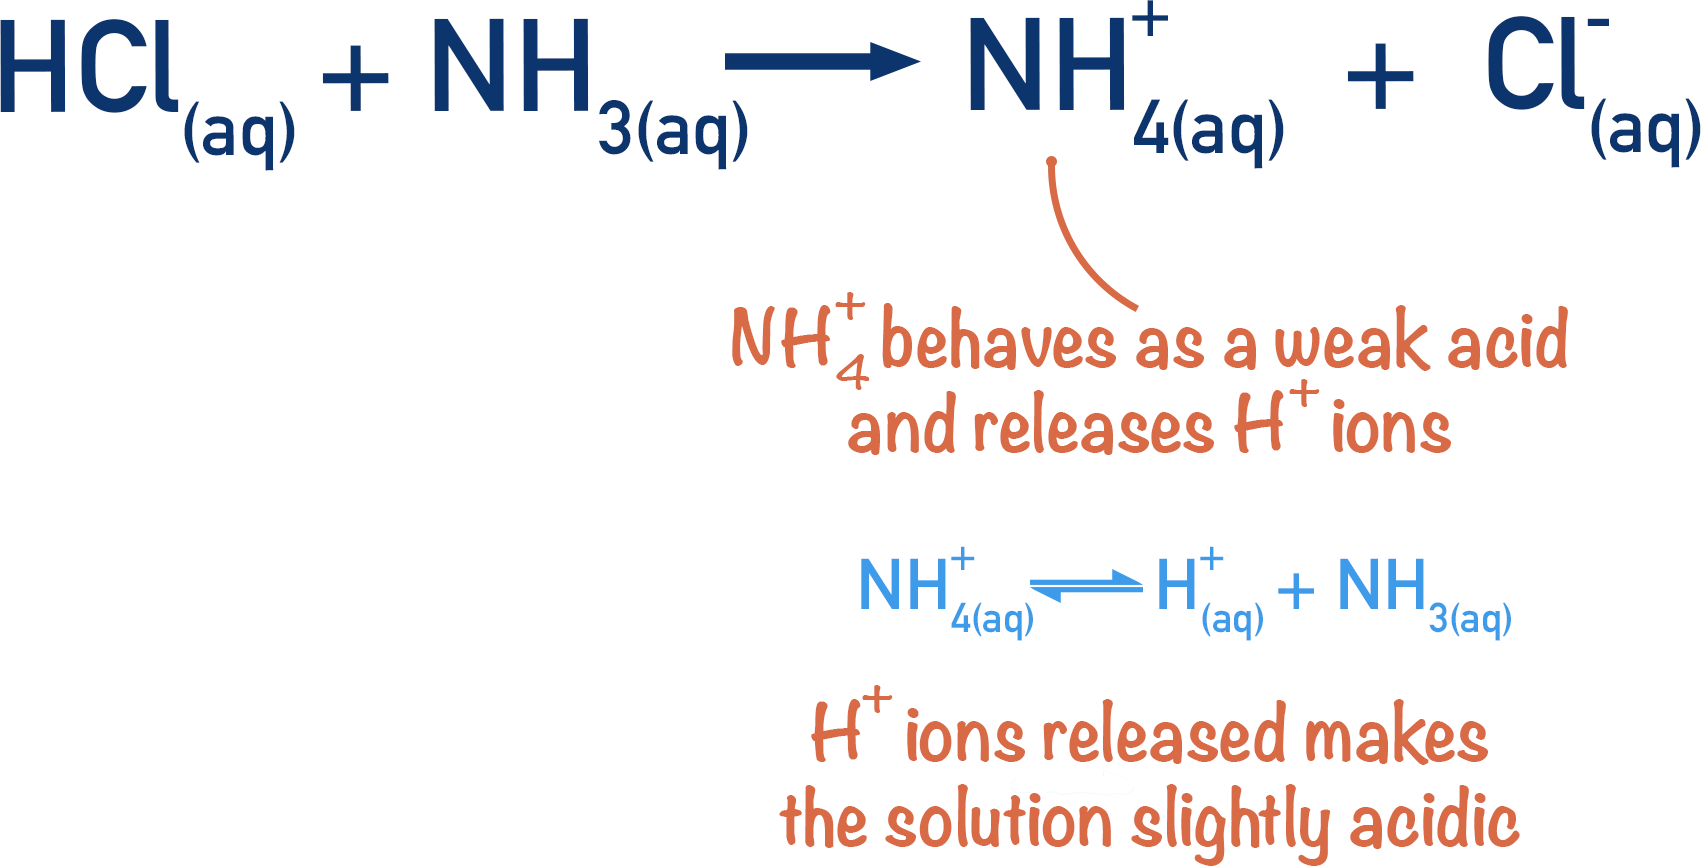
This means the solution becomes slightly acidic, even though there is no original acid left in the solution. At the equivalence point, the pH of the solution wouldn’t be 7.
To get the solution to reach a pH of 7 and reach the neutralisation point, more NH3 would have to be added. Now the moles of NH3 added isn’t the same as the moles of acid at the start.
If an indicator was used that changed colour at pH 7, the end point wouldn’t be anywhere near the equivalence point. Instead, a different indicator would need to be used, which changes colour at the pH value when the equivalence point is reached.
Titration Curves
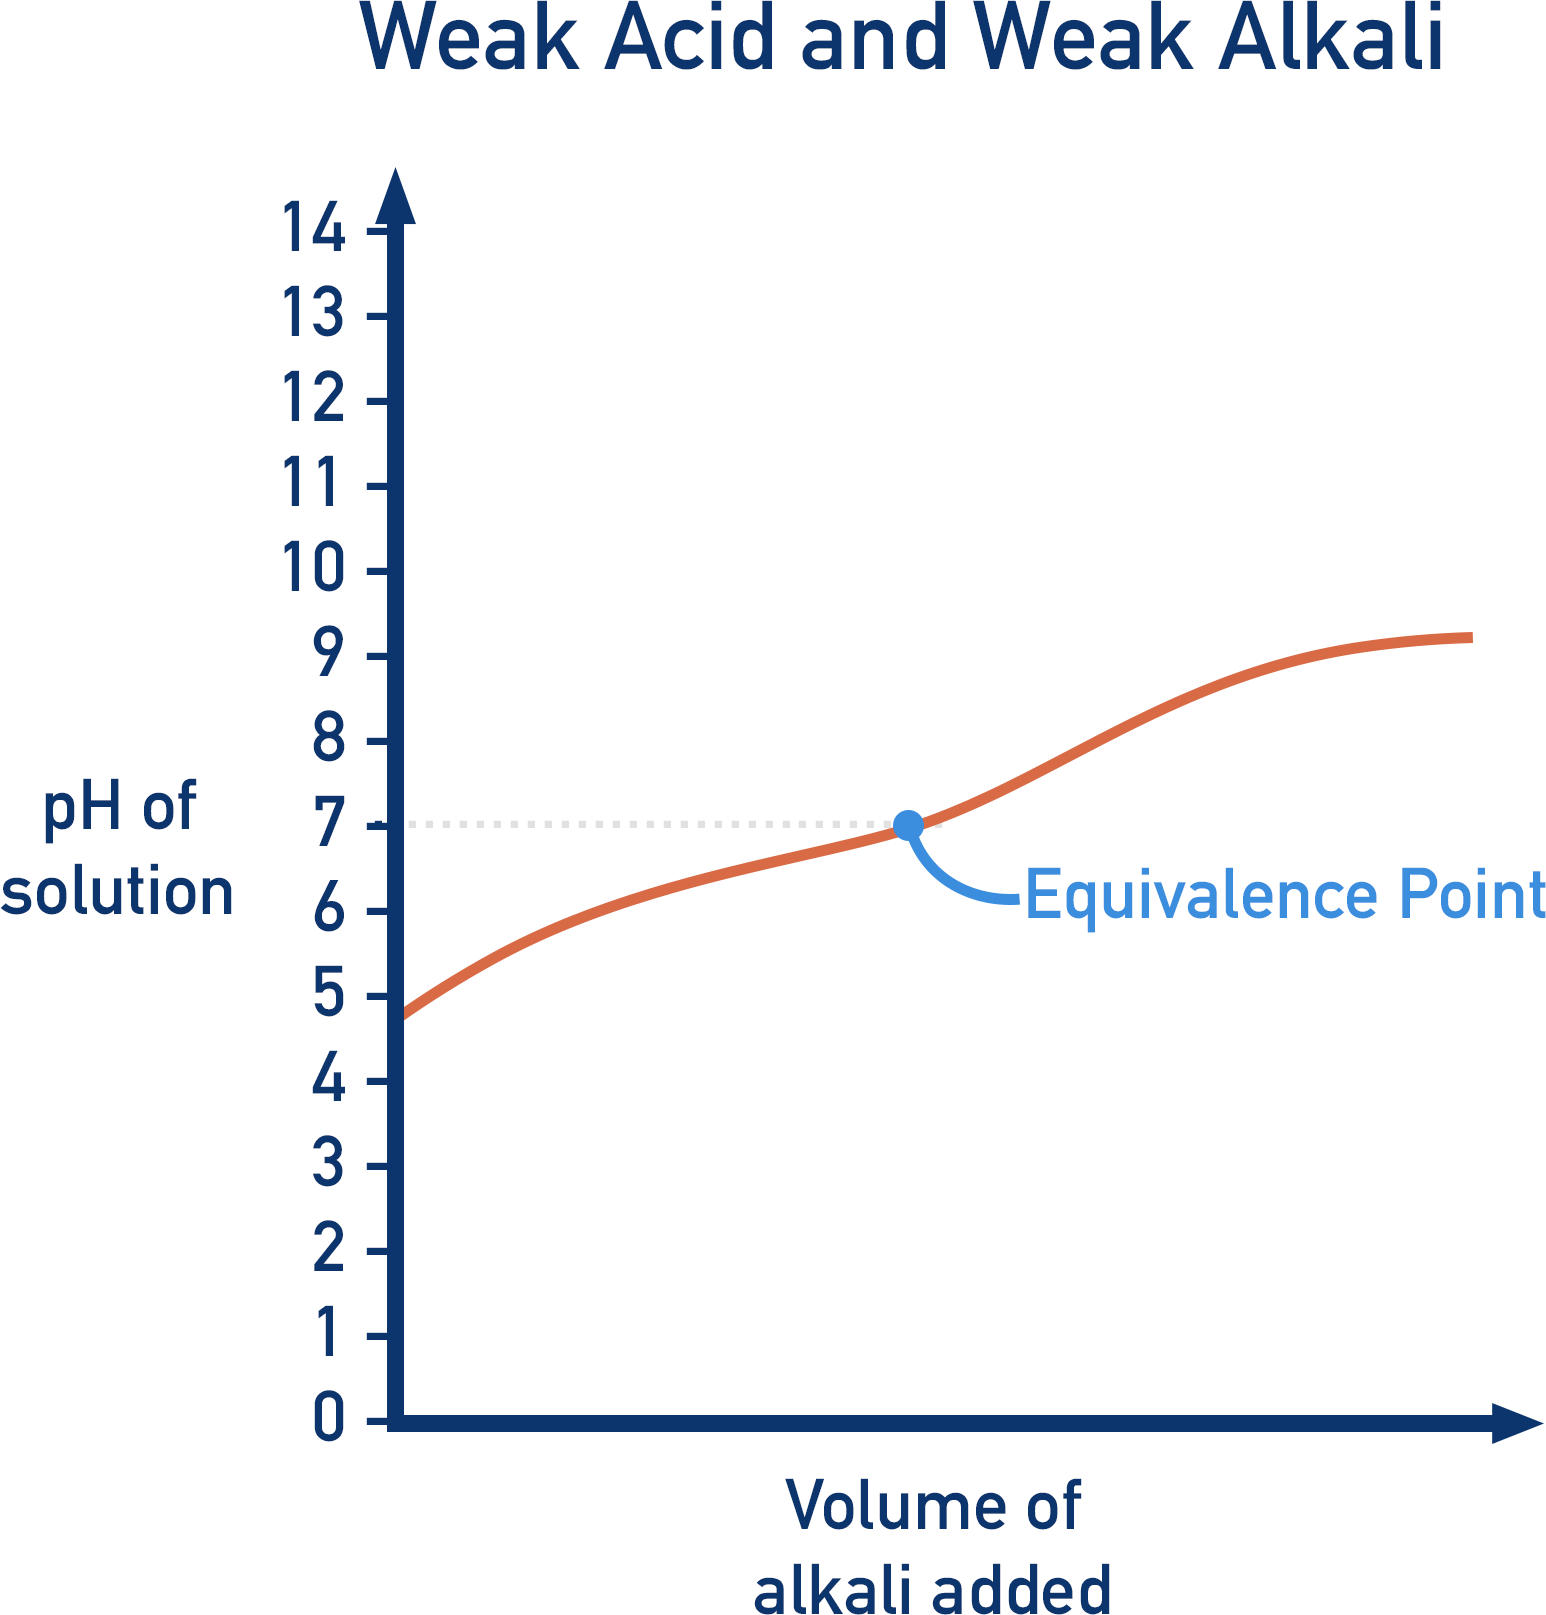
There are four shapes of titration curves that you need to be able to explain.
In the examples shown below, alkali is added to an acid. As the starting solution is acidic, the pH of the curve starts low. As alkali is added, the pH of the solution begins to increase. This is because the acid reacts with the alkali, so the H+ ion concentration in the solution decreases. The pH increases with a small, sloped graph as the pH scale is logarithmic (see pH).
Depending upon the strength of the acid or alkali used, the shape of the graph will change. By learning the basic shapes of pH graphs, you can determine whether a strong or weak acid and a strong or weak alkali was used in a titration.
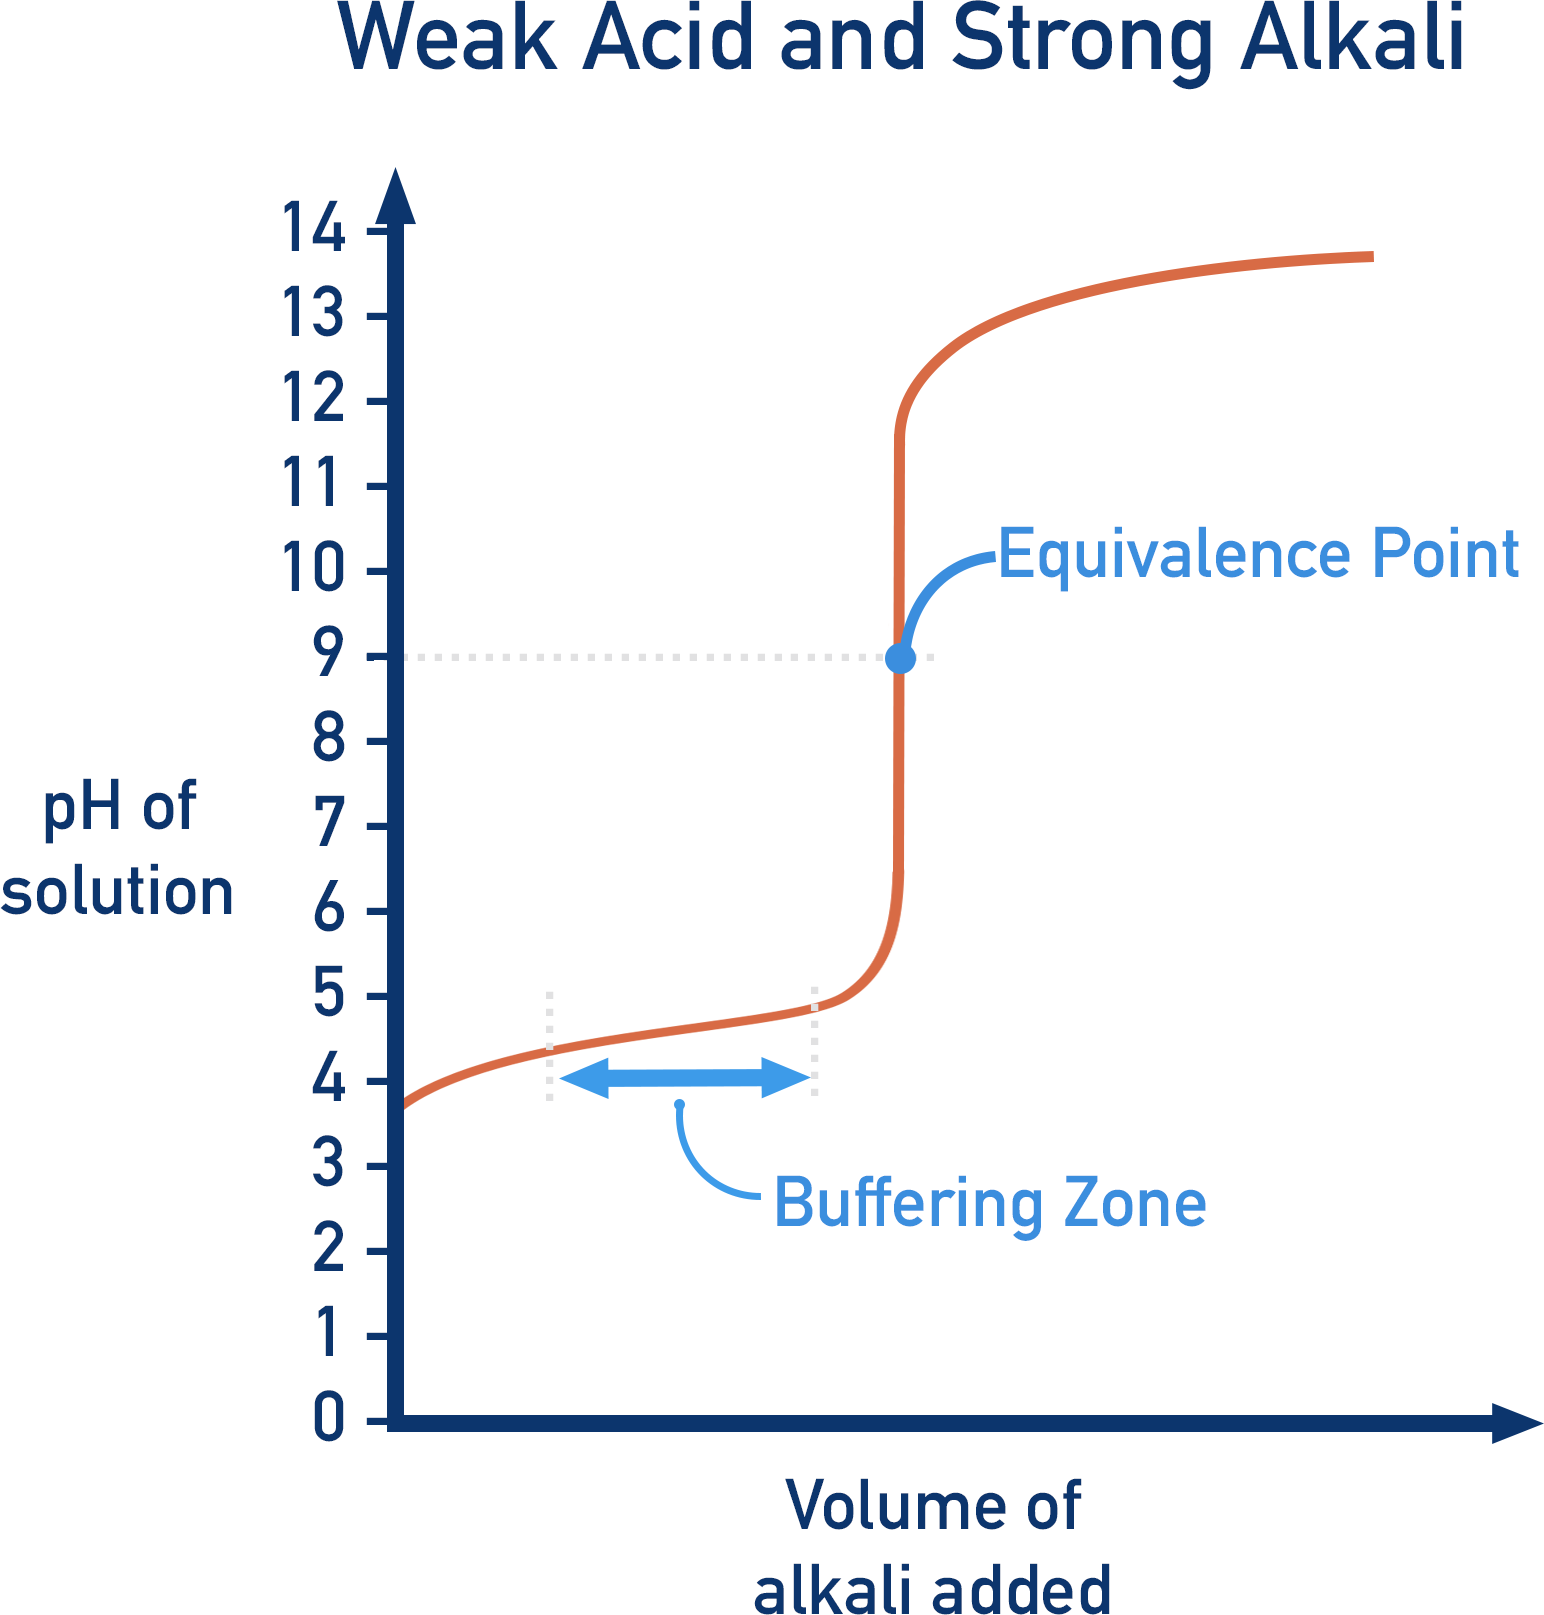
Weak Acids

With weak acids, there is a simple buffer solution formed during the titration. In the above equation, A- is formed, which is the conjugate base of the weak acid, HA. This means we have excess HA and A- in the solution, as well as H+ ions from dissociation of the acid. A buffer system is present (see Buffers). As buffer systems resist changes to pH, the pH change is slow. The titration curve shows this as the ‘buffering’ region.
We’ve launched our new site! 🎉
Course-specific notes with built-in search!
AP • A-Level (AQA • CIE • Edexcel • OCR) • IB • NCERT 11 + 12
over 750+ new pages and 3,500 images.
Visit the new homepage