
Mass Spectra of Elements
Quick Notes
- Most elements exist as a mix of isotopes — atoms with the same number of protons but different numbers of neutrons.
- Mass spectrometry separates these isotopes based on their mass-to-charge ratio and shows the relative abundance of each isotope.
- A mass spectrum is a graph with:
- x-axis = mass (or m/z, where z = 1 for monatomic ions)
- y-axis = relative abundance (%)
- The average atomic mass of an element is calculated as a weighted average using the masses and abundances of all its naturally occurring isotopes.
- Key formula: average atomic mass = (isotope 1 mass × % abundance) + (isotope 2 mass × % abundance) + …
Full Notes
Many elements in nature exist as mixtures of isotopes. Isotopes are atoms with the same number of protons (same element) but a different number of neutrons, giving them different masses.
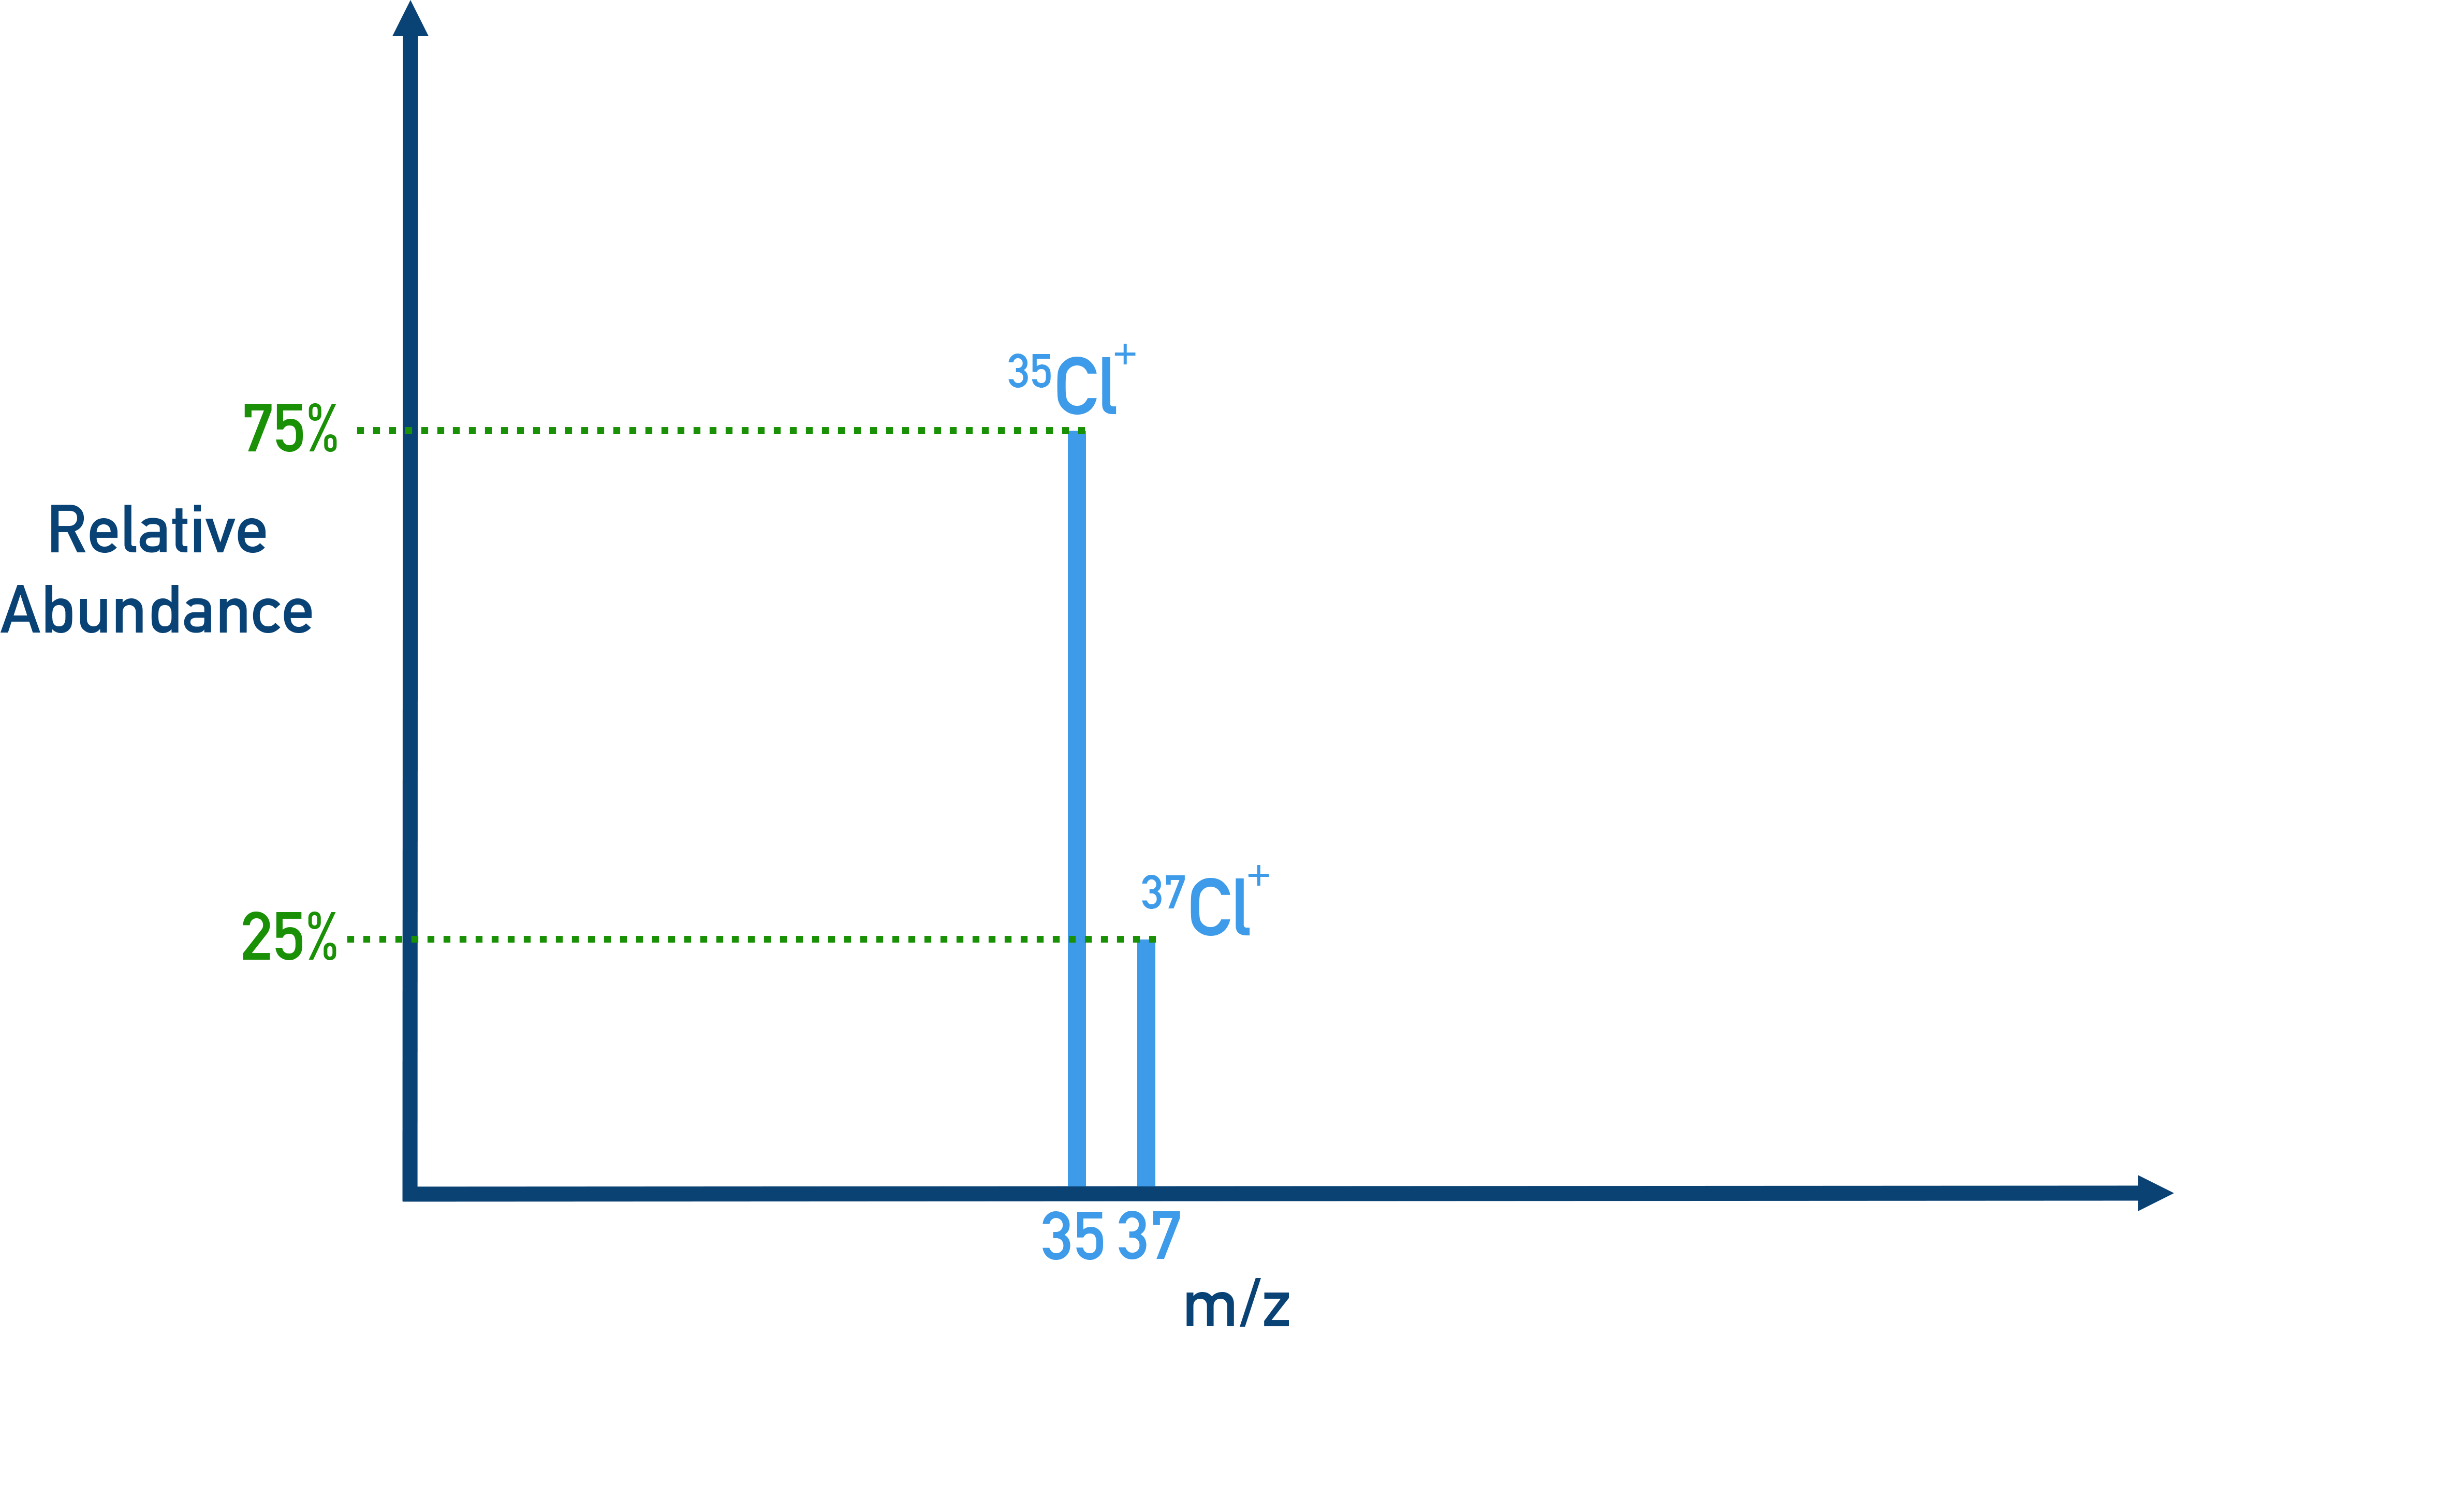
ExampleChlorine gas naturally contains two isotopes - Cl-35 and Cl-37. 75% of the chlorine atoms are the Cl-35 and 25% are Cl-37. With the average relative mass of atoms in a sample being 35.5.

What Is Mass Spectrometry?
Mass spectrometry is a technique used to separate and measure the different isotopes in a sample of an element. It works by ionizing atoms, accelerating them, and then deflecting them based on their mass-to-charge ratio. There are several different types of Mass Spectrometry and these have been explained in more detail at https://www.chemistrystudent.com/massspectrometrytof.html.
Note - you don’t need to know all the details of how a mass spectrometer works however you should be comfortable with the overall idea and purpose of the technique.
Reading a Mass Spectrum
A mass spectrum is a bar graph where:
- The x-axis shows the mass of isotope detected (technically the m/z value of the ion detected, with z=1 for AP chemistry).
- The y-axis shows the relative abundance of each isotope, usually as a percentage.
In AP Chemistry, we only focus on singly charged monatomic ions, meaning each peak in a spectrum represents a different isotope of the same element. A taller peak or bar means that isotope is more abundant in nature.

If you are given a mass spectrum with just bars and no percentages, you can treat the bar heights as relative values. Add the total height of all bars, then calculate each bar’s percentage as a fraction of the total.
Calculating Average Atomic Mass
The average atomic mass listed on the periodic table is not a simple average. It is a weighted average that reflects both the mass and natural abundance of each isotope.
To avoid confusion with relative atomic mass, imagine you have 100 atoms of the element. If isotope A has 75% abundance and isotope B has 25%, then: Total mass from A = (mass of A) × 75; Total mass from B = (mass of B) × 25. Add these to get the combined mass of all 100 atoms, then divide by 100 to find the average mass of one atom — which is the relative atomic mass.
Formula:
average atomic mass = (isotope 1 mass × fraction abundance) + (isotope 2 mass × fraction abundance) + …
A sample of chlorine contains two isotopes:
Chlorine-35 (mass = 34.97 amu, abundance = 75.78%)
Chlorine-37 (mass = 36.97 amu, abundance = 24.22%)
- Convert abundances to decimals
75.78% = 0.7578; 24.22% = 0.2422 - Multiply each isotope’s mass by its abundance
34.97 × 0.7578 = 26.50; 36.97 × 0.2422 = 8.96 - Add the results
26.50 + 8.96 = 35.46 amu
Answer: The average atomic mass of chlorine is 35.46 amu
Summary
A mass spectrum displays the isotopes of an element and their relative abundances. This data allows us to calculate the average atomic mass of the element as a weighted average of the isotope masses. This concept explains why atomic masses on the periodic table are often decimals — they reflect a natural mixture of isotopes.
Key points to remember:
- Isotopes = same element, different mass (different neutrons)
- Mass spectrum = graphical data about isotope masses and abundances
- Average atomic mass = sum of (mass × relative abundance) for each isotope divided by 100