
Energy of Phase Changes
Quick Notes
- Phase changes involve energy transfer without a change in temperature.
- The energy change depends on the number of moles and the molar enthalpy of the phase change.
- Key equations:
- For melting/freezing: q = nΔHfus
- For vaporization/condensation: q = nΔHvap
- where
- q = heat (J)
- n = moles
- ΔHfus = molar enthalpy of fusion (J/mol)
- ΔHvap = molar enthalpy of vaporization (J/mol)
Full Notes
Energy and Phase Changes
When a substance changes phase — for example, from solid to liquid or liquid to gas — it absorbs or releases energy. This energy is involved in the breaking or forming of forces holding the substance together, not in changing its temperature.
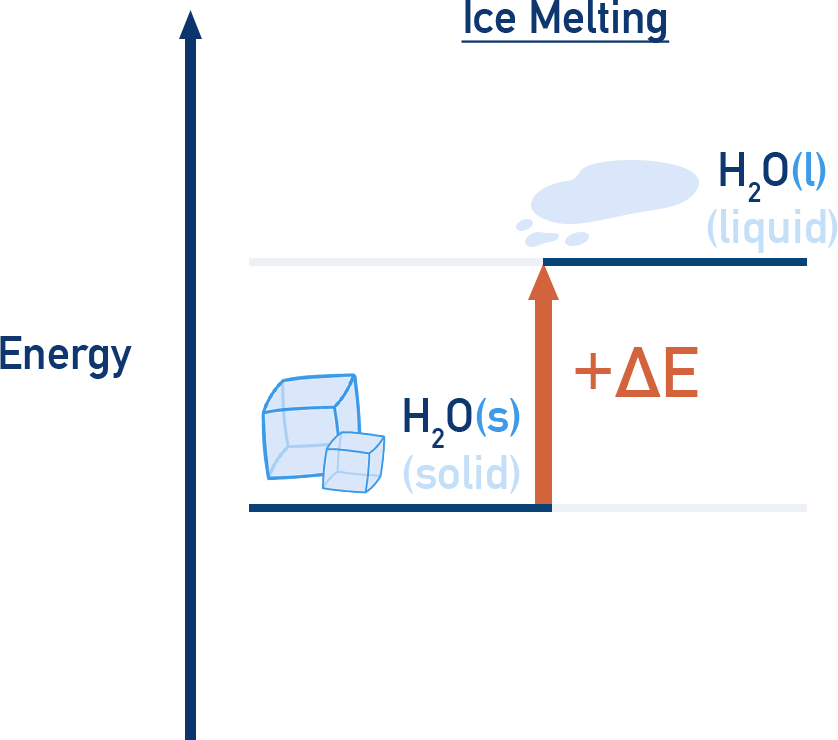
Melting (fusion) and boiling (vaporization) are endothermic – energy is absorbed.
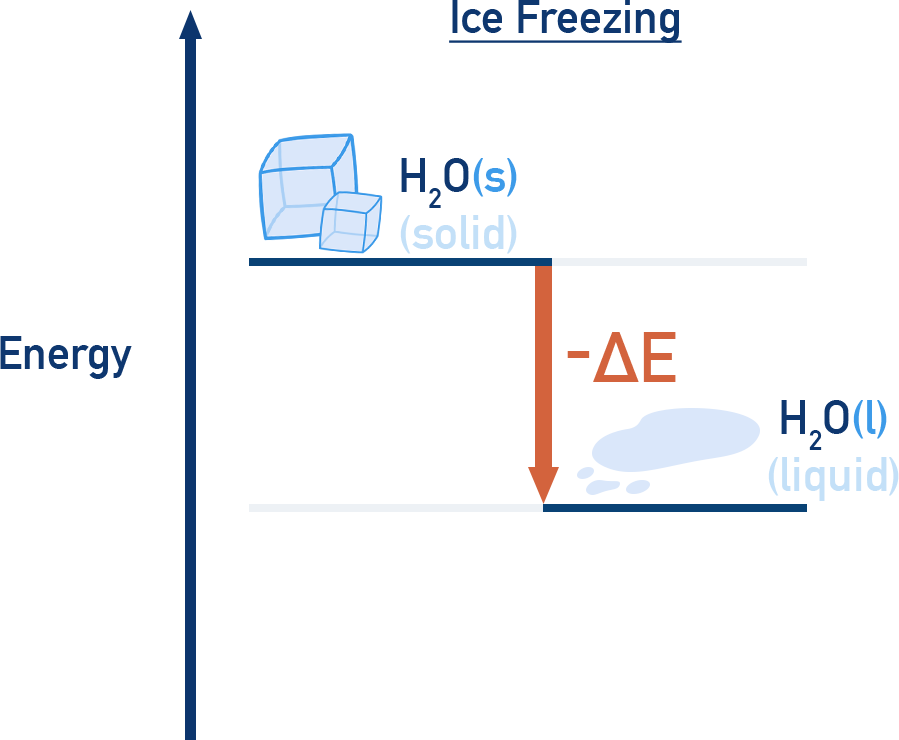
Freezing and condensation are exothermic – energy is released.
ExampleThe melting of ice (solid to liquid) is endothermic and the freezing of water (liquid to solid) is exothermic.
During these transitions, temperature remains constant, even though heat is being transferred.
Heating Curves and Temperature Plateaus
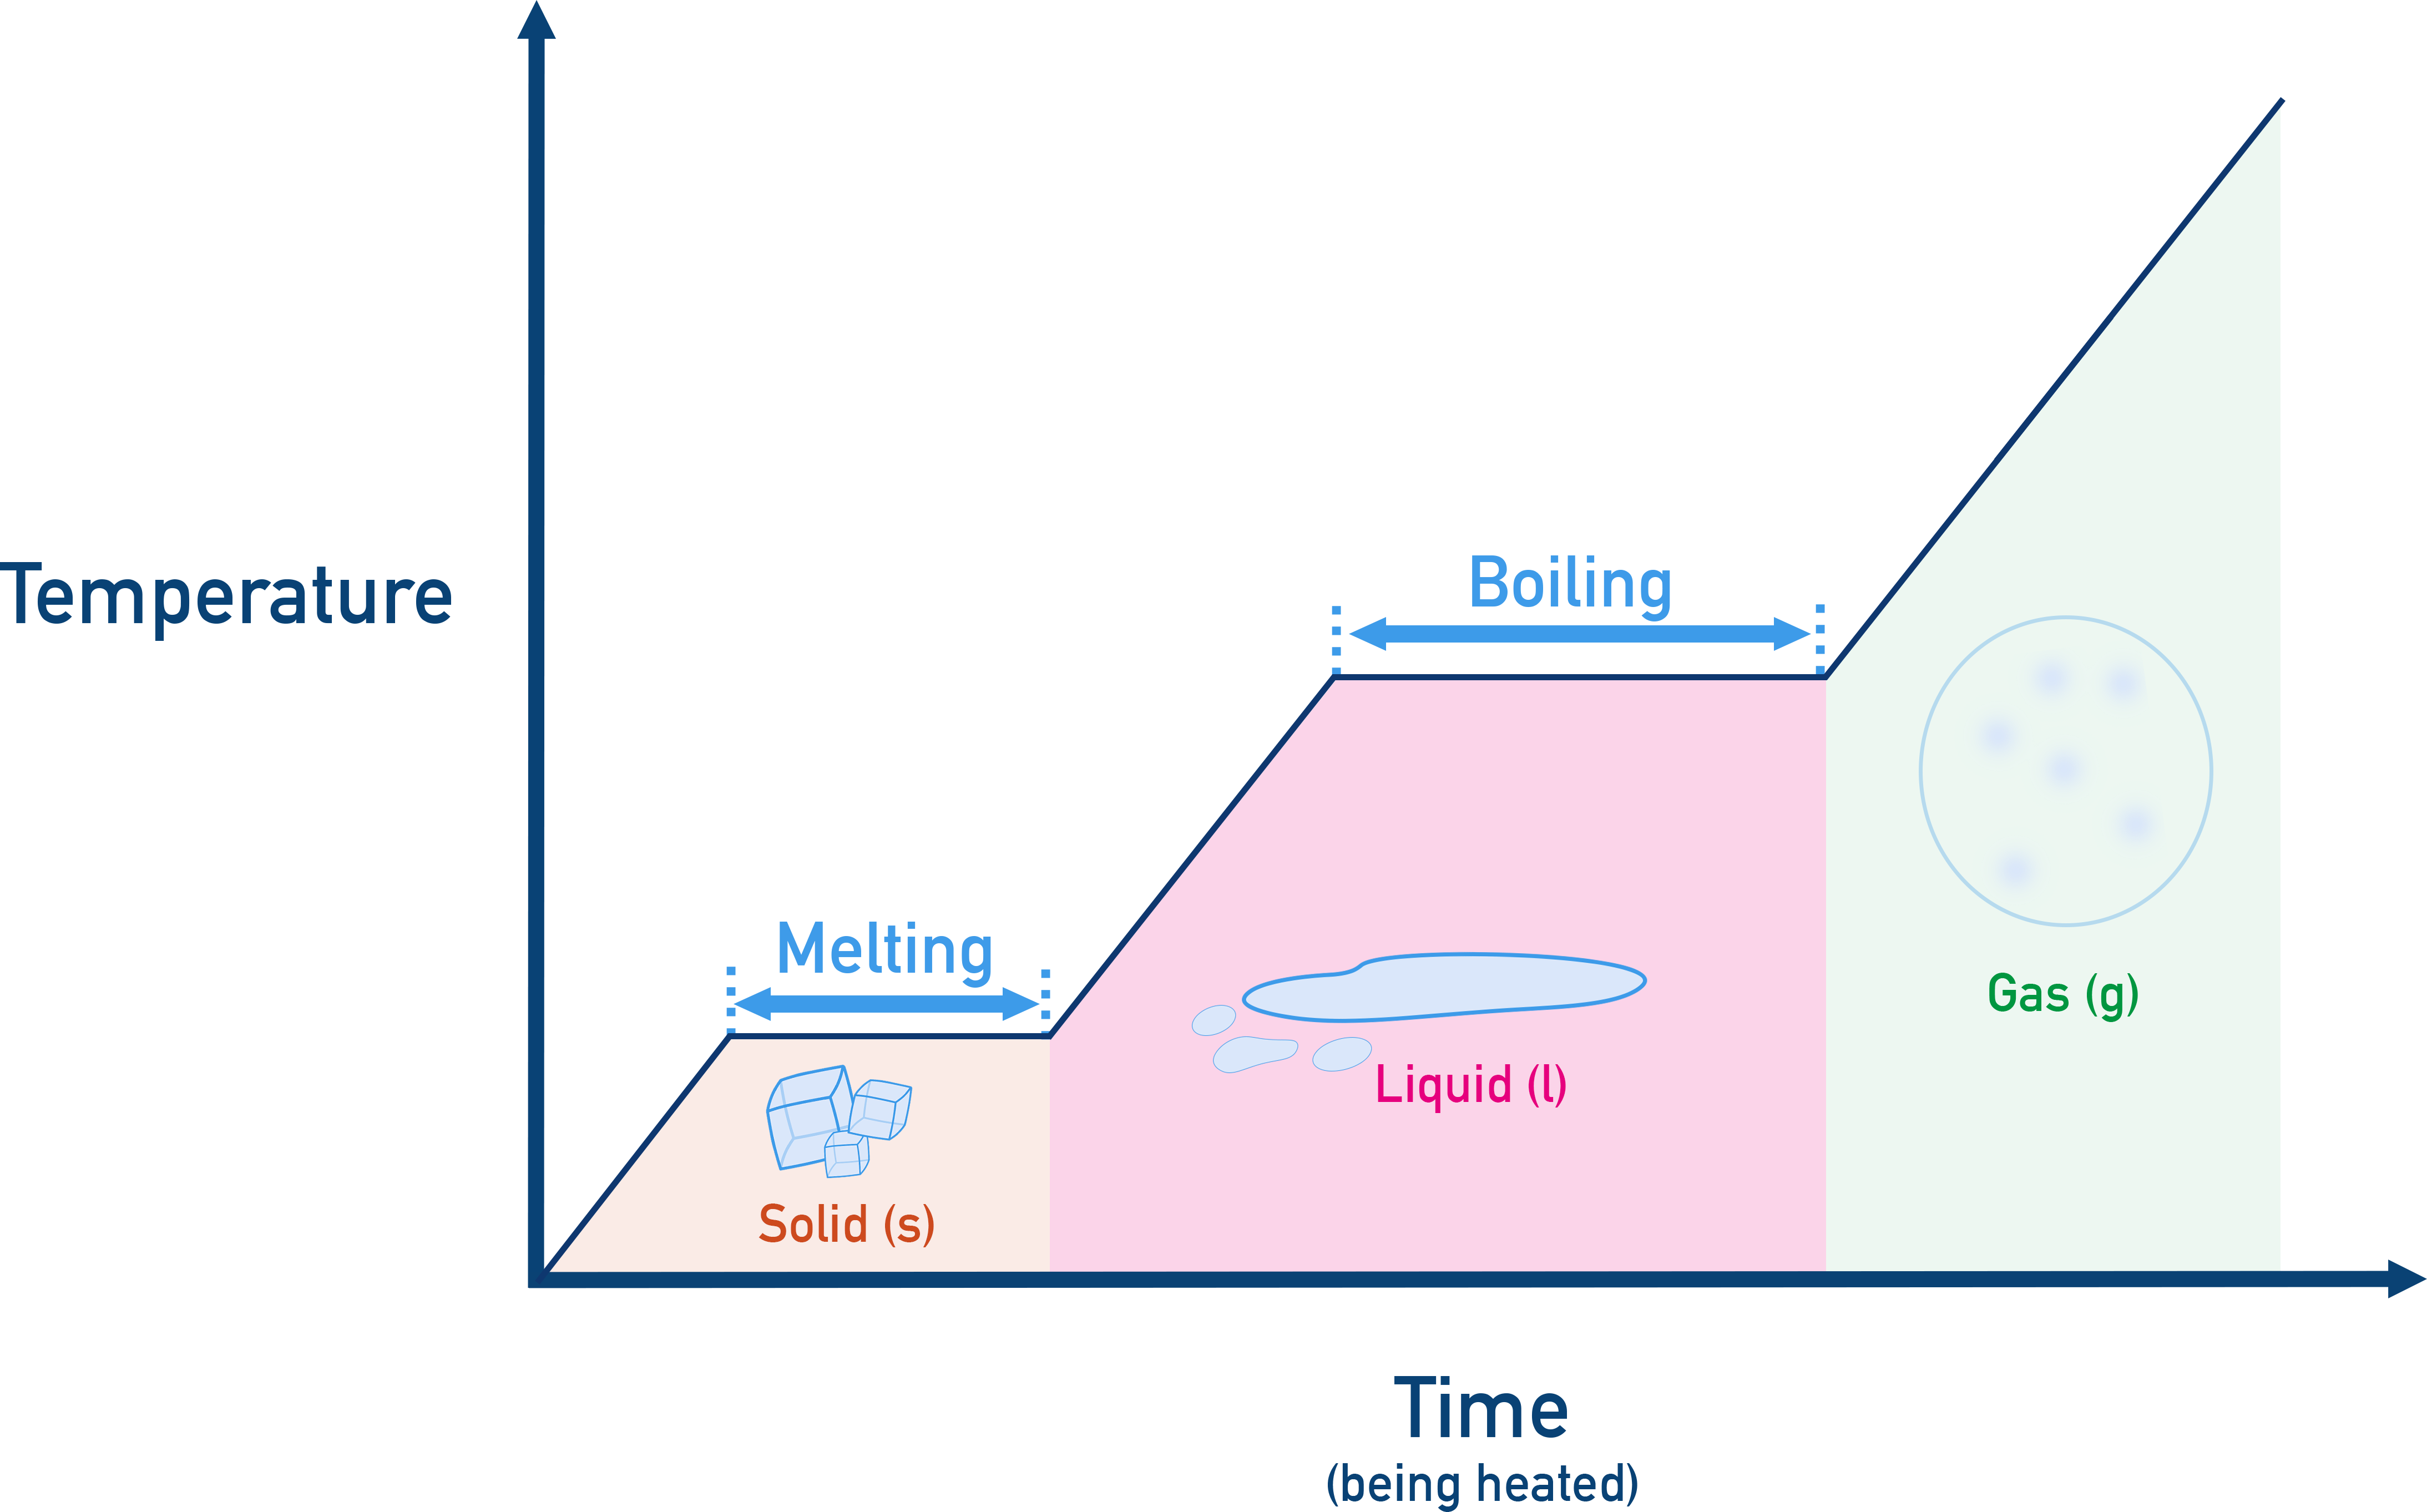
Heating and cooling curves show flat portions (plateaus) that represent phase changes. During these intervals, all energy transfer is involved in breaking or forming intermolecular forces — not changing temperature.
ExampleIf we plot temperature over time while heating ice we can see two flat lines or plateaus where the temperature doesn’t change – these represent the phase changes of melting and boiling.
Calculating Heat for Phase Changes
We can use the number of moles and the appropriate molar enthalpy value to calculate heat transfer during phase changes:
- q = nΔHfus for melting or freezing
- q = nΔHvap for boiling or condensing
Where:
- q is the heat absorbed (+) or released (−) in joules (J)
- n is the amount in moles
- ΔHfus is the molar enthalpy of fusion (J/mol)
- ΔHvap is the molar enthalpy of vaporization (J/mol)
These ΔH values are typically provided and found in data tables.
Direction Matters!
The sign of q depends on the direction of the phase change:
- Melting and vaporization: q is positive (energy in)
- Freezing and condensation: q is negative (energy out)
Also:
- ΔHcondensation = −ΔHvaporization
- ΔHfreezing = −ΔHfusion
This reflects the fact that energy changes are equal and opposite for complementary processes.
Summary
- Phase changes involve energy transfer whilst temperature stays constant
- The amount of energy (q) absorbed or released is proportional to the number of moles and the molar enthalpy of the phase transition.
- Melting and vaporization are endothermic, while freezing and condensation are exothermic. Complementary phase changes involve energy changes that are equal in magnitude and opposite in sign.