
Acid-Base Titrations
Quick Notes
- A titration is used to determine the concentration of an unknown acid or base.
- At the equivalence point, moles of acid = moles of base (for monoprotic acids and monobasic bases).
- For weak acid/strong base or weak base/strong acid titrations:
- Use the half-equivalence point to find pKa or pKb.
- The shape of the titration curve depends on the strength of the acid and base.
- Polyprotic acids have multiple equivalence points on the titration curve.
Full Notes
An acid–base titration is a quantitative technique used to determine the concentration of an unknown acid or base (the analyte) by gradually adding a solution of known concentration (the titrant) until they have reacted completely.
Equivalence Point
The equivalence point is the volume of titrant needed to completely react with the analyte — no original acid or base remains, only the salt formed.
For monoprotic acids, moles of acid = moles of base.
Titration Curves
A titration curve plots pH vs. volume of titrant added.
Key Features
- Initial pH: shown by the intercept with y-axis.
- Steep region: indicates rapid change in pH near the equivalence point.
- Equivalence point: center of the steep region; where the moles of acid in the original solution are completely reacted with added base. Only salt + water is present.
- Final pH: reflects strength and excess of the base.
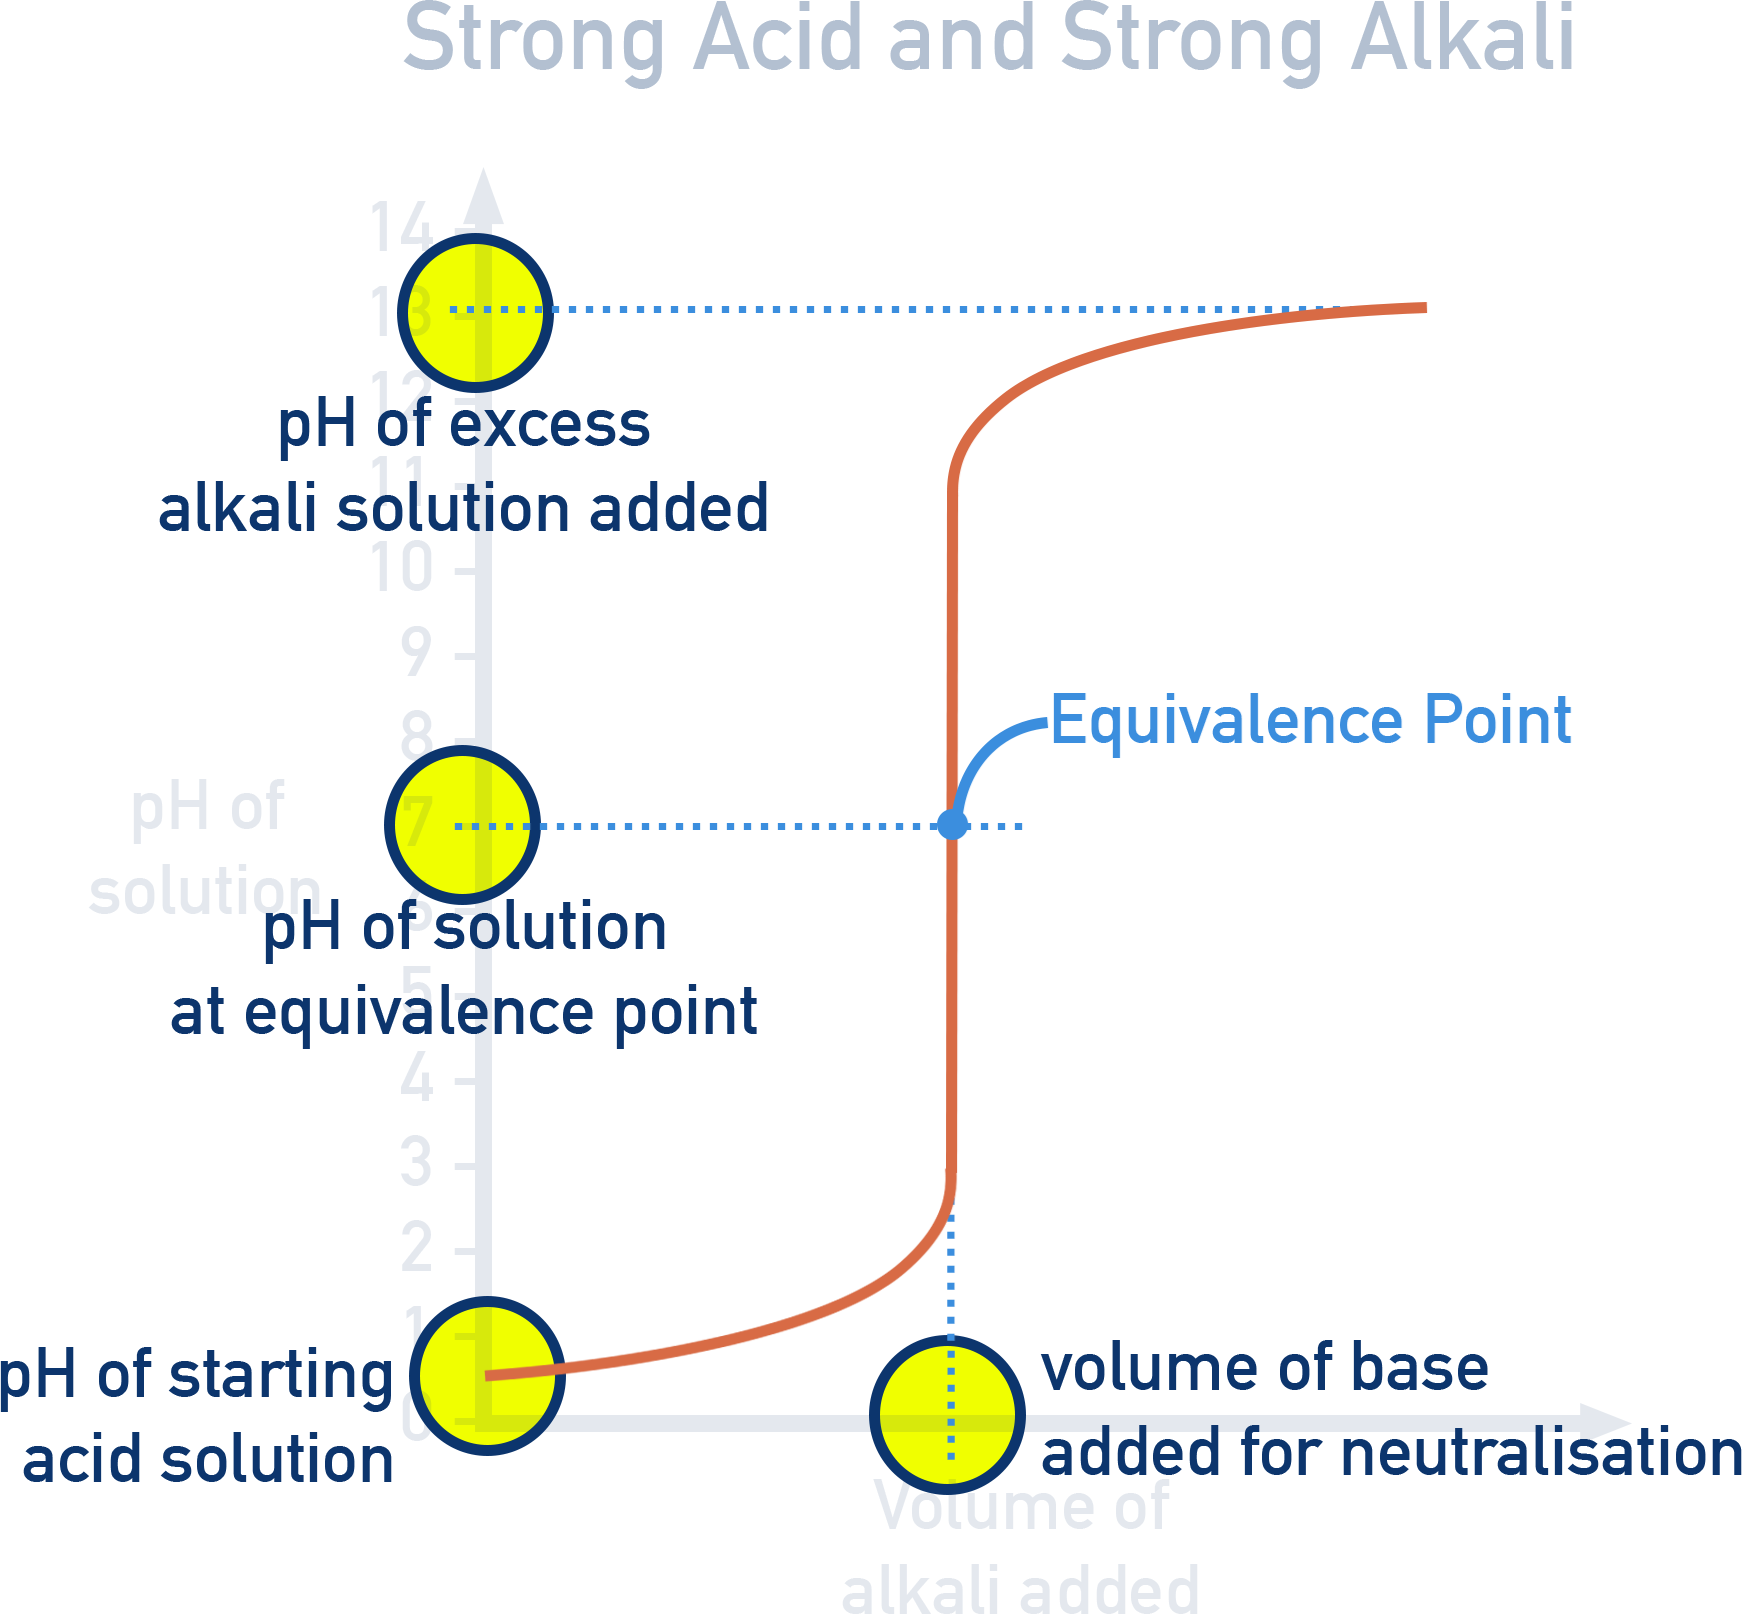
Strong Acid + Strong Base
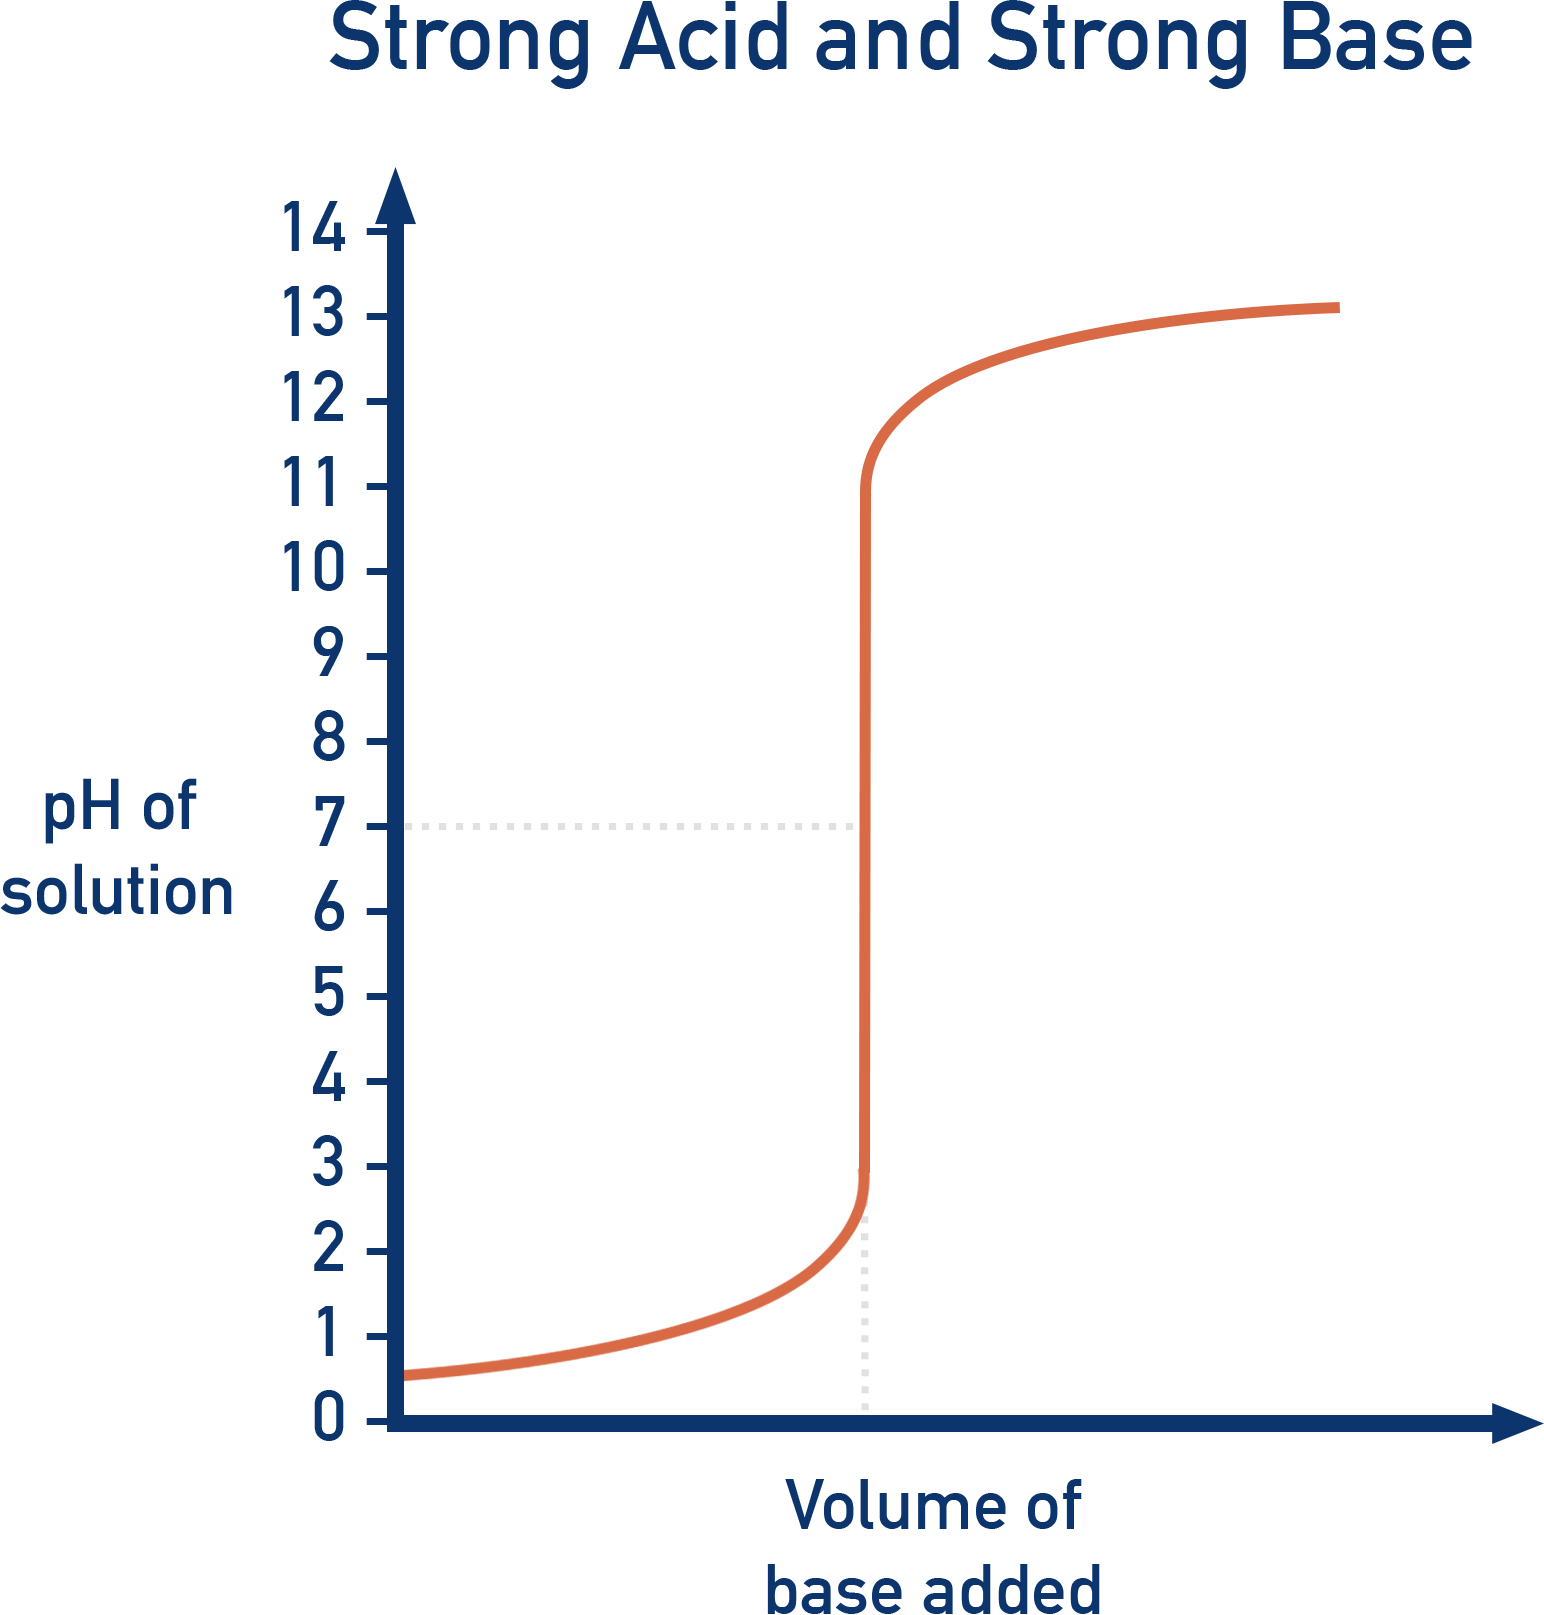
Example: HCl titrated with NaOH
Net ionic equation: H+(aq) + OH−(aq) → H2O(l)
Key Features:
- Initial pH: Low (strong acid).
- Steep rise near equivalence (around pH 7).
- Equivalence point: Neutral salt formed; pH ≈ 7.
- Final pH: High (strong base excess).
Weak Acid + Strong Base
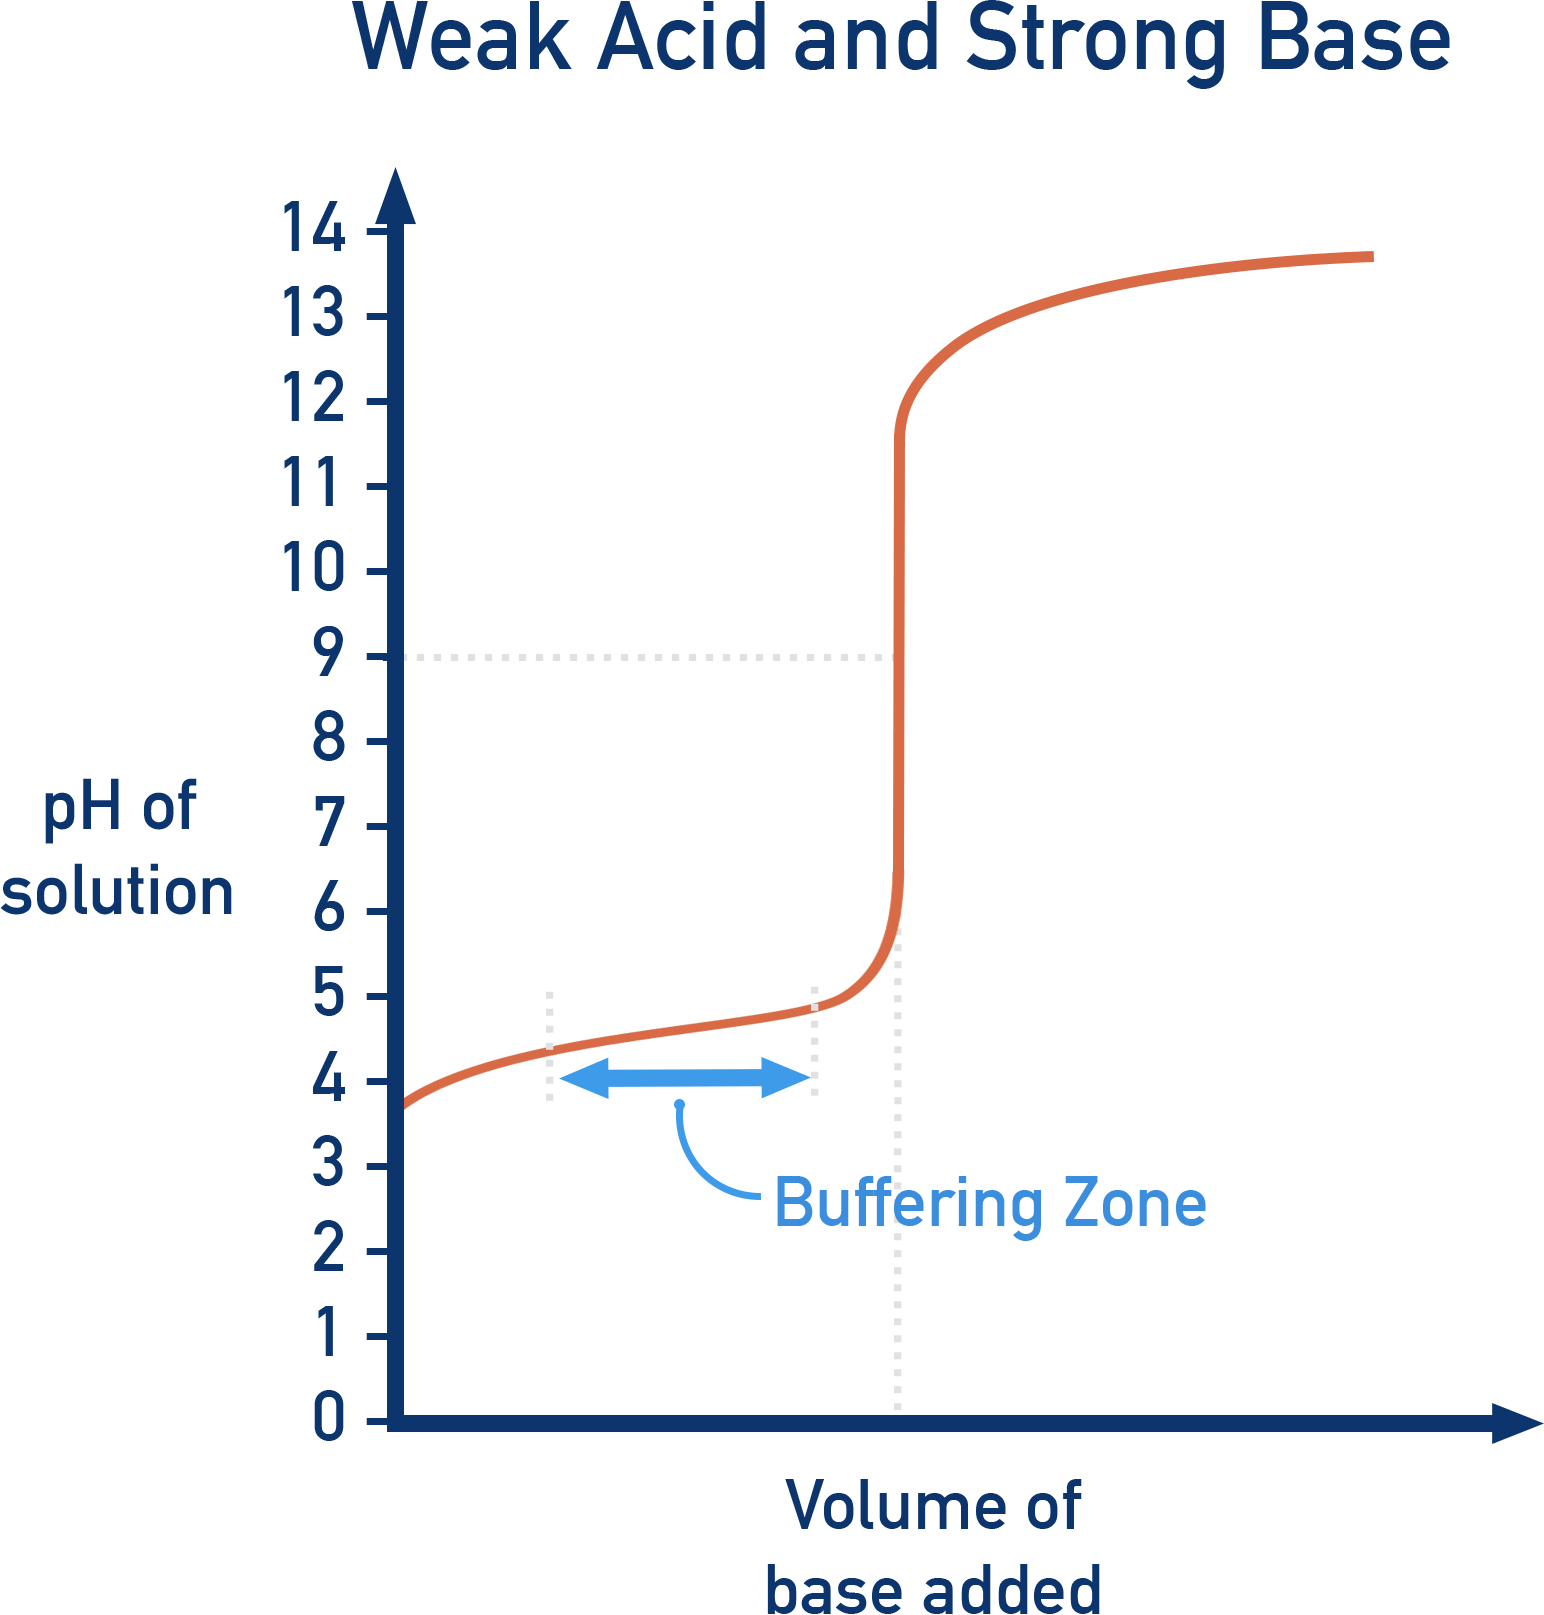
Example: CH3COOH titrated with NaOH
Key Features:
- Initial pH: Higher than strong acid (weaker H+ source).
- Gradual rise due to buffer region.
- Half-equivalence point: [HA] = [A−]; pH = pKa.
- Equivalence point: Basic salt formed; pH > 7.
- Final pH: Higher due to excess base.
Weak Base + Strong Acid
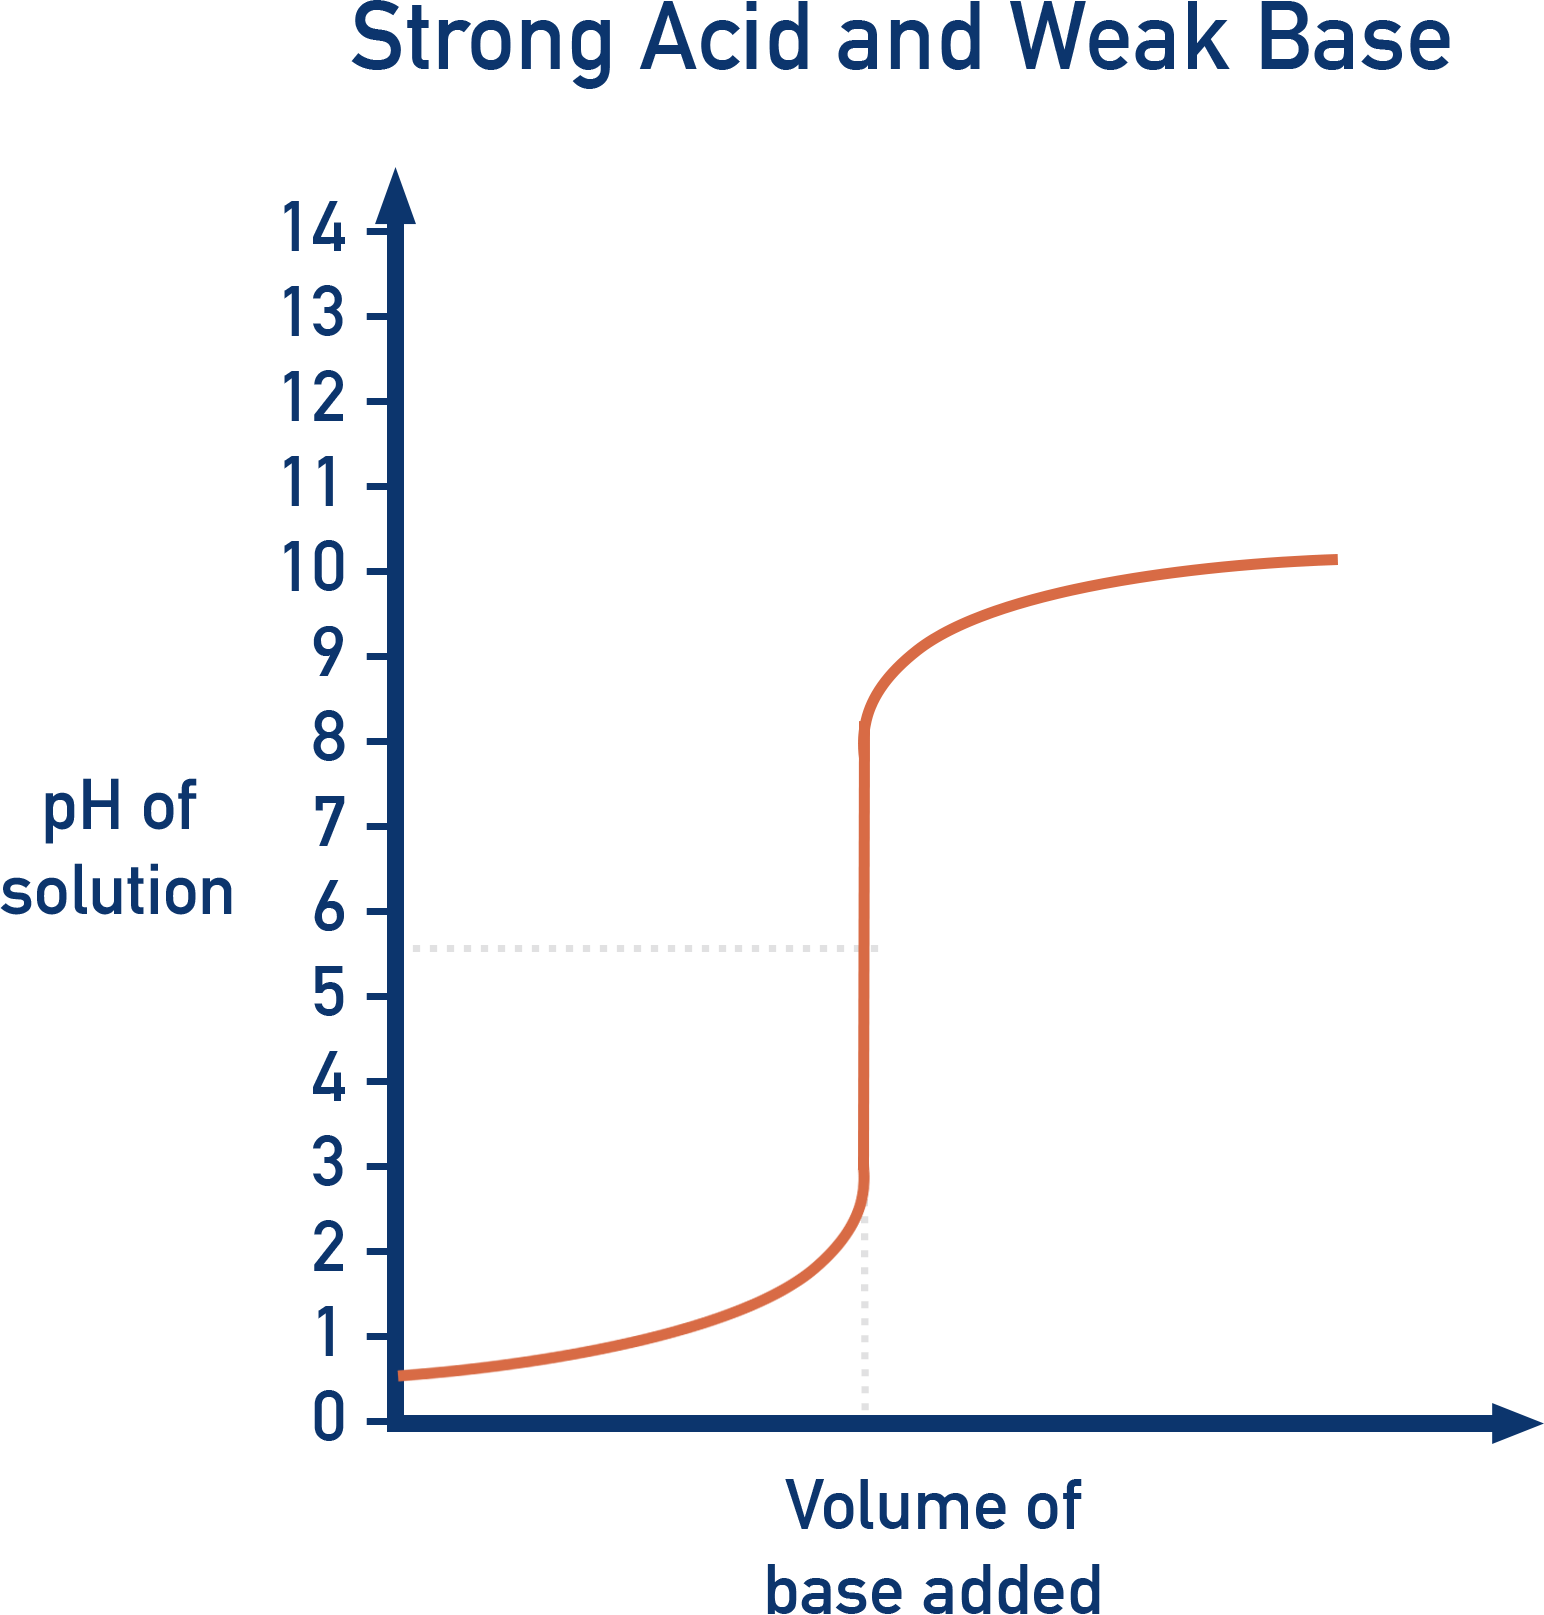
Example: HCl titrated with NH3
Key Features:
- Mirror image of weak acid titration.
- Equivalence point: pH < 7 (acidic salt).
Weak Acid + Weak Base
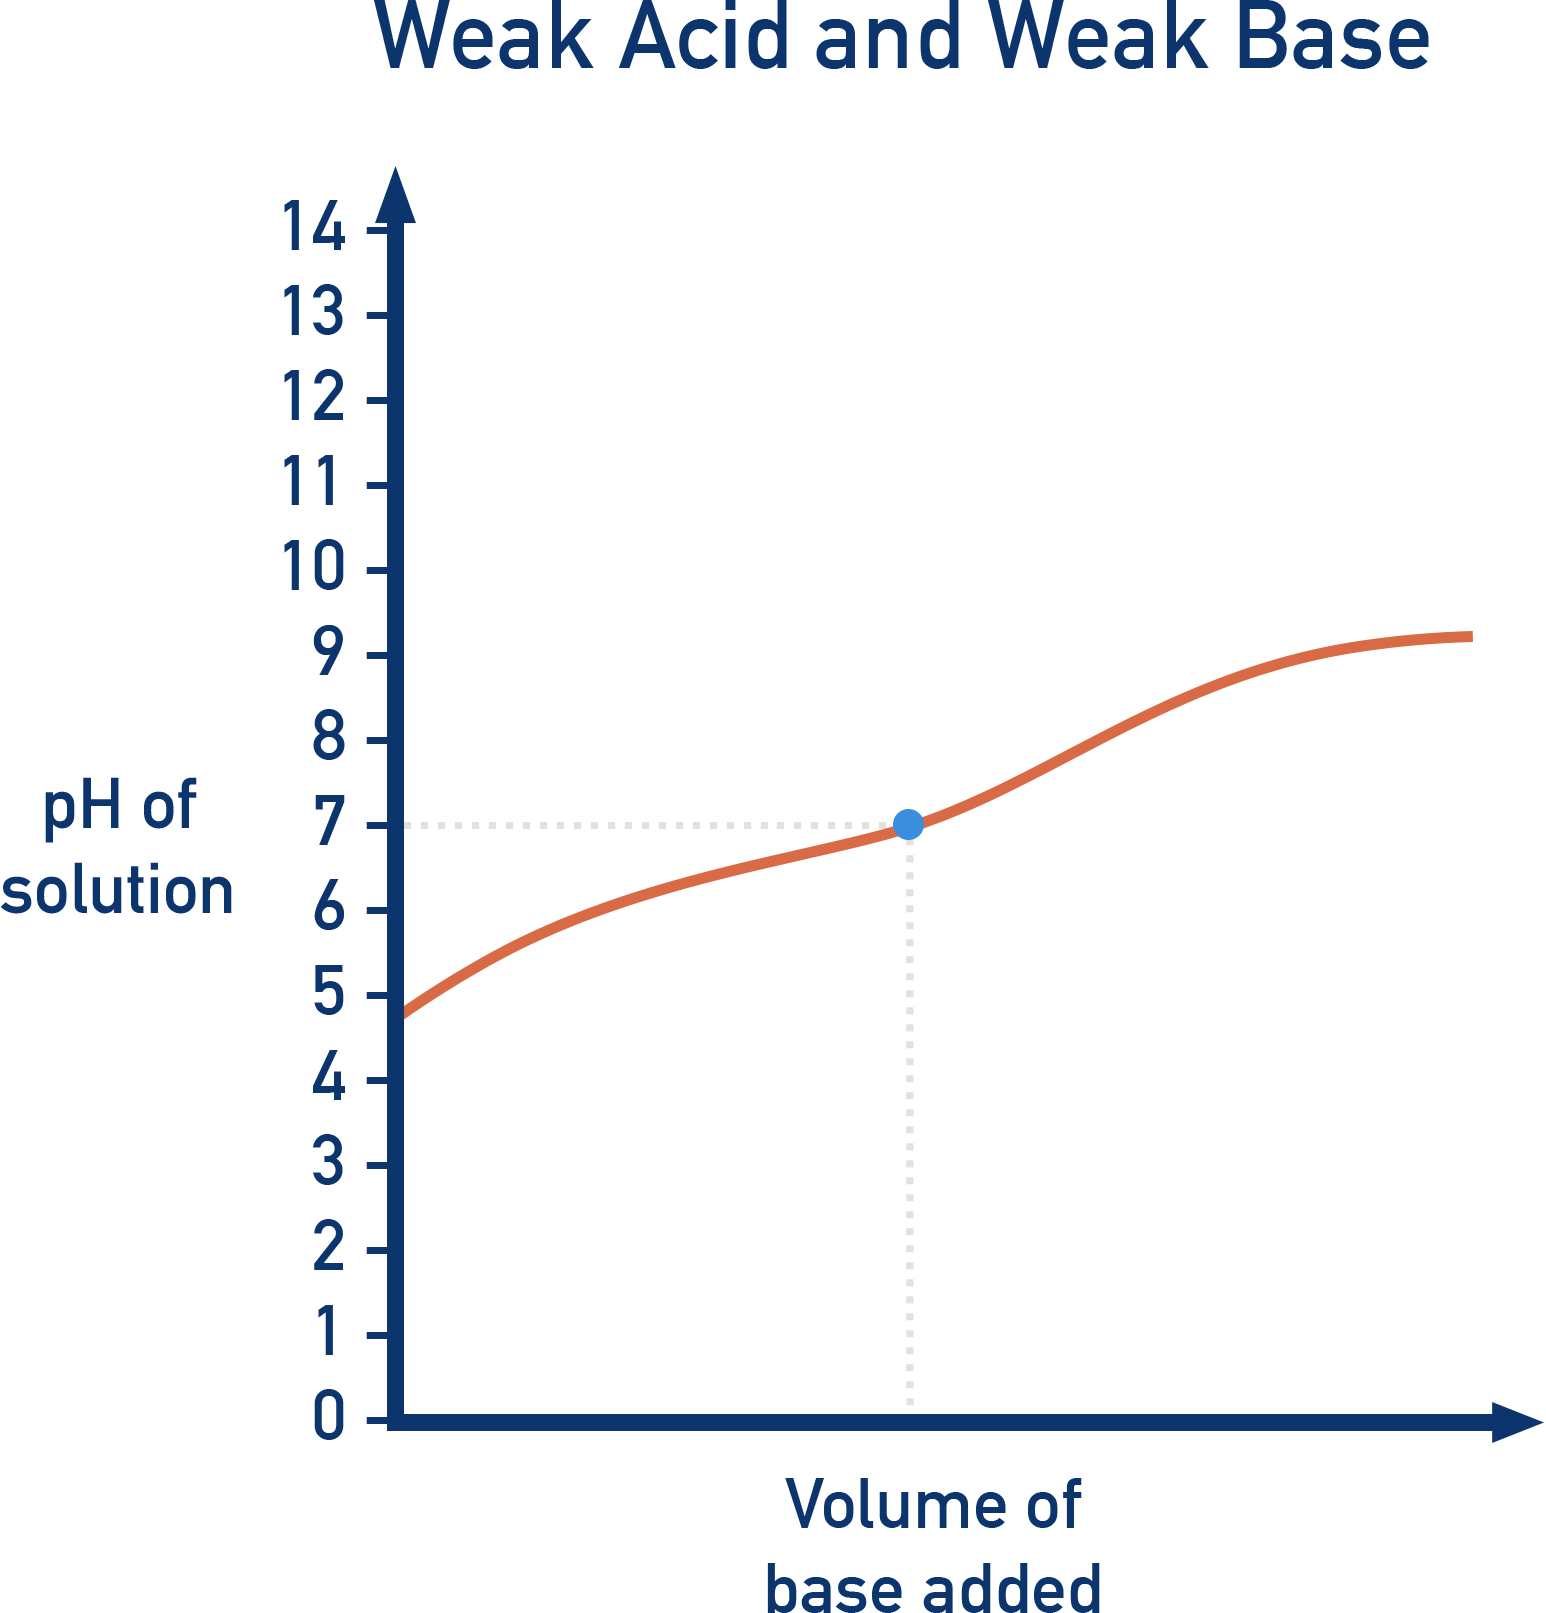
Example: CH3COOH titrated with NH3
Key Features:
- Reaction does not go to completion.
- Curve shows a more gradual rise, with no sharp jump.
- Equivalence point pH: Depends on relative Ka and Kb.
Polyprotic Acids
Polyprotic acids are able to donate more than one H+ ion in reactions. This means there are multiple equivalence points in their pH curves, one per proton.
Each steep region reflects one H+ neutralization.
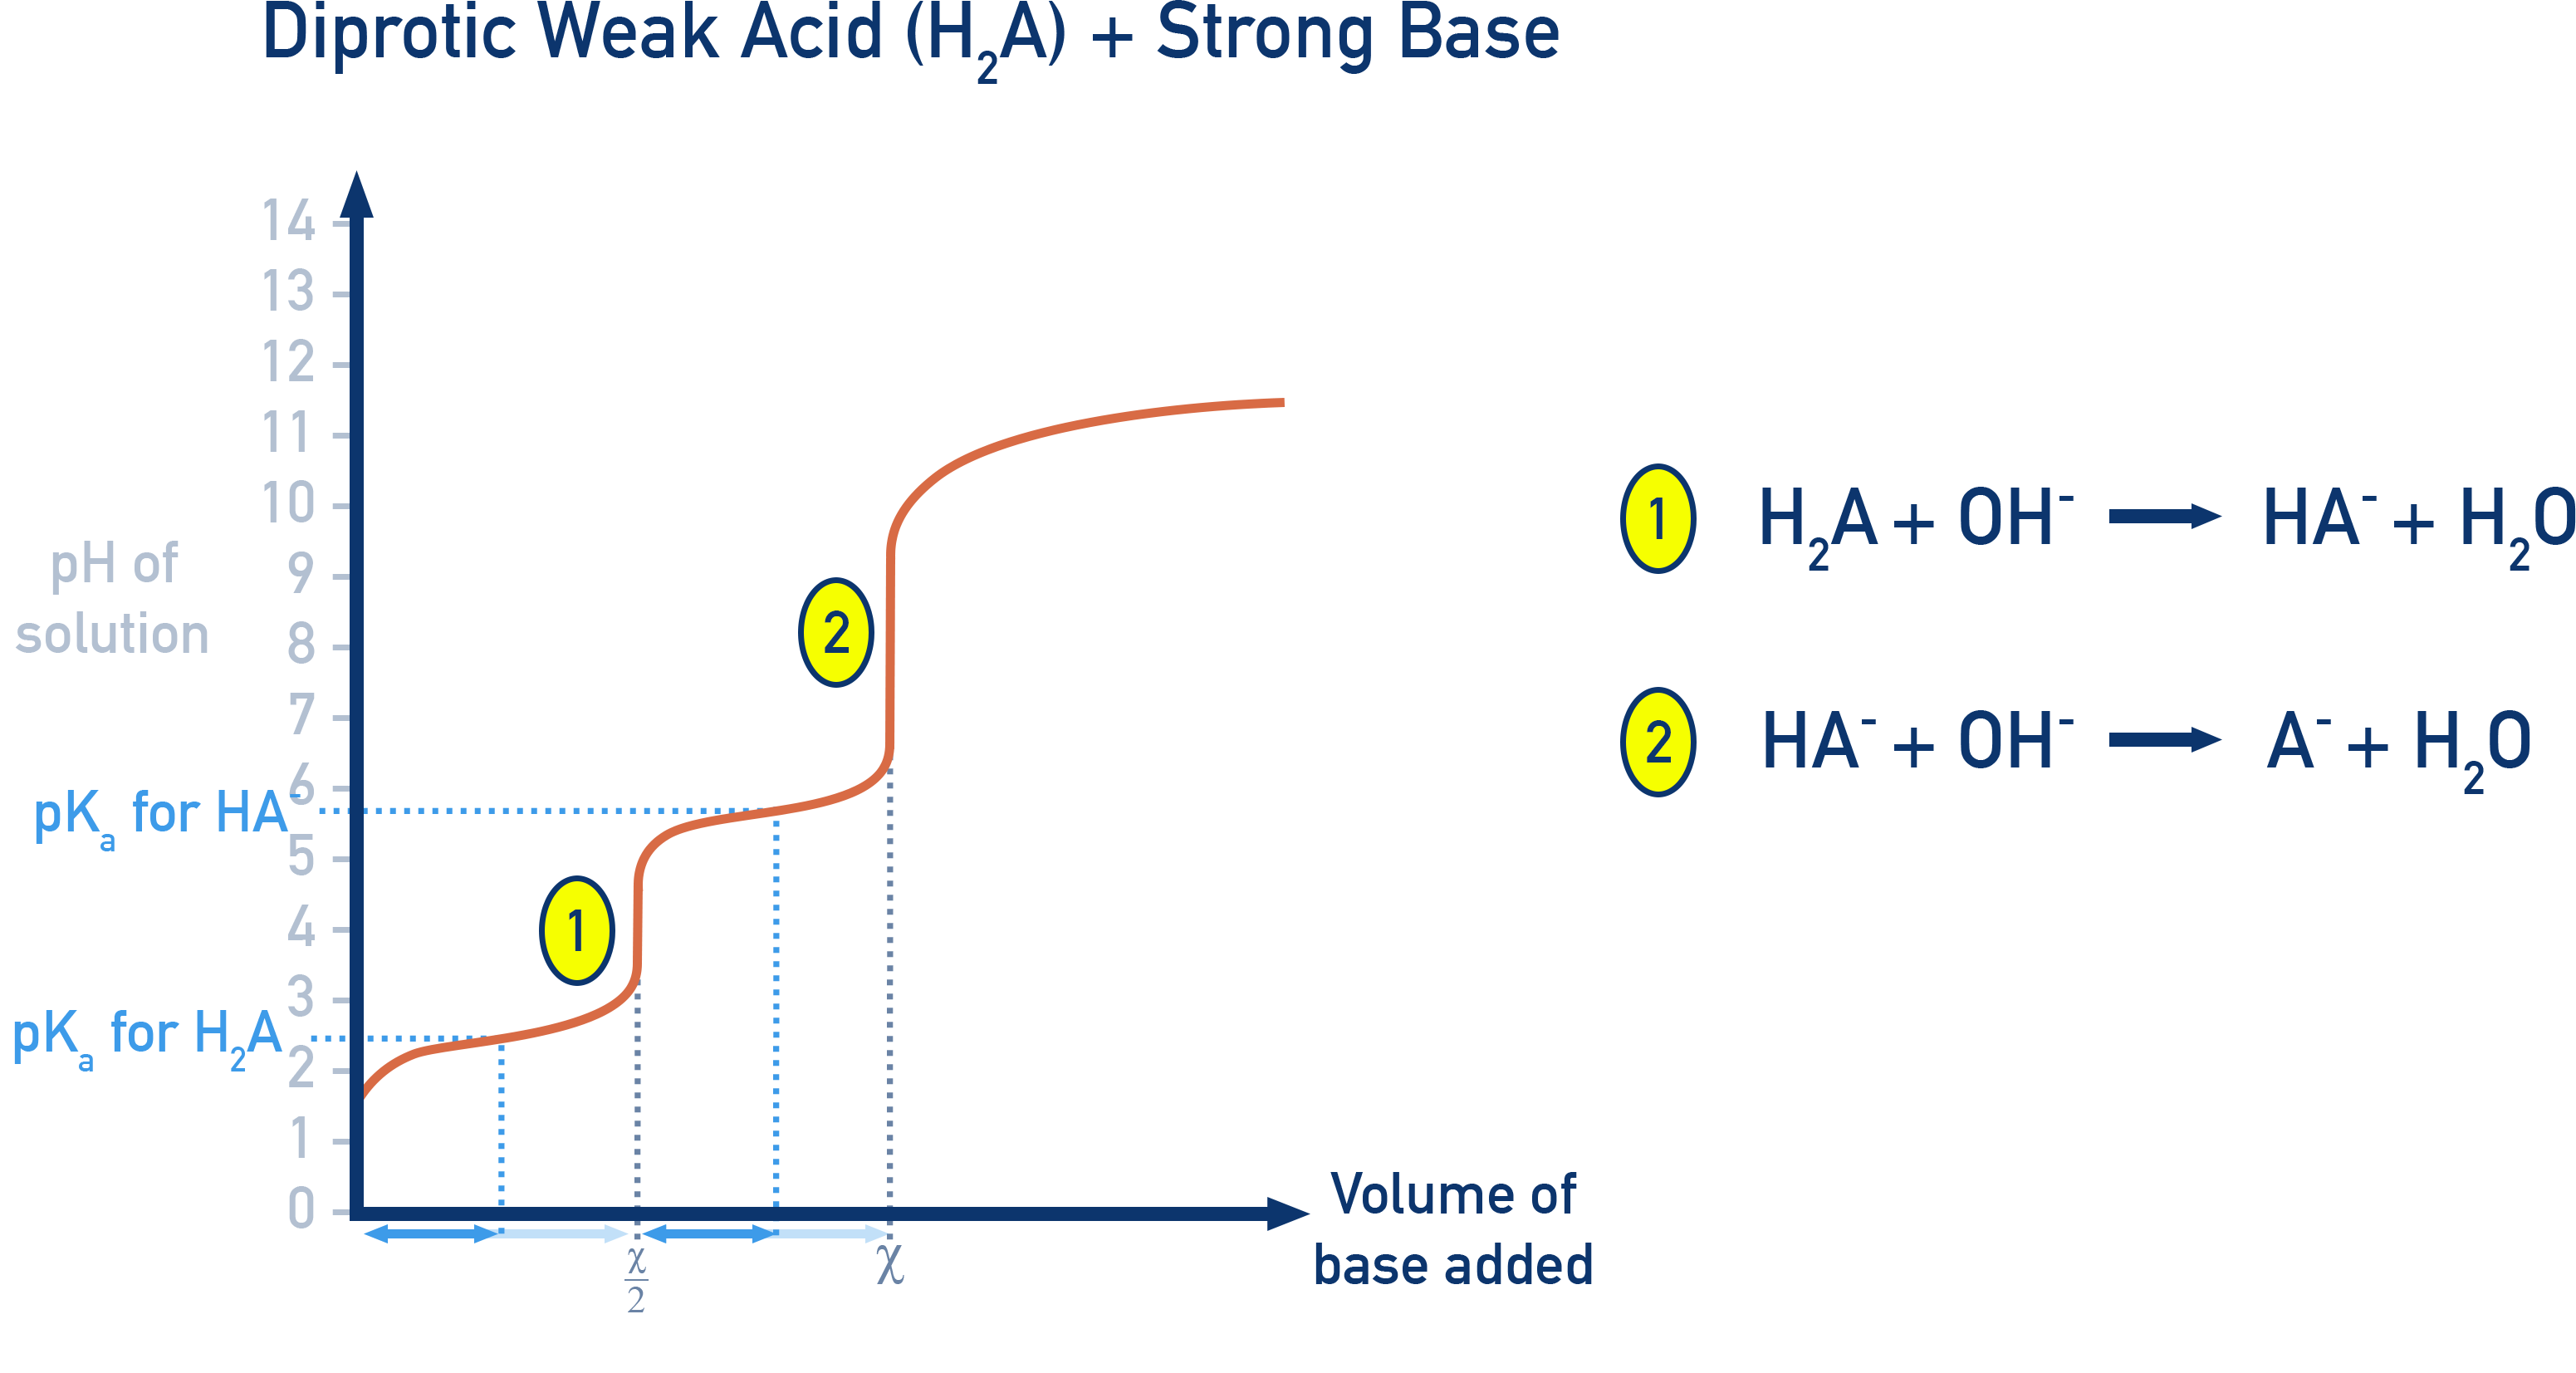
For example: a pH curve for a strong base against a diprotic weak acid (H2A) has two sharp sections, one for each equivalence point.
pKa values can be estimated from half-equivalence points between each stage.
Equivalence Point vs. End Point
Equivalence Point: Stoichiometric point where acid and base are present in exact mole ratio.
End Point: The point at which an indicator changes color, signalling that no more titrant should be added to the analyte.
A well-chosen indicator changes color as close to the equivalence point as possible.

Equivalence point and end point are not the same — but they should be as close as possible for an accurate titration. Choose indicators whose transition pH matches the expected pH at equivalence.
Choosing an Indicator
Choose an indicator whose pH range matches the pH at the equivalence point:
| Titration Type | pH at Equivalence | Suitable Indicator |
|---|---|---|
| Strong Acid + Strong Base | ≈ 7 | Phenolphthalein, Methyl orange |
| Weak Acid + Strong Base | > 7 (basic salt) | Phenolphthalein |
| Strong Acid + Weak Base | < 7 (acidic salt) | Methyl orange |
| Weak Acid + Weak Base | Variable (~5–9) | No clear indicator; use pH meter |
Determining Ka using a titration curve
The Ka of a weak acid can be found from its titration curve with a strong base (e.g. NaOH).
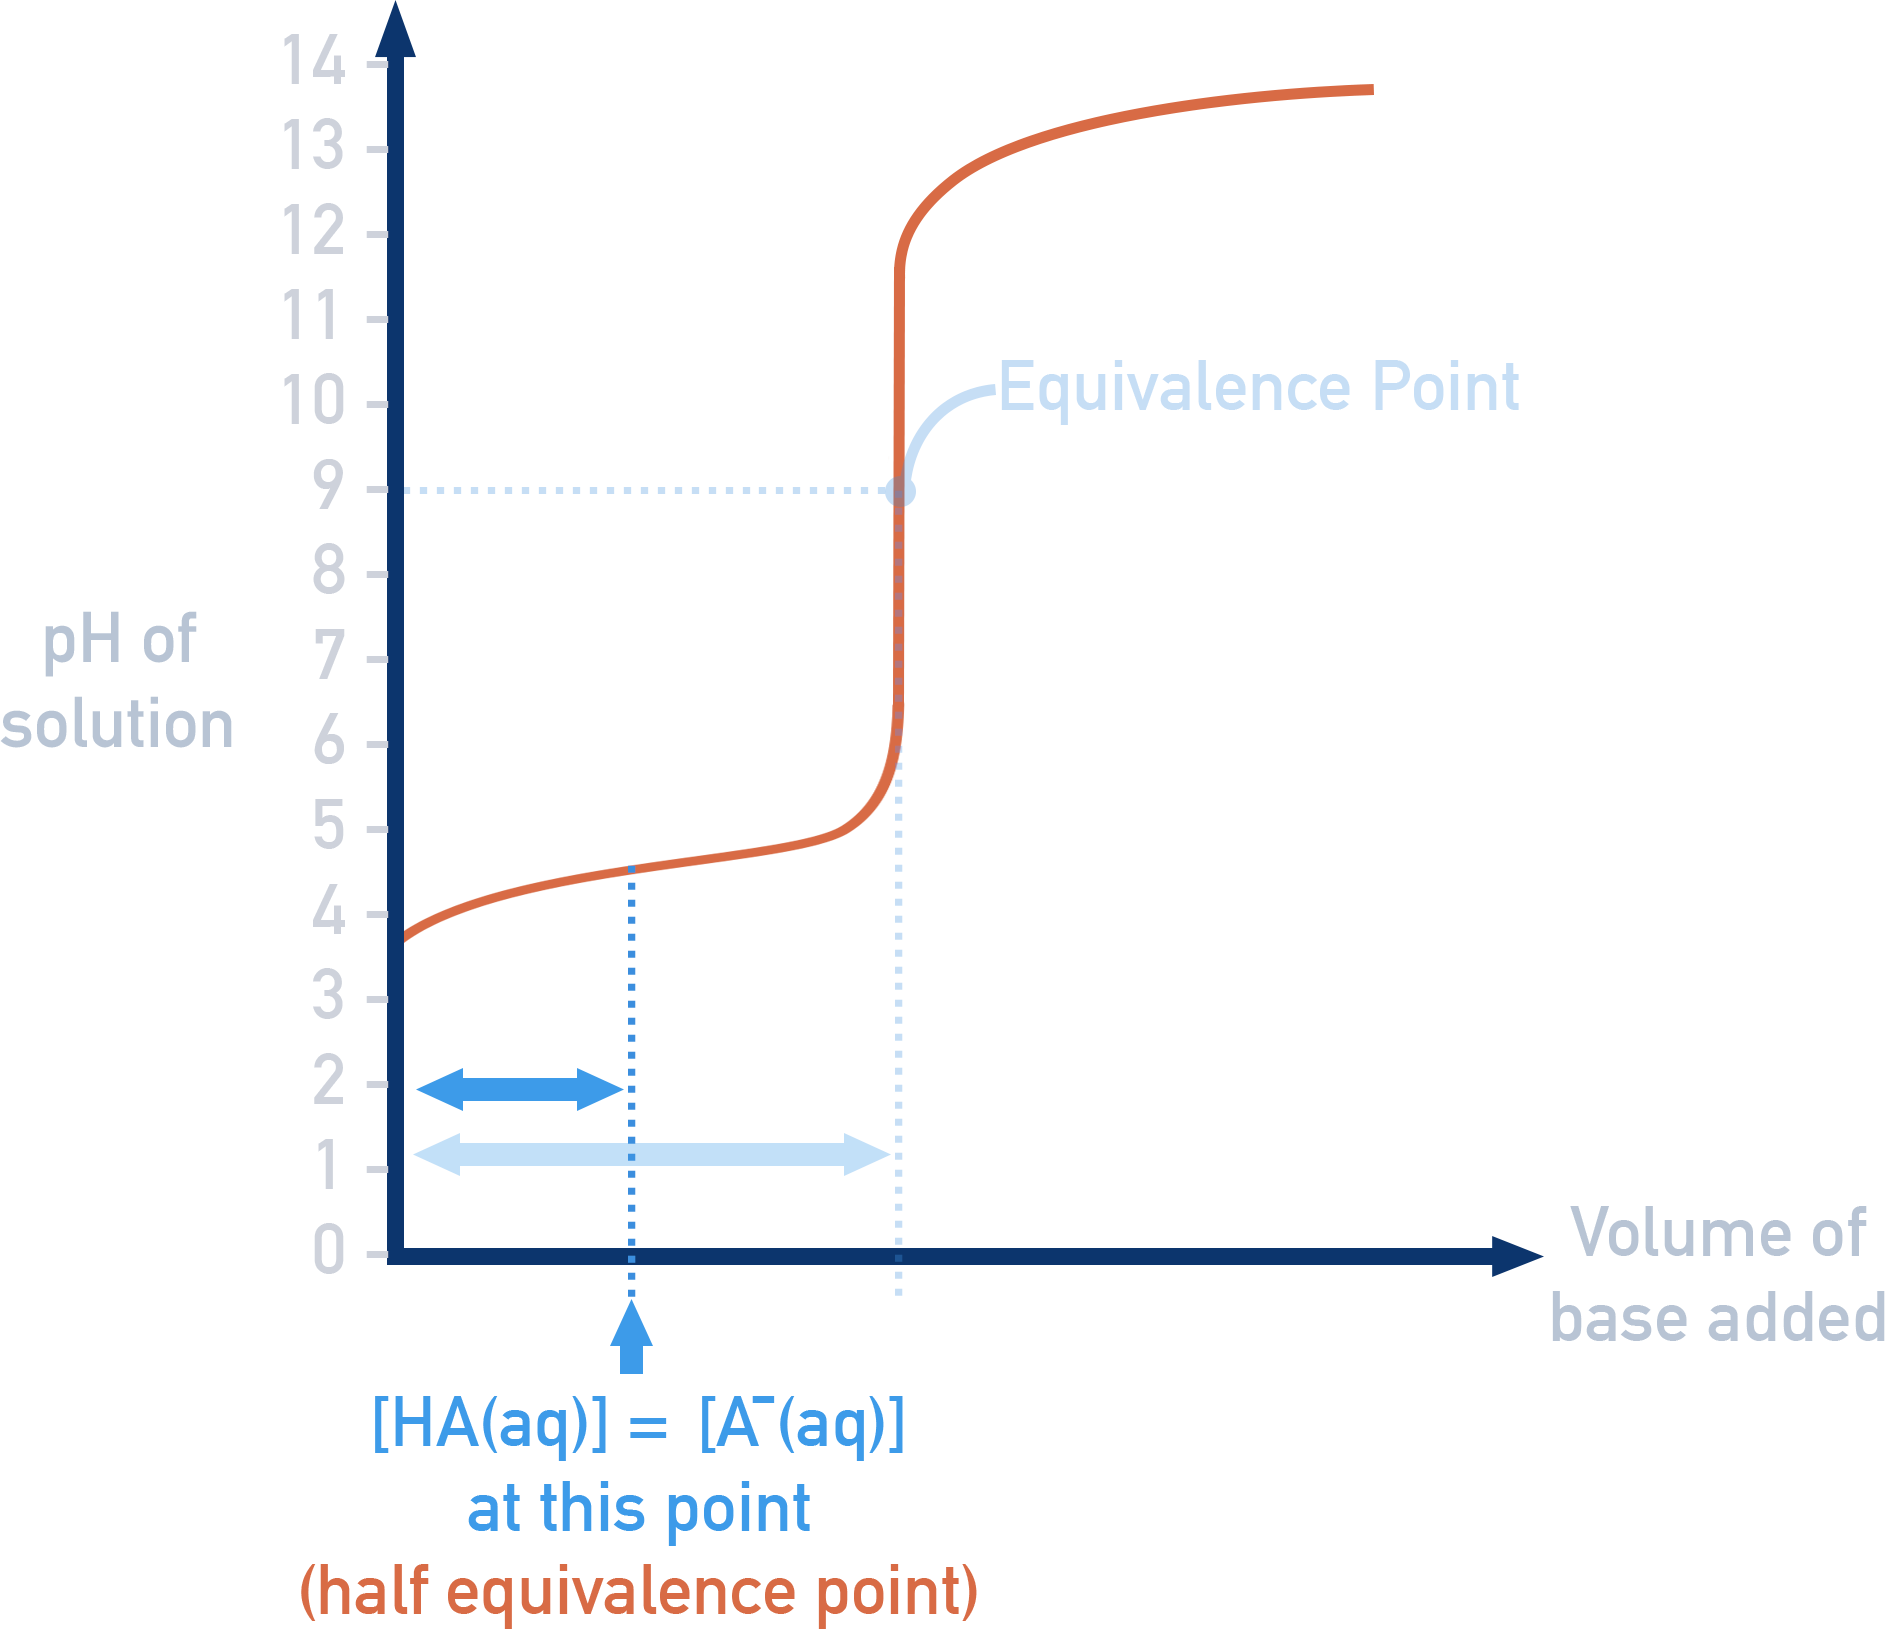
At the half-equivalence point, half of the acid has been neutralised, so:
[HA] = [A−]
At this point, the Ka expression simplifies to: Ka = [H+]
![AP Chemistry derivation showing Ka simplifies to [H+] at half-equivalence.](images/katitration.png)
So: Ka = 10−pH and pKa = pH
This makes the half-equivalence point a useful way to determine Ka or pKa directly from a titration curve.
Practical Titration Example: NaHCO3 with HCl
Reaction: NaHCO3(aq) + HCl(aq) → NaCl(aq) + CO2(g) + H2O(l)
Procedure Summary:
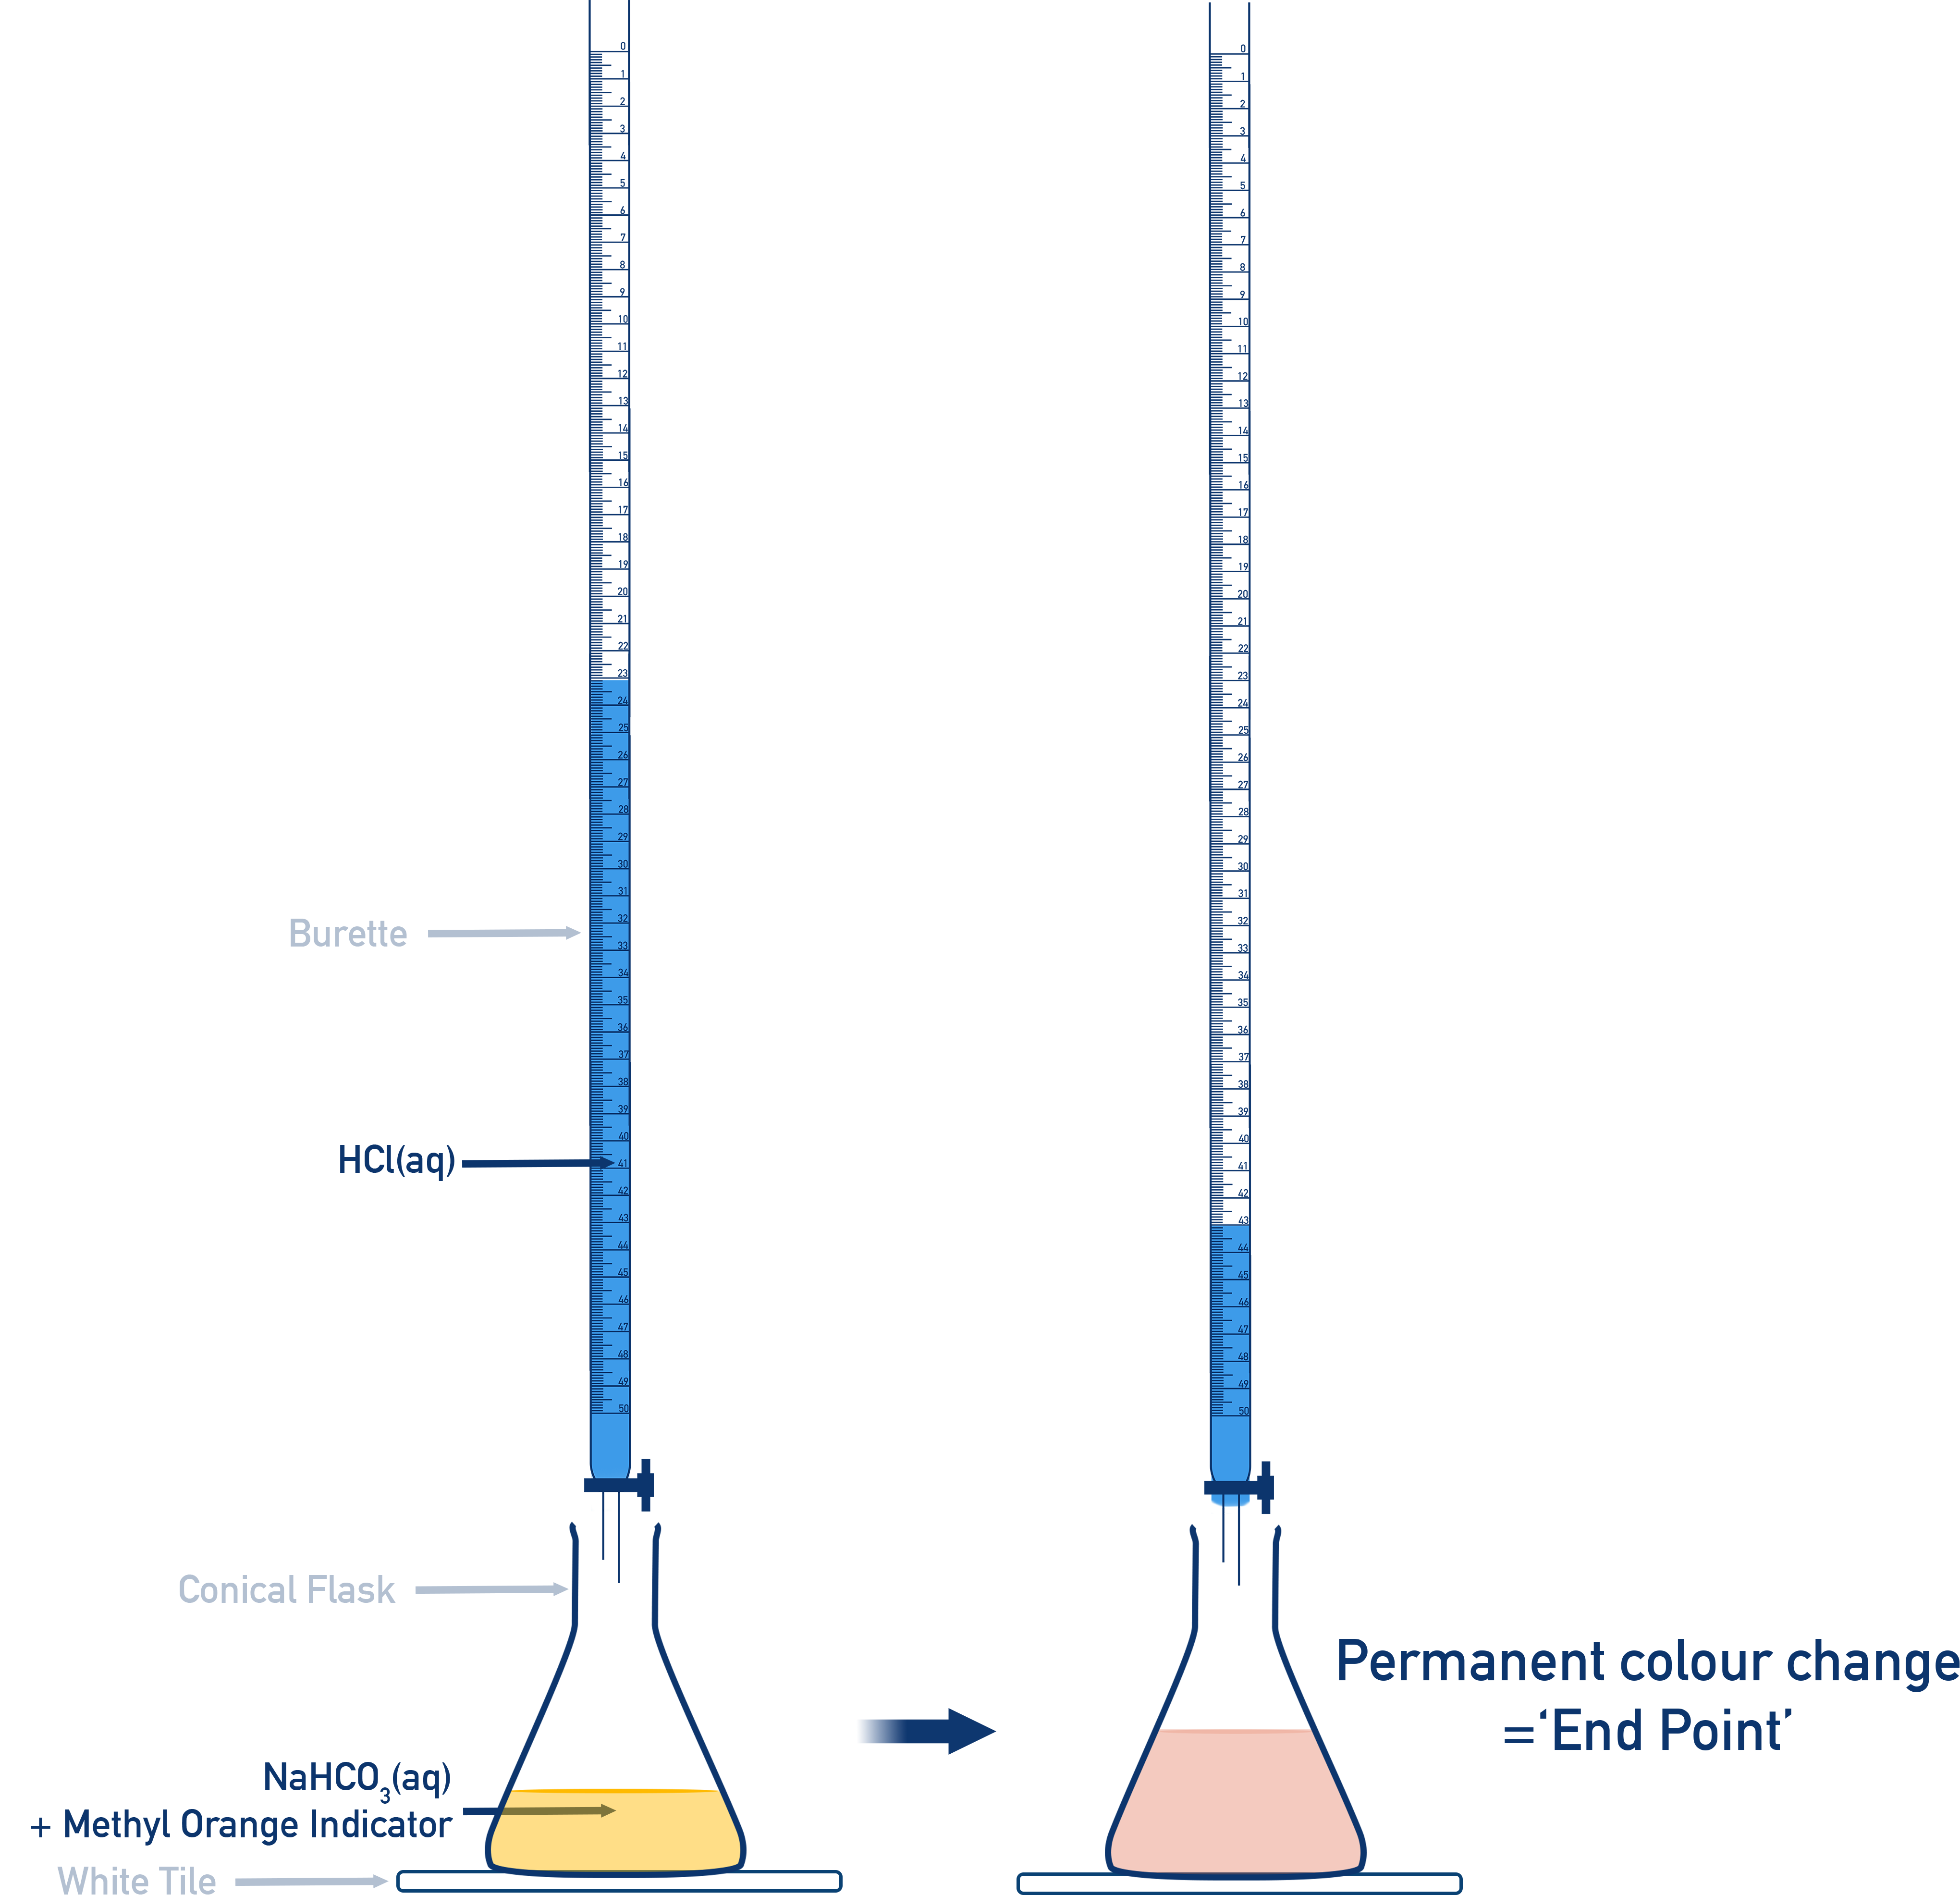
- Place conical flask containing known volume of NaHCO3(aq) solution and methyl orange indicator on a white tile.
- Rough titration first — titrate by adding HCl from the burette while swirling. Add until colour changes from yellow to red.
- Now repeat, however adding HCl dropwise when near rough titration end point, until permanent colour change from yellow to red.
- Record final burette reading and calculate titre.
- Repeat until you have two concordant results within 0.1 cm3.
Worked Example
Equation: NaHCO3(aq) + HCl(aq) → NaCl(aq) + CO2(g) + H2O(l)
Average HCl titre = 24.50 cm3 Mass of NaHCO3 used = 2.10 g
Determine the concentration of HCl solution.
- Step 1: Calculate moles of NaHCO3 in 250.0 cm3
Molar mass of NaHCO3 = 84.0 g mol−1
Moles = 2.10 g ÷ 84.0 g mol−1 = 0.02500 mol - Step 2: Calculate concentration of NaHCO3
Volume = 250.0 cm3 = 0.2500 dm3
Concentration = 0.02500 mol ÷ 0.2500 dm3 = 0.100 mol dm−3 - Step 3: Calculate moles of NaHCO3 in 25.0 cm3 sample
Volume = 25.0 cm3 = 0.0250 dm3
Moles = 0.100 mol dm−3 × 0.0250 dm3 = 2.50 × 10⁻³ mol - Step 4: Moles of HCl (1:1 ratio with NaHCO3)
Moles of HCl = 2.50 × 10⁻³ mol - Step 5: Use the average titre to find concentration
Average titre = 24.50 cm3 = 0.02450 dm3
Concentration = moles ÷ volume = 2.50 × 10⁻³ mol ÷ 0.02450 dm3
= 0.102 mol dm−3
Summary
- Equivalence point: where moles acid = moles base (for monoprotic acids and monobasic bases).
- Strong acid/base titrations → neutral at equivalence.
- Weak acid/base titrations → acidic or basic at equivalence depending on conjugate species.
- Half-equivalence point: [HA] = [A−], so pH = pKa.
- Polyprotic acids have multiple buffer zones and equivalence points.