
Representations of Solutions
Quick Notes
- Particulate models use diagrams to show how solute and solvent particles are arranged and interact in a solution.
- Solvent particles surround and interact with solute particles (e.g., ion-dipole interactions)
- The relative number of solute and solvent particles in a diagram represents the concentration of the solution.
- In ionic solutions, dissociation is shown by separated ions, not formula units.
Full Notes
What Are Particulate Representations?
Particulate diagrams (or particle-level models) are visual representations that can be used to show how the individual components of a solution are distributed and interact at the molecular level.
Representing Solutions — Concentration
The number of solute particles shown in a diagram should reflect the concentration:
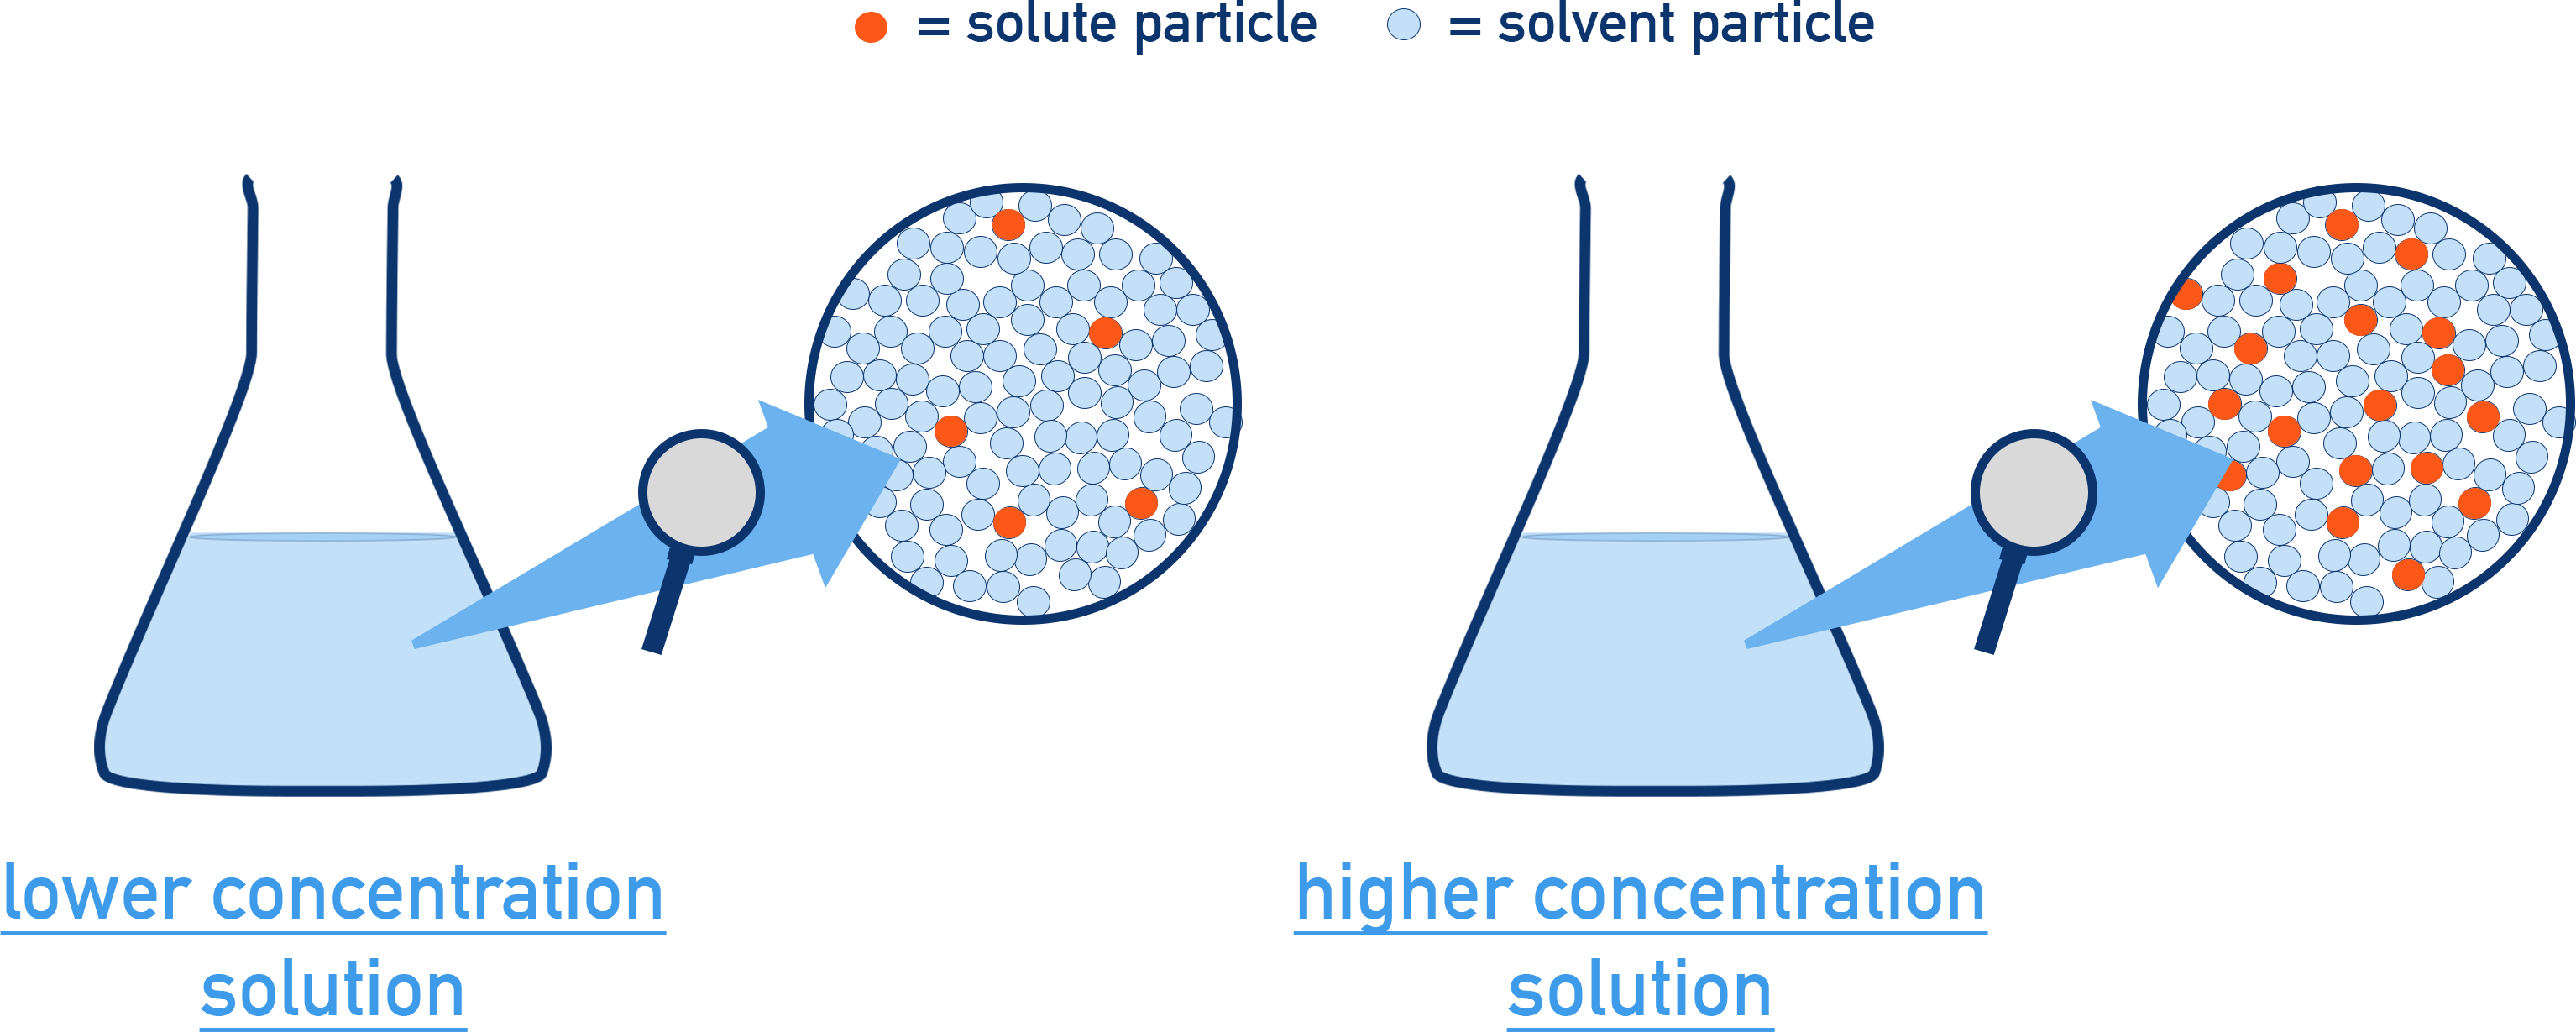
- Higher concentration = more solute particles per volume
- Lower concentration = fewer solute particles per volume
If comparing two solutions side-by-side, the same volume should contain different numbers of solute particles to reflect concentration differences.
Dissociation
Ionic compounds (e.g., NaCl) dissolve into separate ions, not full formula units.
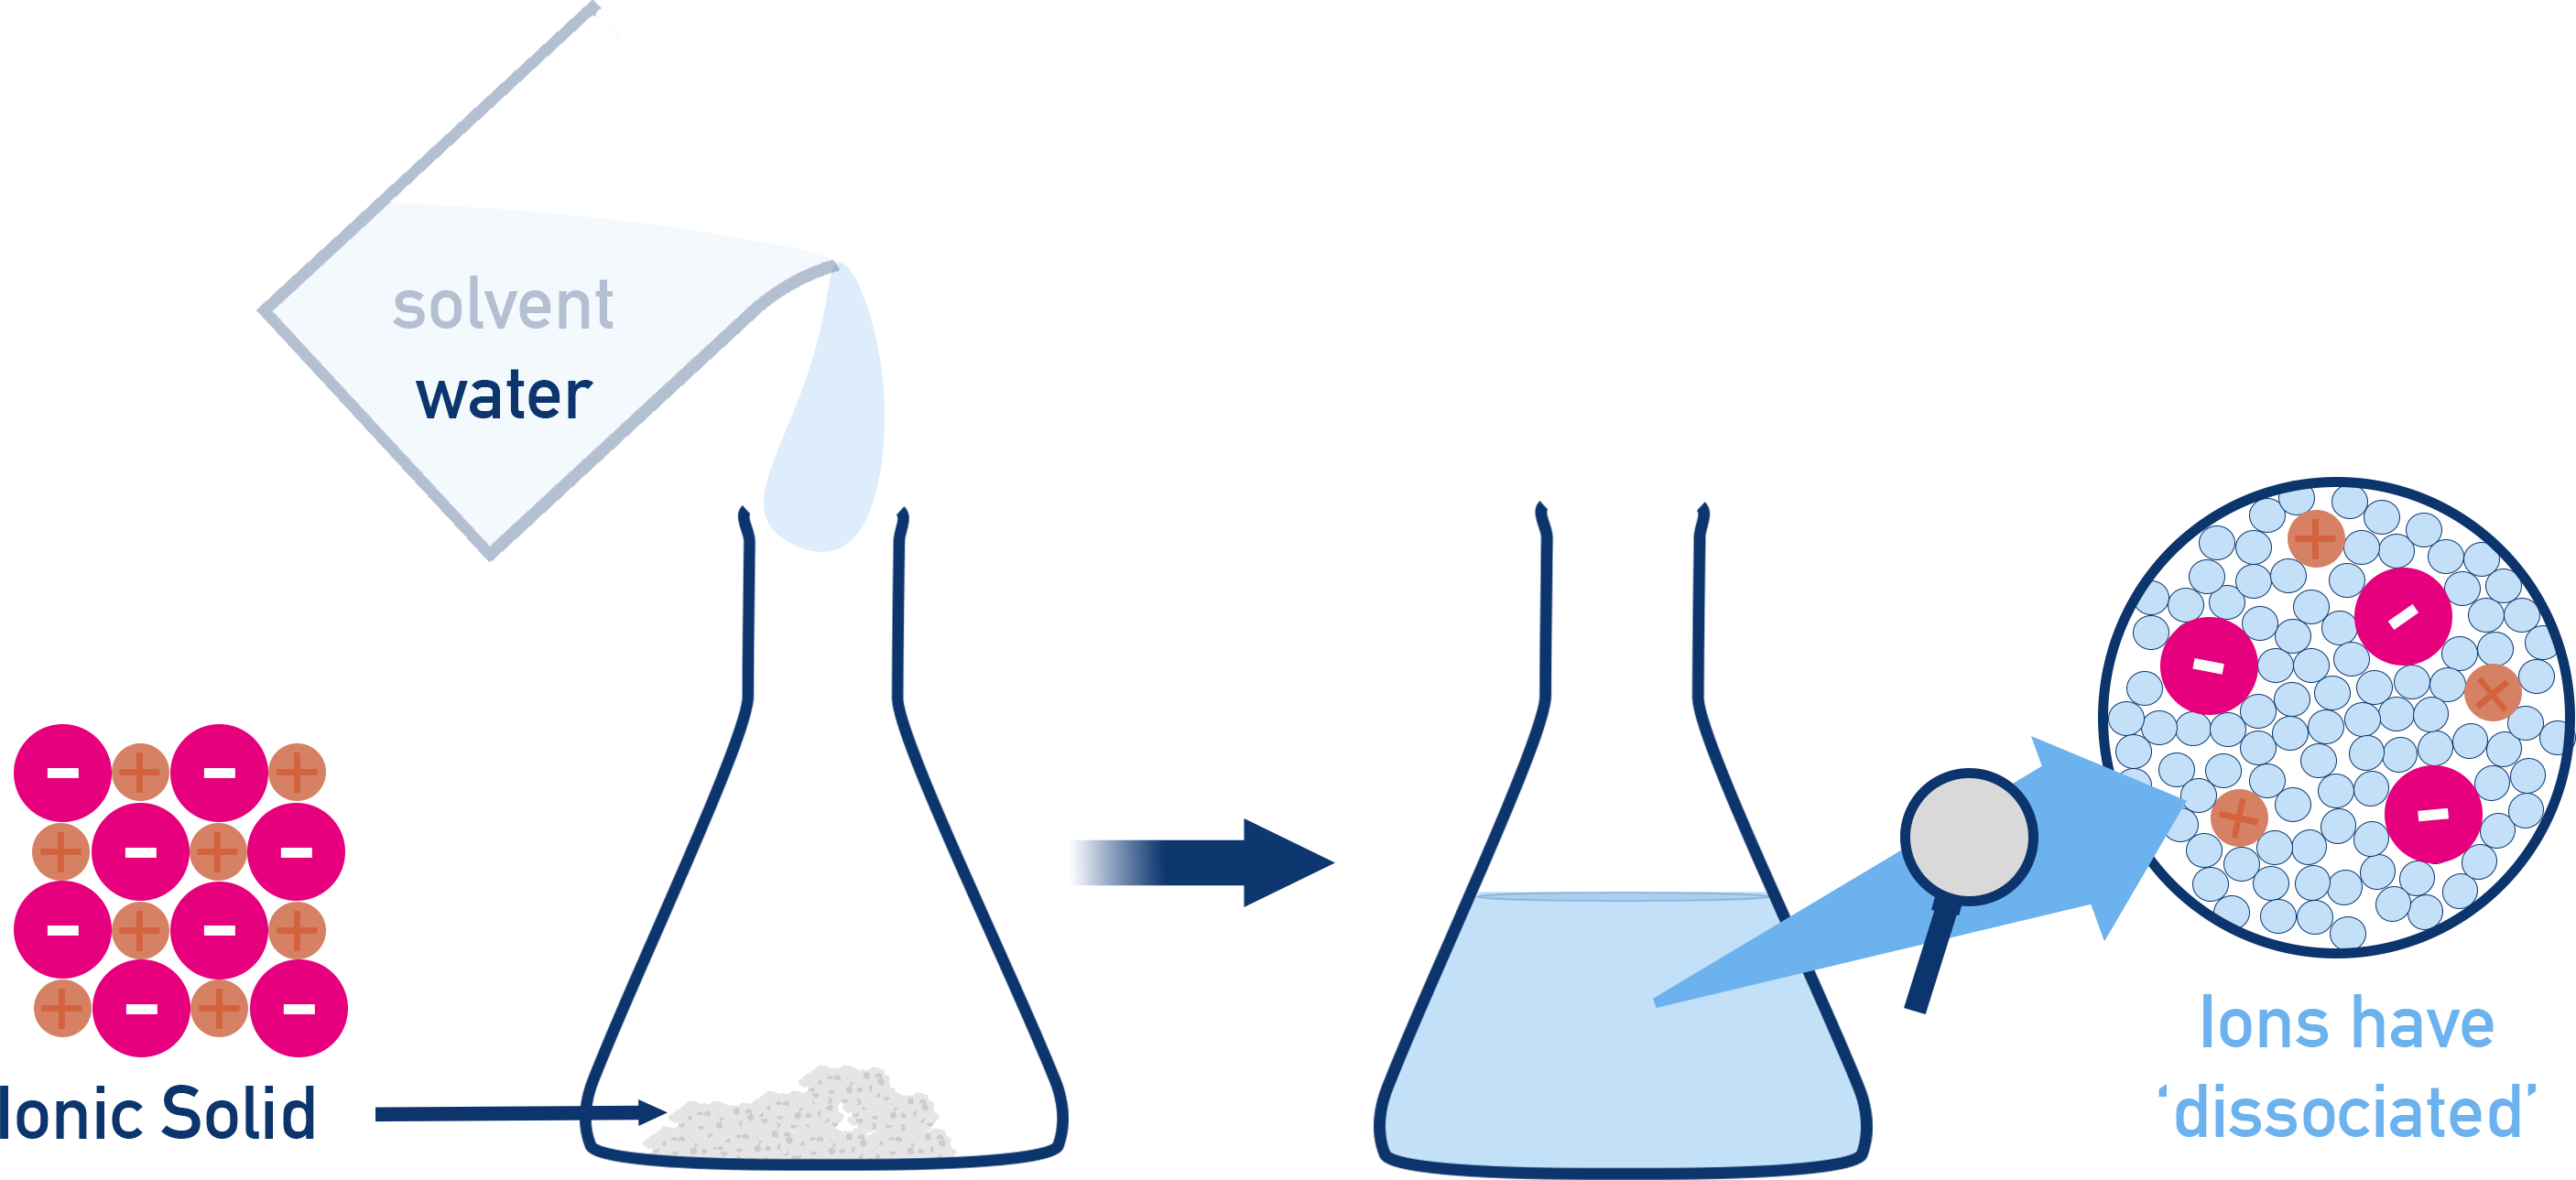
Example:For NaCl: Na+ and Cl− ions are shown individually, surrounded by water molecules.
Solvent–solute interactions
The orientation of solvent particles (e.g., water molecules) must show ion-dipole attractions.

Example:Water’s partial negative oxygen faces positively charged ions, and partial positive hydrogens faces negatively charged ions

When asked to interpret a particulate diagram, first ask: Is the solute ionic or molecular? Next: Are interactions shown correctly? (e.g., orientation of water around ions) Then: Count the number of solute particles — is this a concentrated or dilute solution?
Summary
Particulate models visually describe how the components of a solution are distributed and interact. They:
- Help represent concentration at the particle level
- Show how ionic and molecular substances behave in solvents
- Emphasize intermolecular forces like ion-dipole and hydrogen bonding
- These diagrams are a powerful tool for making the behavior of mixtures and solutions more intuitive, especially when combined with symbolic equations and quantitative data.