
Concentration Changes Over Time
Quick Notes
- Graphs of concentration vs. time help identify the order of a reaction.
- Zeroth order: [A] vs. time is linear
- First order: ln[A] vs. time is linear
- Second order: 1/[A] vs. time is linear
- The slope of the linear graph gives the rate constant, k.
- Half-life (t1/2) is constant only for first order reactions: t1/2 = 0.693 / k
- Radioactive decay is a classic example of first-order kinetics.
Full Notes
To understand how concentration changes over time, we monitor the concentration of a reactant, [A], during a reaction and look for patterns. The way the concentration of a reactant decreases over time depends on the reaction order with respect to the reactant.
Zeroth Order Reactions
![Zeroth-order integrated rate law and linear [A] vs time plot with slope −k.](images/zeroorder.png)
- Rate is independent of [A]
- Integrated rate law: [A]t = [A]0 − k t
- Plot: [A] vs. time is linear with slope = −k
- Units of k: mol·L−1·s−1
First Order Reactions
![First-order integrated rate law and linear ln[A] vs time plot with slope −k.](images/firstorder.png)
- Rate depends linearly on [A]
- Integrated rate law: ln[A]t = ln[A]0 − k t
- Plot: ln[A] vs. time is linear with slope = −k
- Units of k: s−1
Half-life is constant - see below: t1/2 = 0.693 / k
Second Order Reactions
![Second-order integrated rate law and linear 1/[A] vs time plot with slope +k.](images/secondorder.png)
- Rate depends on [A]2
- Integrated rate law: 1/[A]t = 1/[A]0 + k t
- Plot: 1/[A] vs. time is linear with slope = +k
- Units of k: L·mol−1·s−1
How to Identify the Order from Graphs
- Plot [A] vs. time → Linear? Zeroth order
- Plot ln[A] vs. time → Linear? First order
- Plot 1/[A] vs. time → Linear? Second order
Whichever graph is linear tells you the order of the reaction. The slope of the line gives you the rate constant (k).
Half-Life and First Order Reactions
In first order reactions, the half-life (time for [A] to decrease by half) is constant, regardless of the starting concentration.
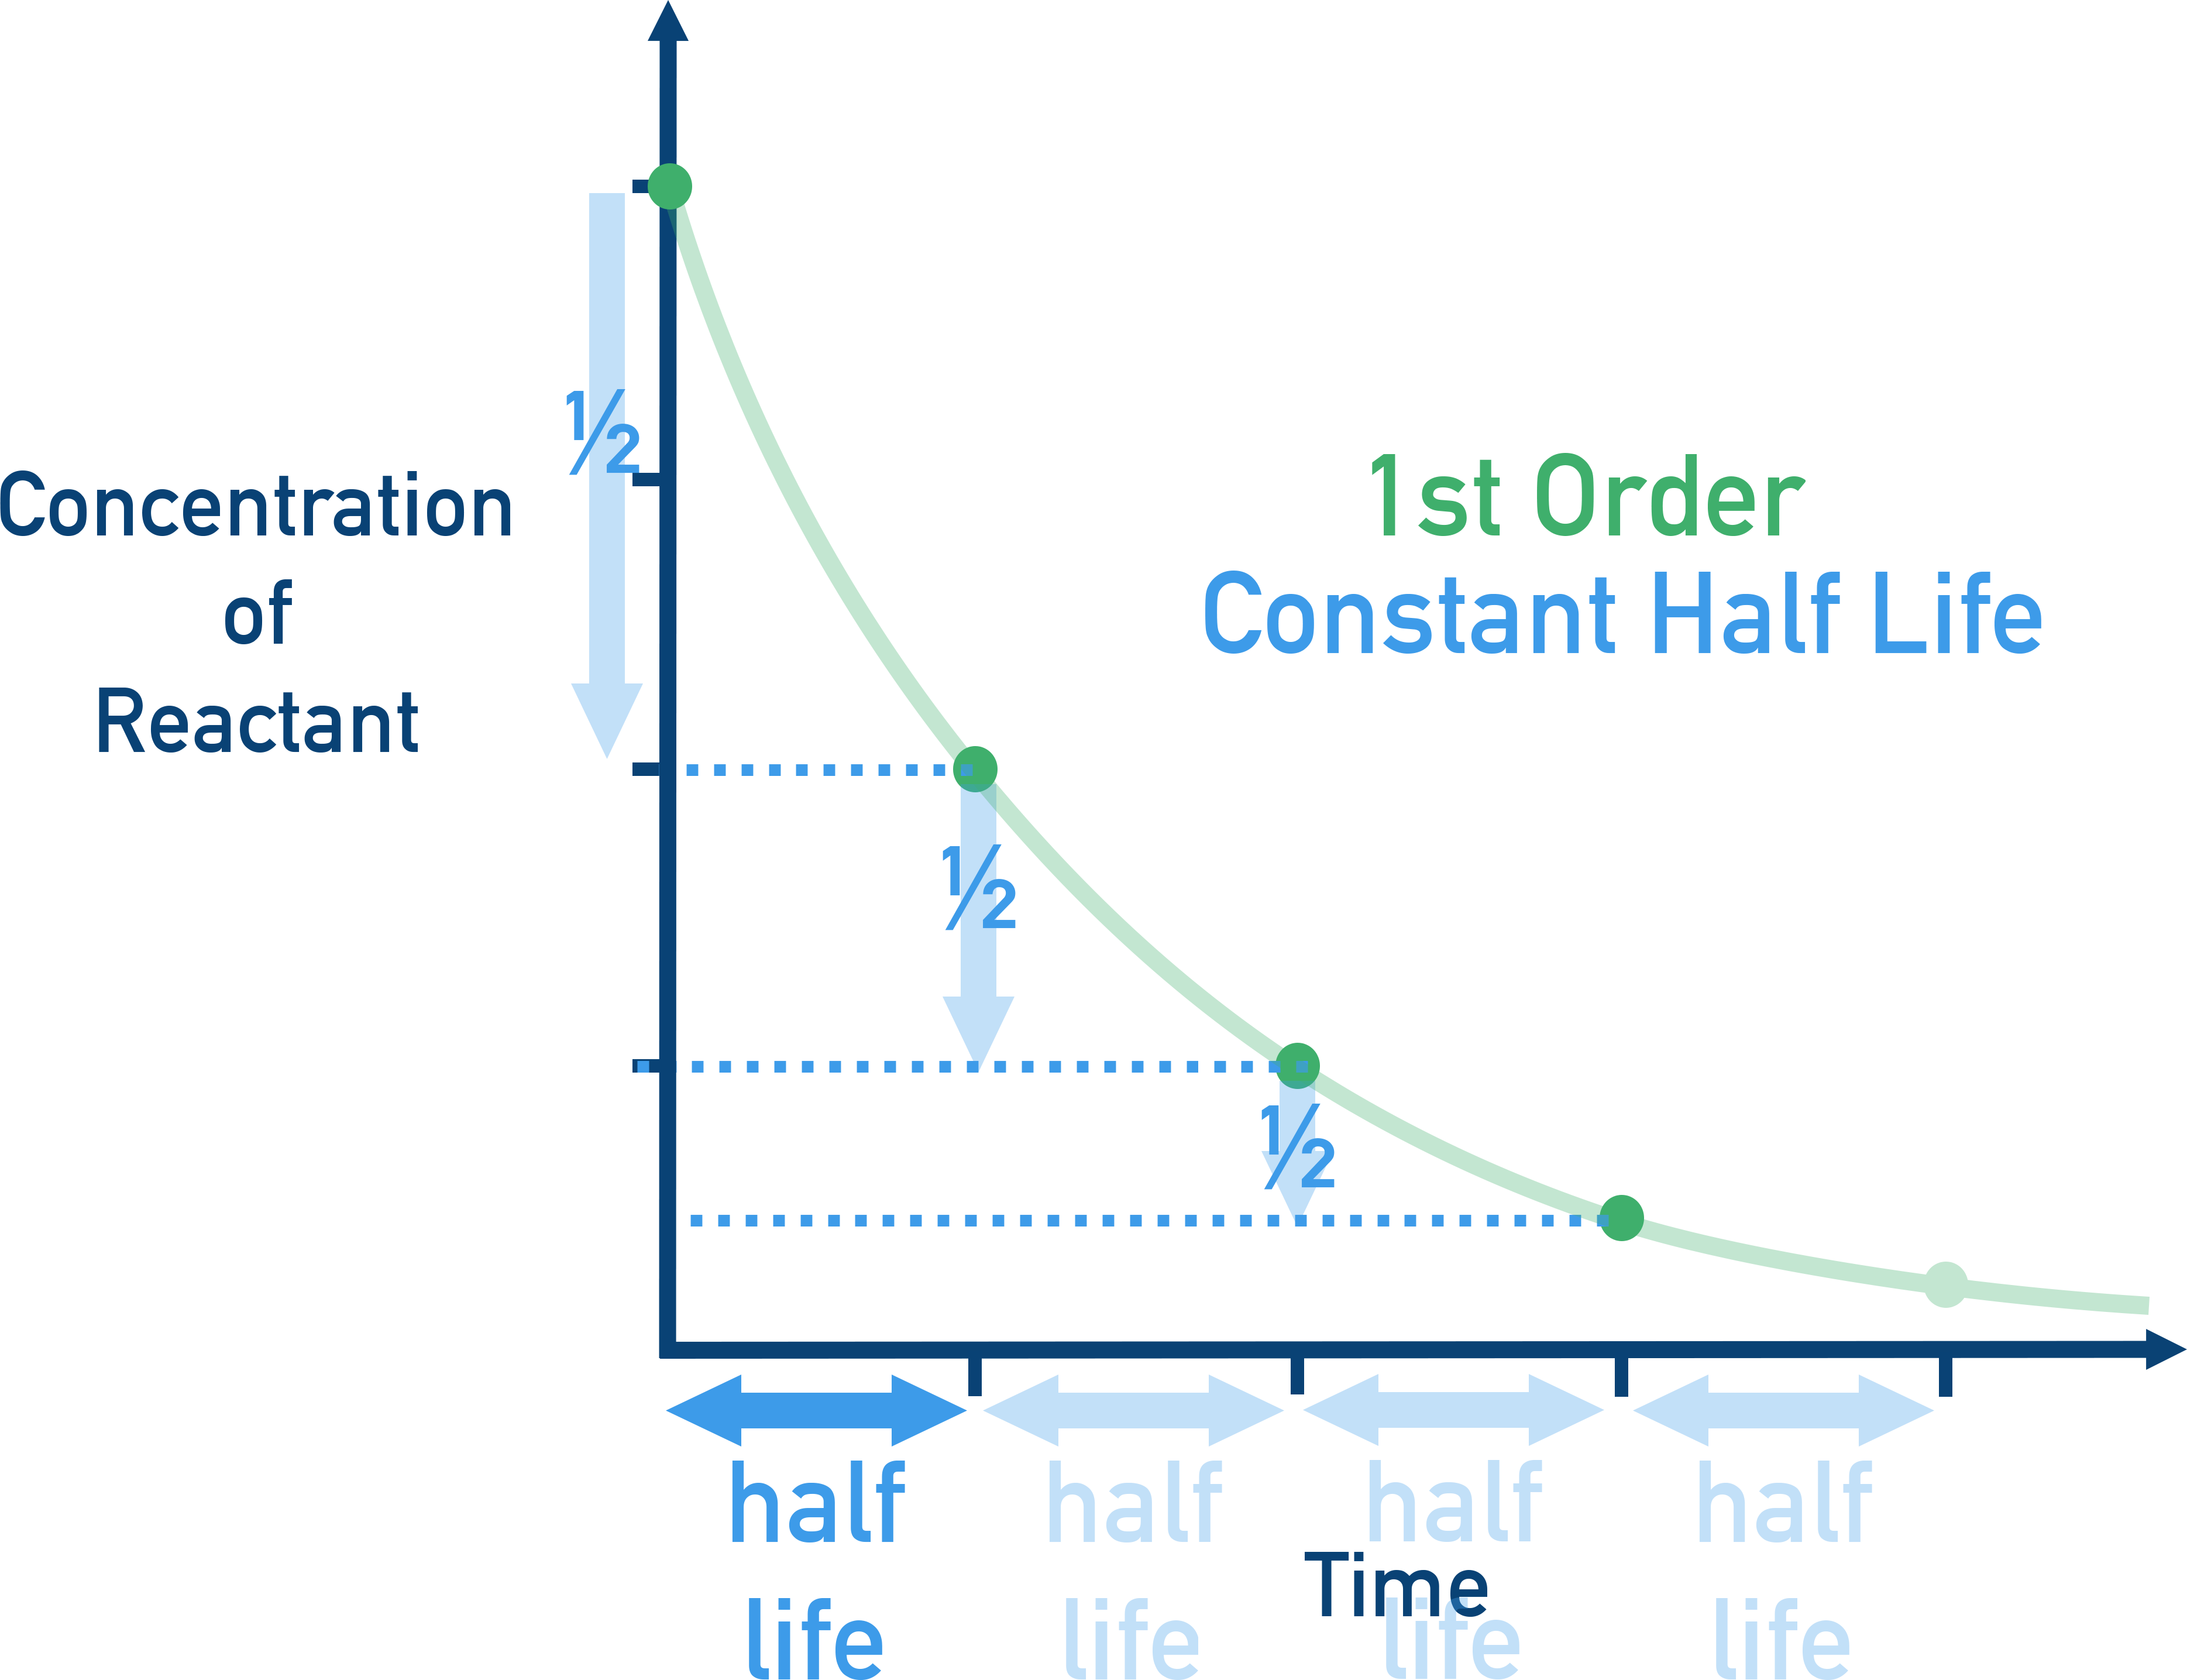
Equation: t1/2 = 0.693 / k.
This feature makes first order kinetics easy to identify and apply. It's also why first order equations are often used to model radioactive decay.
Example First-order decay with k = 0.010 s−1:
t1/2 = 0.693 / 0.010 = 69.3 s
the concentration halves every 69.3 seconds.

Make sure you know the three graphs and how to interpret them. If a question gives you time and concentration data, always try plotting ln[A] and 1/[A] to check for a linear graph — that tells you whether it’s first or second order.
Summary
- Changes in reactant concentration over time allow us to determine the order of a reaction by analyzing different graphs.
- Each order has a unique linear form and equation.
- For first order reactions, half-life is a key feature and remains constant.
These principles help us determine rate laws from time-course data and apply them to real-world processes like radioactive decay.