
Reaction Energy Profiles
Quick Notes
- A reaction energy profile shows how the energy of a system changes as reactants convert to products.
- The x-axis is the reaction coordinate, showing the progress of the reaction.
- The y-axis is the potential energy of the system.
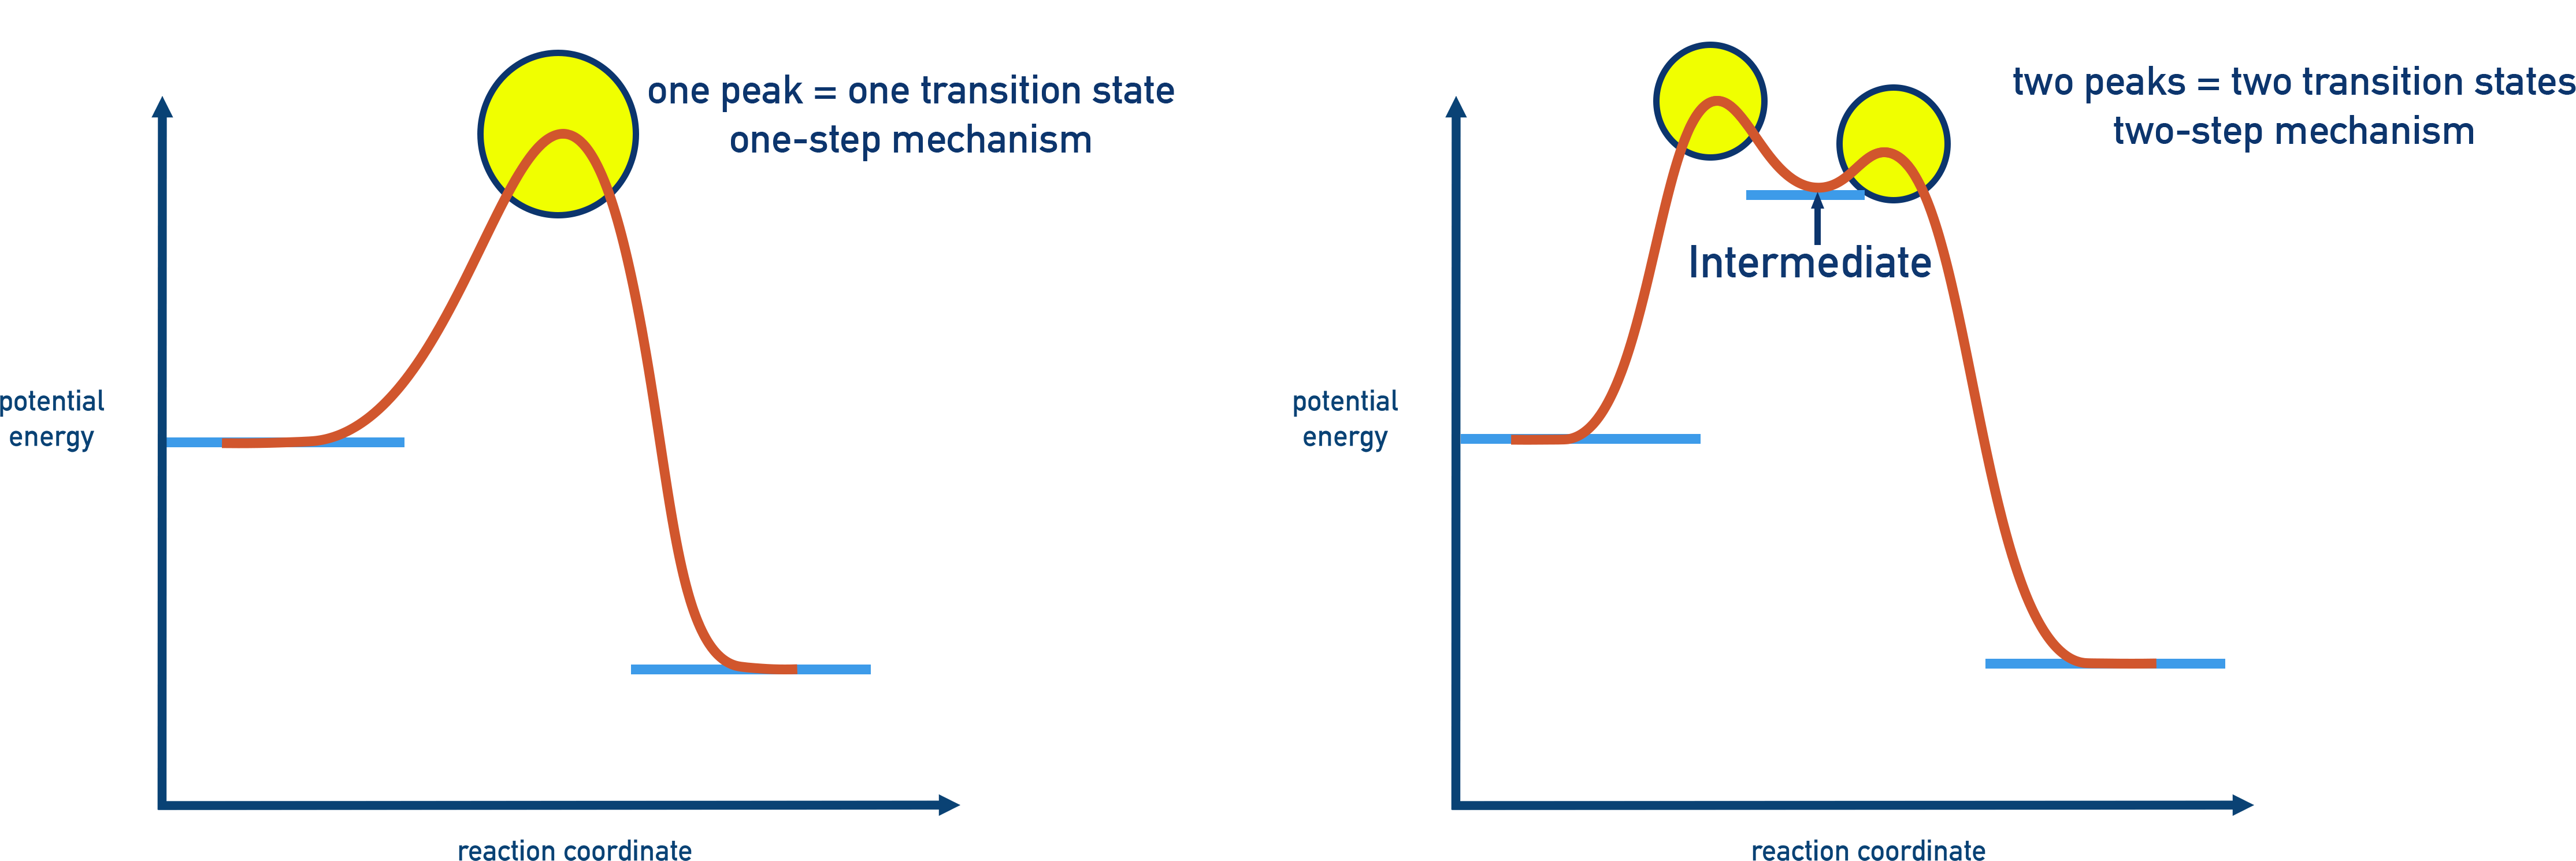
- The peak of the curve is the transition state, the highest energy point.
- The energy difference between reactants and the transition state is the activation energy (Ea).
- The energy difference between reactants and products is the overall energy change (ΔE).
- A lower Ea means a faster reaction.
Full Notes
What is a Reaction Energy Profile?
A reaction energy profile is a graph showing how the potential energy of a system changes as the reaction progresses.
- X-axis: Reaction coordinate (pathway from reactants to products).
- Y-axis: Potential energy of the system.
The profile shows:
- Energy needed to start the reaction (activation energy, Ea).
- Whether the reaction releases or absorbs energy (exothermic or endothermic).
Key Parts of the Energy Profile
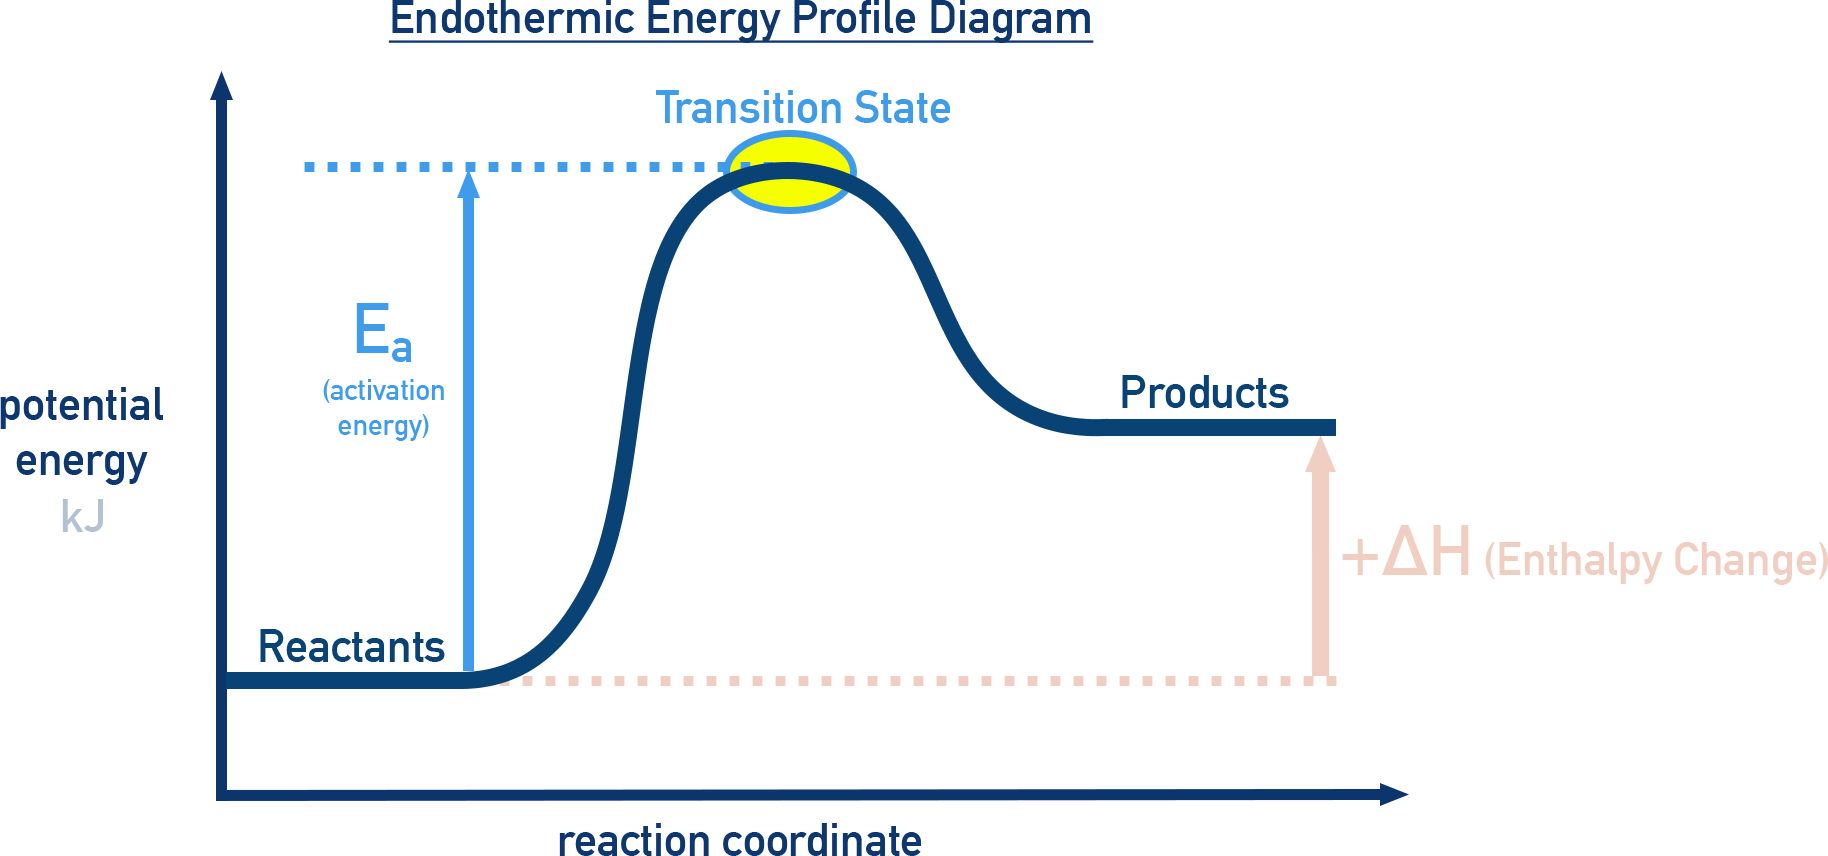
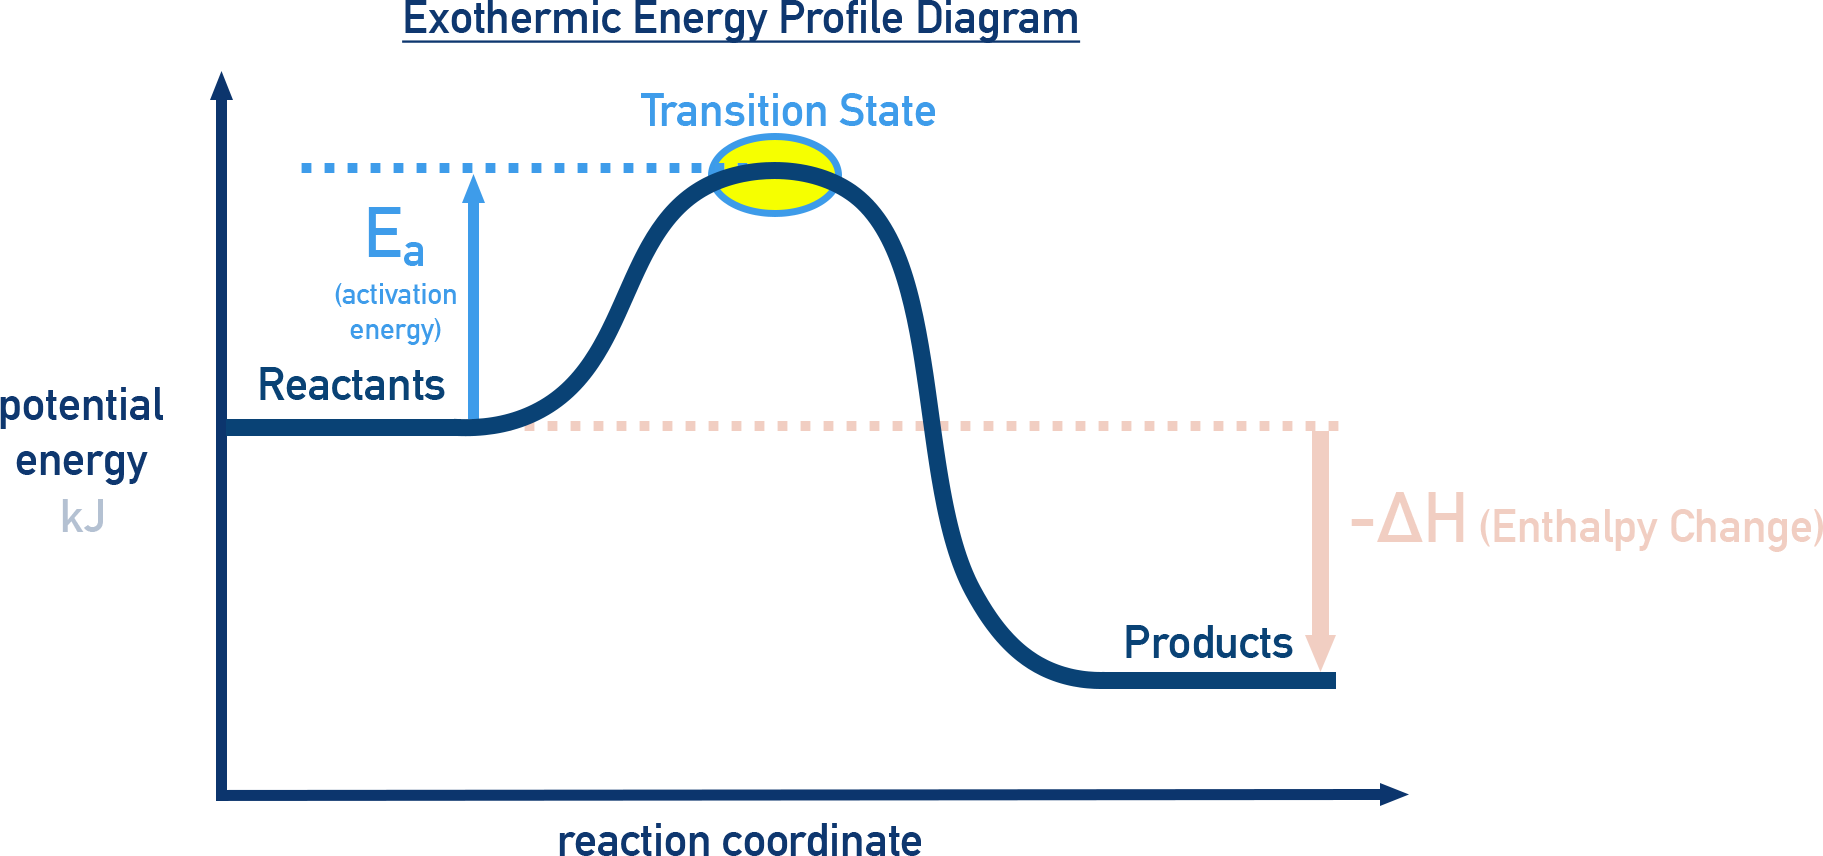
- Reactants: Starting point on the left side.
- Transition State: Highest point; temporary high-energy arrangement of atoms.
- Activation Energy (Ea): Energy from reactants to the transition state (“energy hill”).
- Products: Ending point on the right side.
- ΔE: Energy difference between products and reactants.
- ΔE < 0 → exothermic (releases energy)
- ΔE > 0 → endothermic (absorbs energy)

In reversible reactions, the profile can be read in both directions. For the reverse reaction, Ea is the energy gap between products and the transition state.
Temperature and Activation Energy
Not all collisions between particles cause reactions — only those with energy ≥ Ea (see 5.5).
Increasing temperature means more particles have enough energy to overcome the barrier, increasing the reaction rate.
Even small temperature rises can greatly speed up reactions, this can be explained by the Arrhenius Equation.
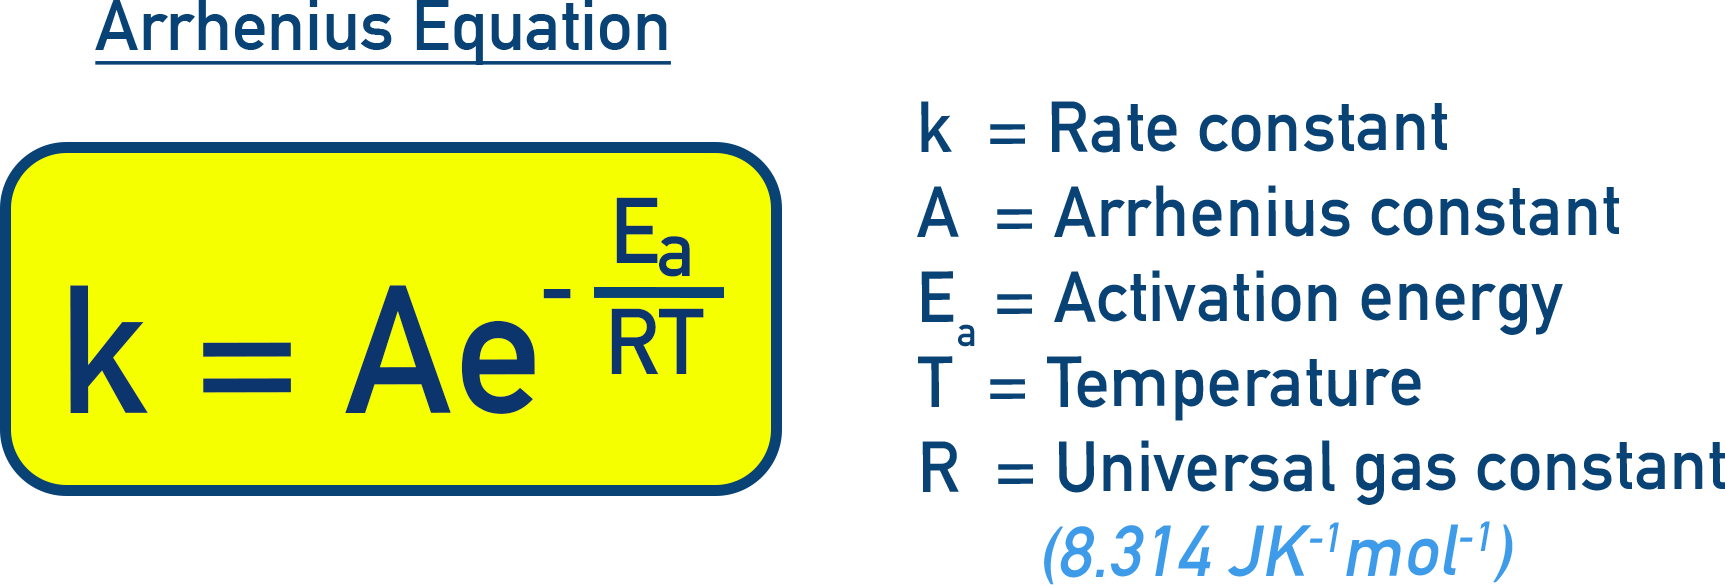
- A: Arrhenius constant (collision frequency factor)
- Ea: Activation energy (J·mol⁻¹)
- R: Gas constant (8.31 J·mol⁻¹·K⁻¹)
- T: Temperature (K)
As T increases, the exponential term e-Ea/RT increases, so k increases sharply.
For more detail beyond AP Chemistry see Temperature Dependence of Rates.
The Role of the Transition State
The transition state is a fleeting, unstable arrangement of atoms at the highest energy point. It cannot be isolated or observed directly.
Imagine throwing a ball up in the air – the transition state is a bit like the highest point it reaches – the ball passes it briefly and can’t remain there.
ExampleThe substitution of a nucleophile (X) into an halogenoalkane gives a transition state where the incoming nucleophile and outgoing halogen are both bonded to a carbon at the same time.
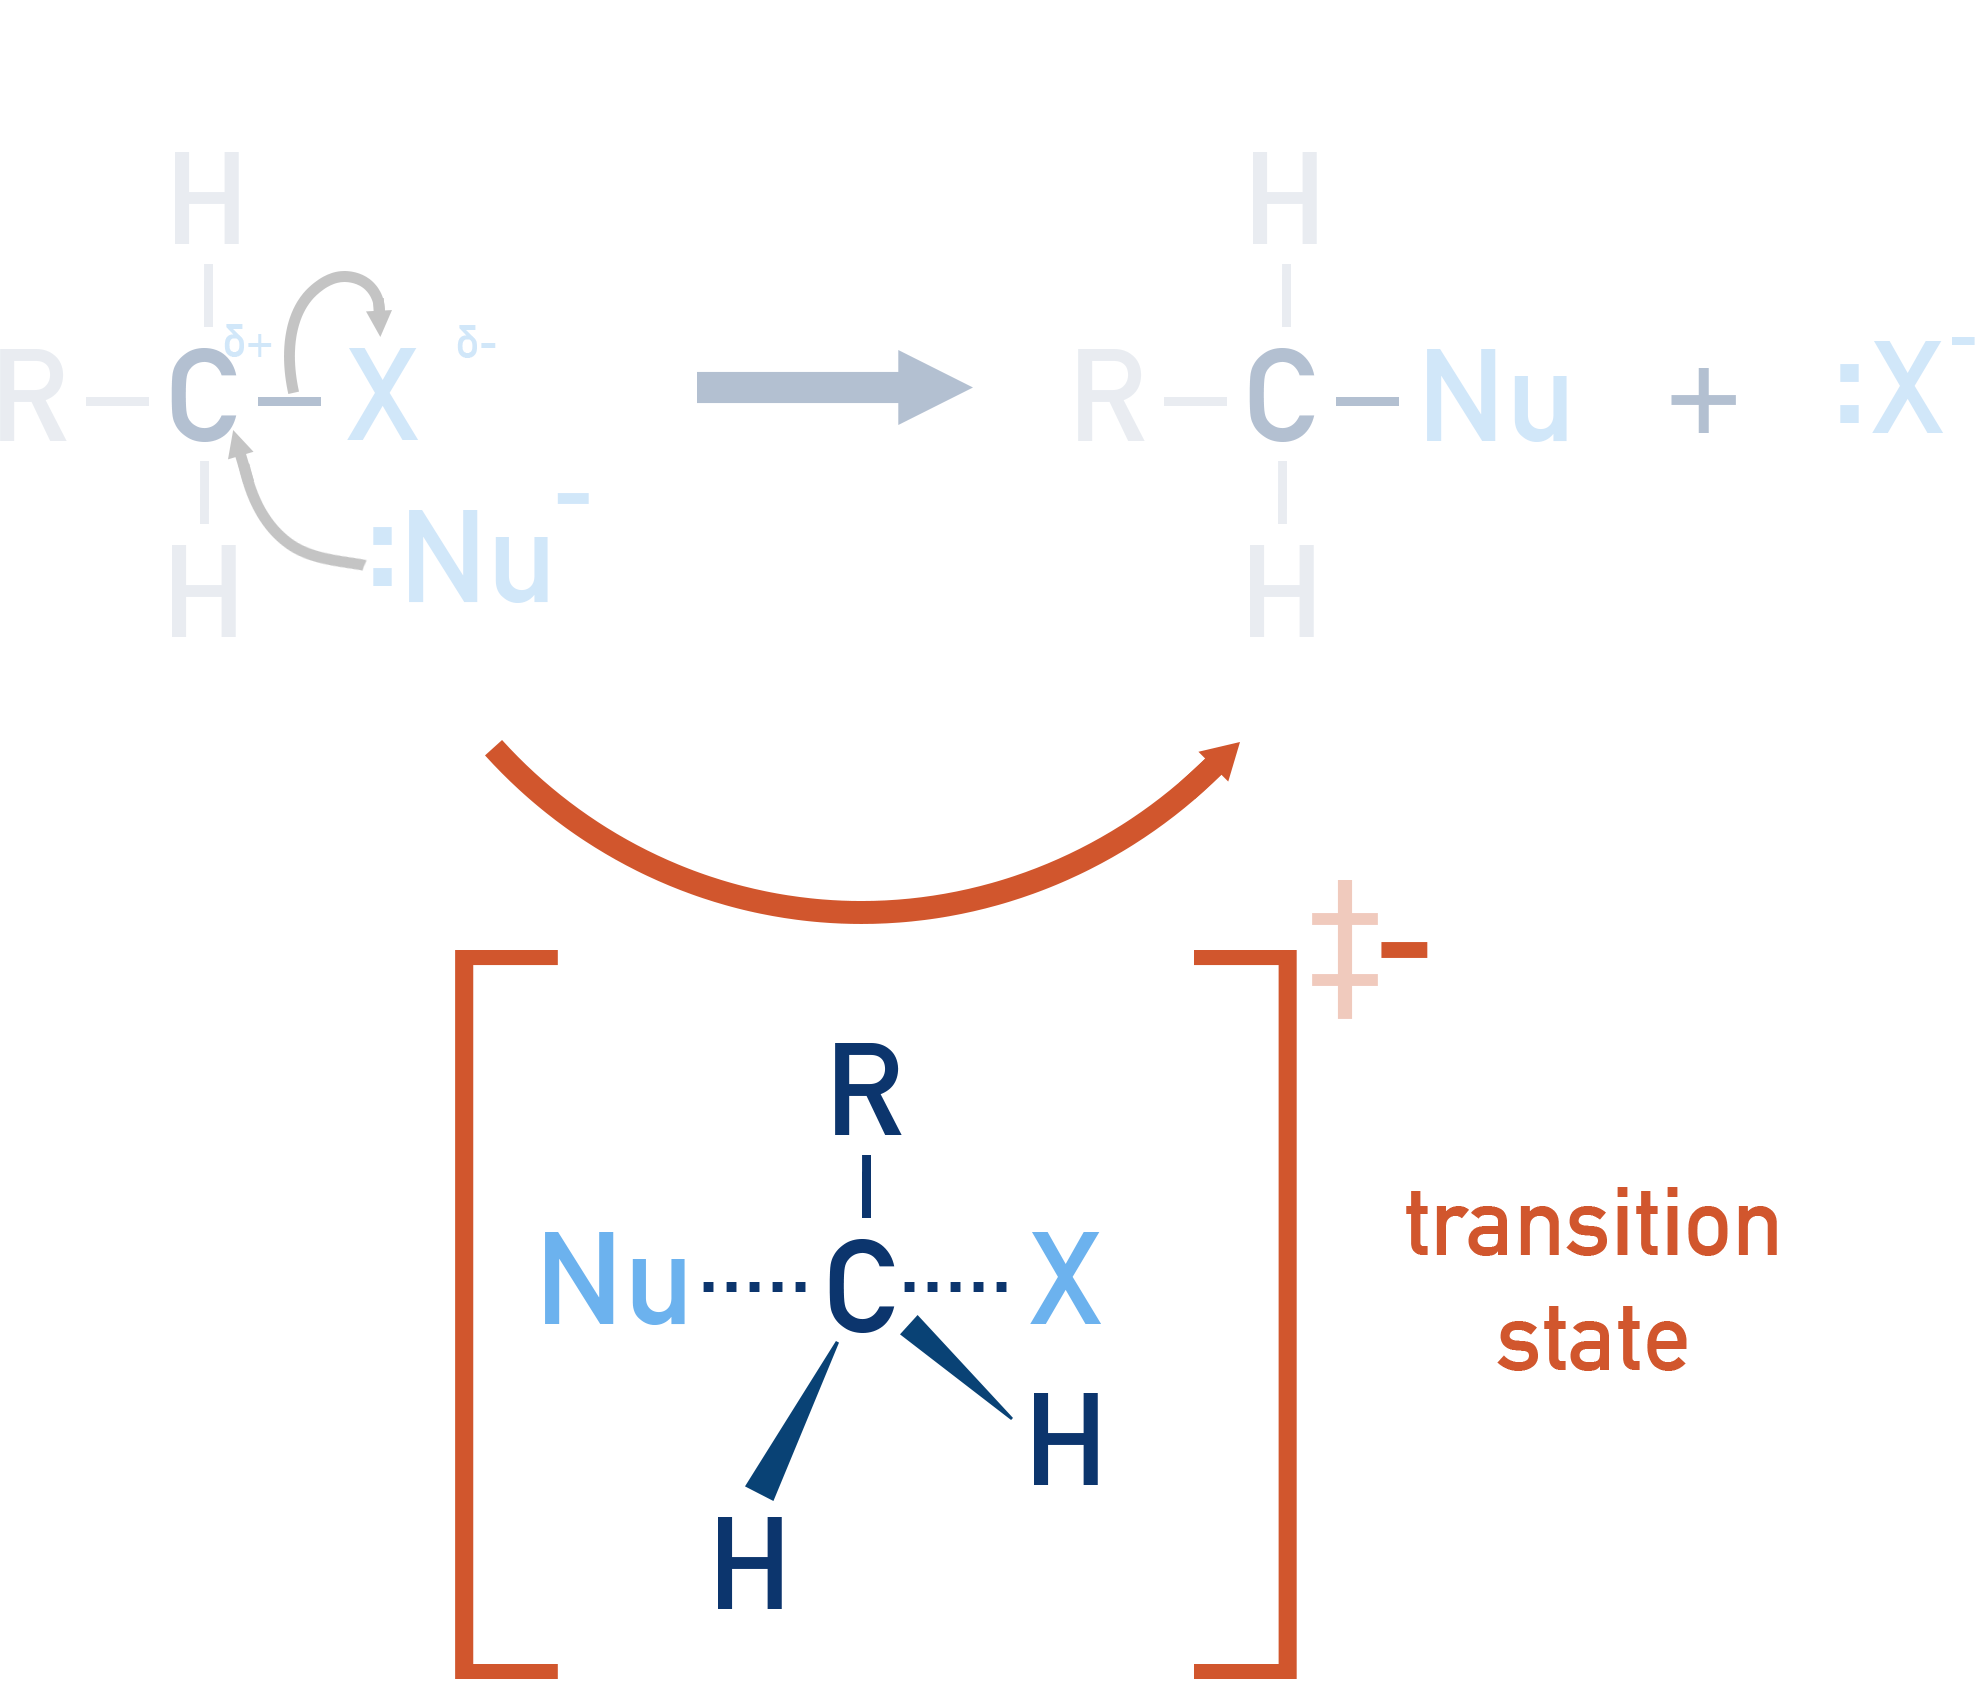
Bonds are partly broken and partly formed at the same time.
Summary
- A reaction energy profile visualizes the activation energy (Ea) and the overall energy change (ΔE).
- Ea controls reaction rate, while ΔE determines whether the reaction is endothermic or exothermic.
- Temperature changes affect reaction speed by altering the number of particles with sufficient energy to reach the transition state.