
Introduction to Rate Law
Quick Notes
- The rate law shows how the rate of a reaction depends on reactant concentrations.
- General form: rate = k[A]m[B]n
- k = rate constant (depends on temperature)
- m, n = reaction orders (determined experimentally, not from the balanced equation)
- Overall order of reaction = m + n
- Units of k depend on the overall order of reaction
- Reaction orders are found experimentally by comparing initial rates from experiments using different reactant concentrations
Where:
Full Notes
What Is a Rate Law?
A rate law is a mathematical expression that relates the reaction rate to the concentrations of reactants. It is determined experimentally, not from the balanced chemical equation.
For a general reaction A + B → C:
rate = k[A]m[B]n
k is the rate constant (depends on temperature)
m is the order of the reaction with respect to A
n is the order of the reaction with respect to B
Overall order = m + n
Reaction Order
The order of reaction with respect to a reactant tells us how the rate changes as the concentration of that reactant changes. It is the power (exponent) of the reactant concentration in the rate equation.
For Example
rate = k[A]1 → first order in A
rate = k[A]1[B]2 → first order in A, second order in B, overall order = 3
Orders can be determined using graphs (Graphical Methods)

Don’t assume the exponents in the rate law come from the balanced equation — they don’t (unless the reaction is elementary - see elementary reactions). Only use experimental data to determine the order for each reactant.
Concentration–Time Graphs
We can measure how the initial reaction rate changes when reactant concentrations are varied. The shapes of these graphs can identify the reaction order for each reactant.
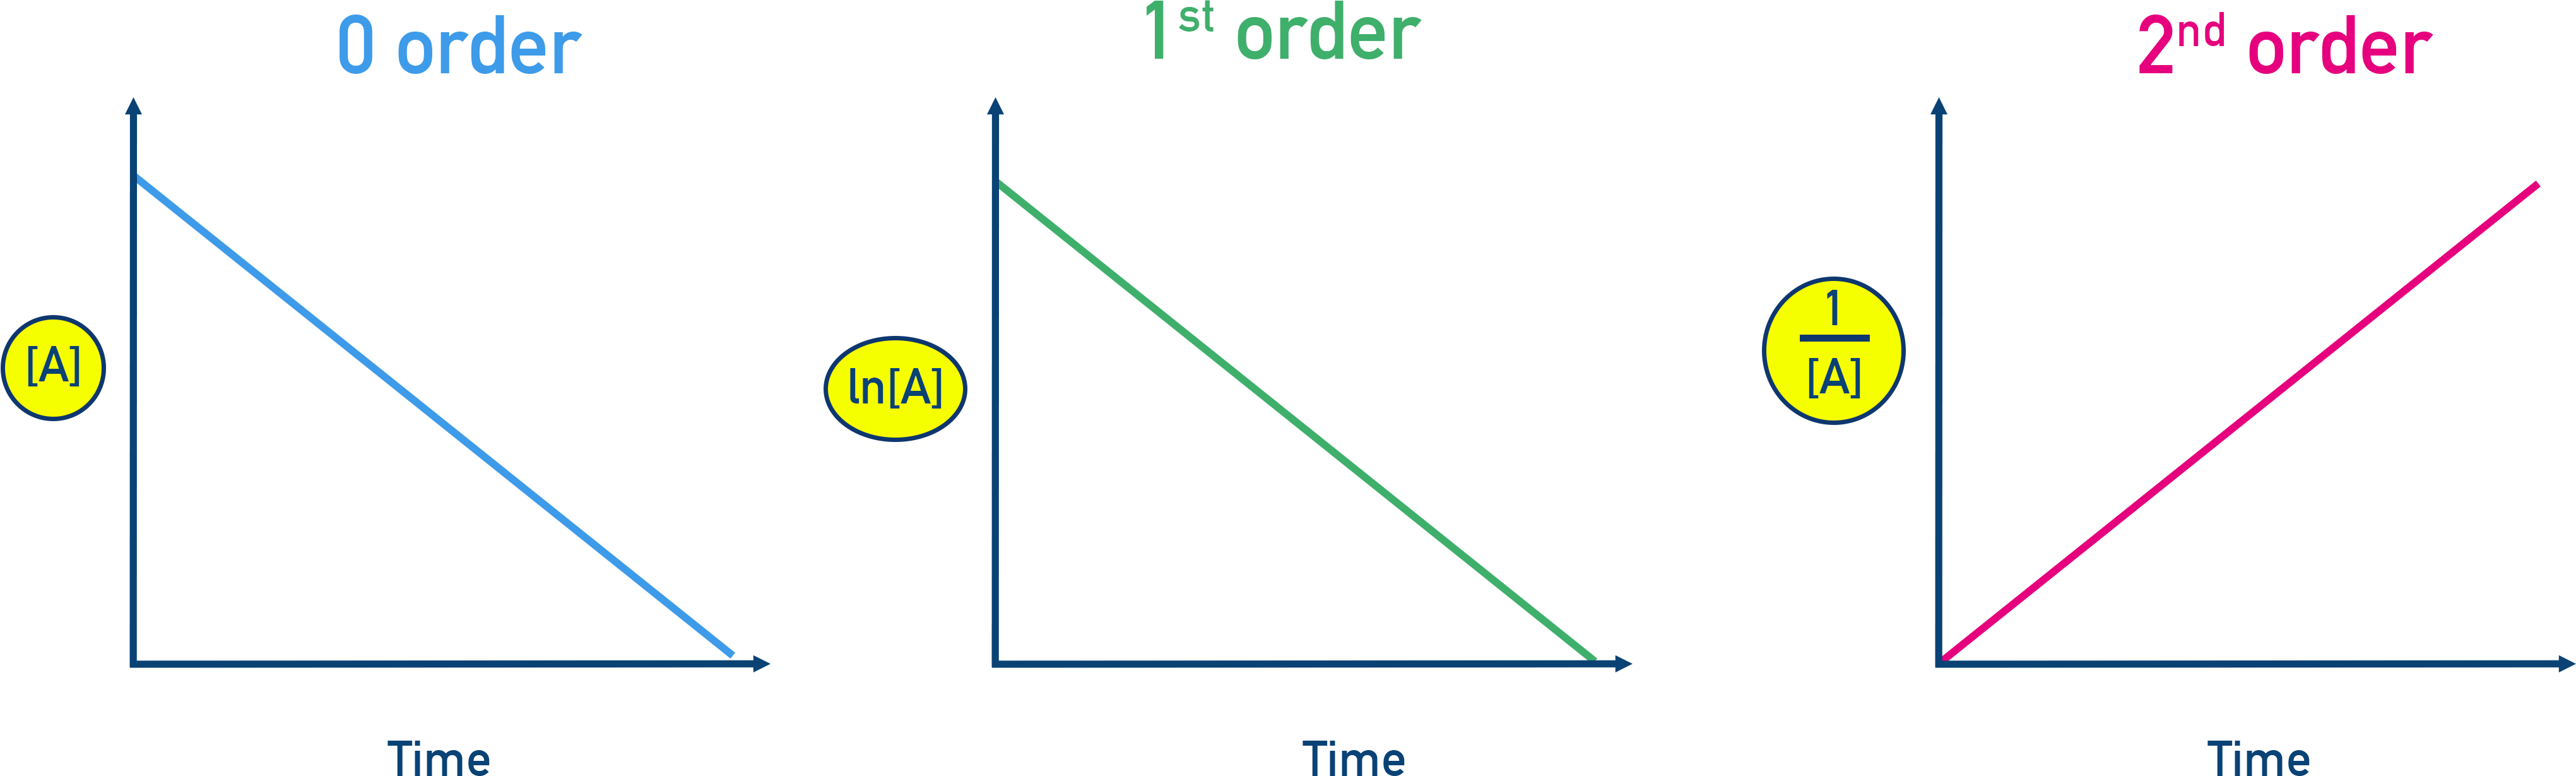
- Zero Order: [A] vs time is a straight line with negative slope; rate is constant.
- First Order: ln[A] vs time is a straight line with negative slope; [A] decays exponentially.
- Second Order: 1/[A] vs time is a straight line with positive slope; direct [A] vs time plot curves downward.
Pay close attention to the y-axis label on each graph — they are different for zero, first, and second order plots.
Rate–Concentration Graphs
We can also measure concentration at different times during a reaction and plot rate vs concentration to determine the order.
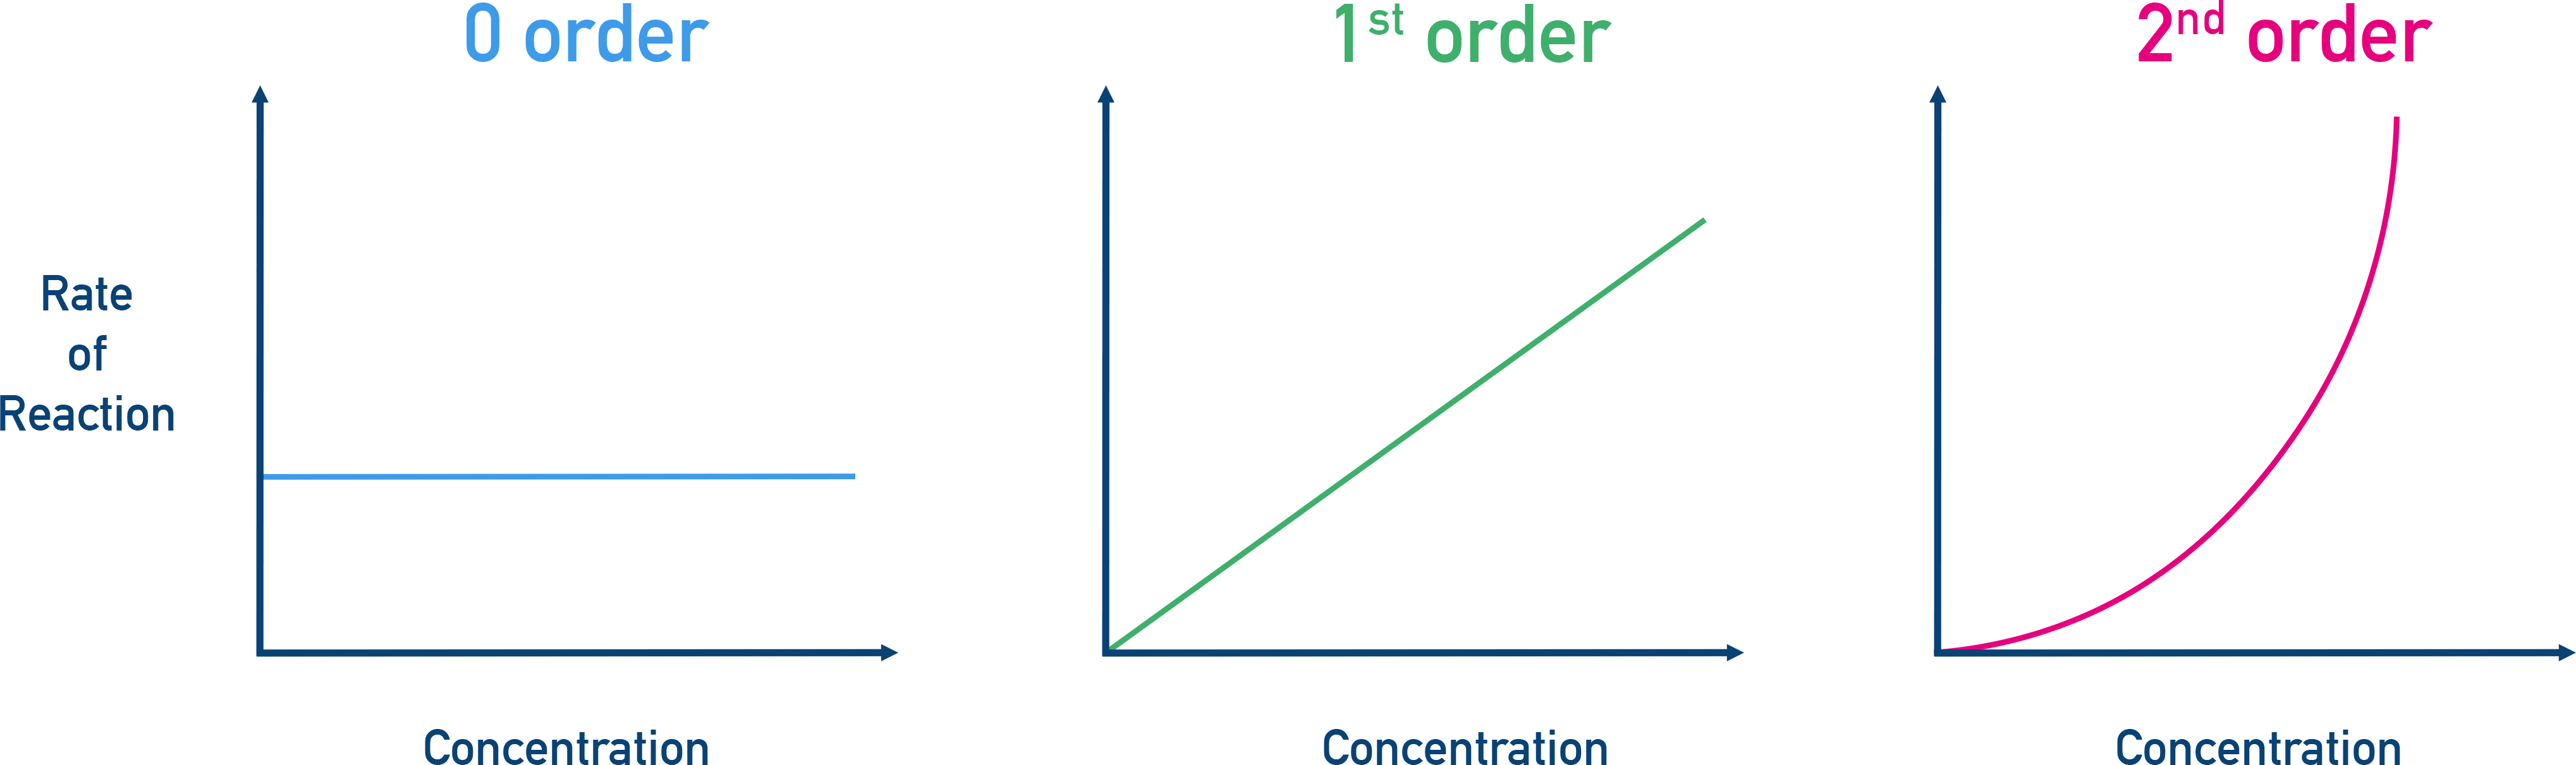
- Zero Order: Horizontal line — rate is constant.
- First Order: Straight line through the origin.
- Second Order: Upward-curving line starting from the origin.
Rate Constant (k) and Units
Values of k depend on temperature and a given reaction mechanism.
Units depend on the overall reaction order:
- Zero order: mol·L⁻¹·s⁻¹
- First order: s⁻¹
- Second order: L·mol⁻¹·s⁻¹
Half-Life and First Order Reactions
A key feature of a first-order reaction is a constant half-life: the time for the concentration to halve is the same regardless of starting concentration.
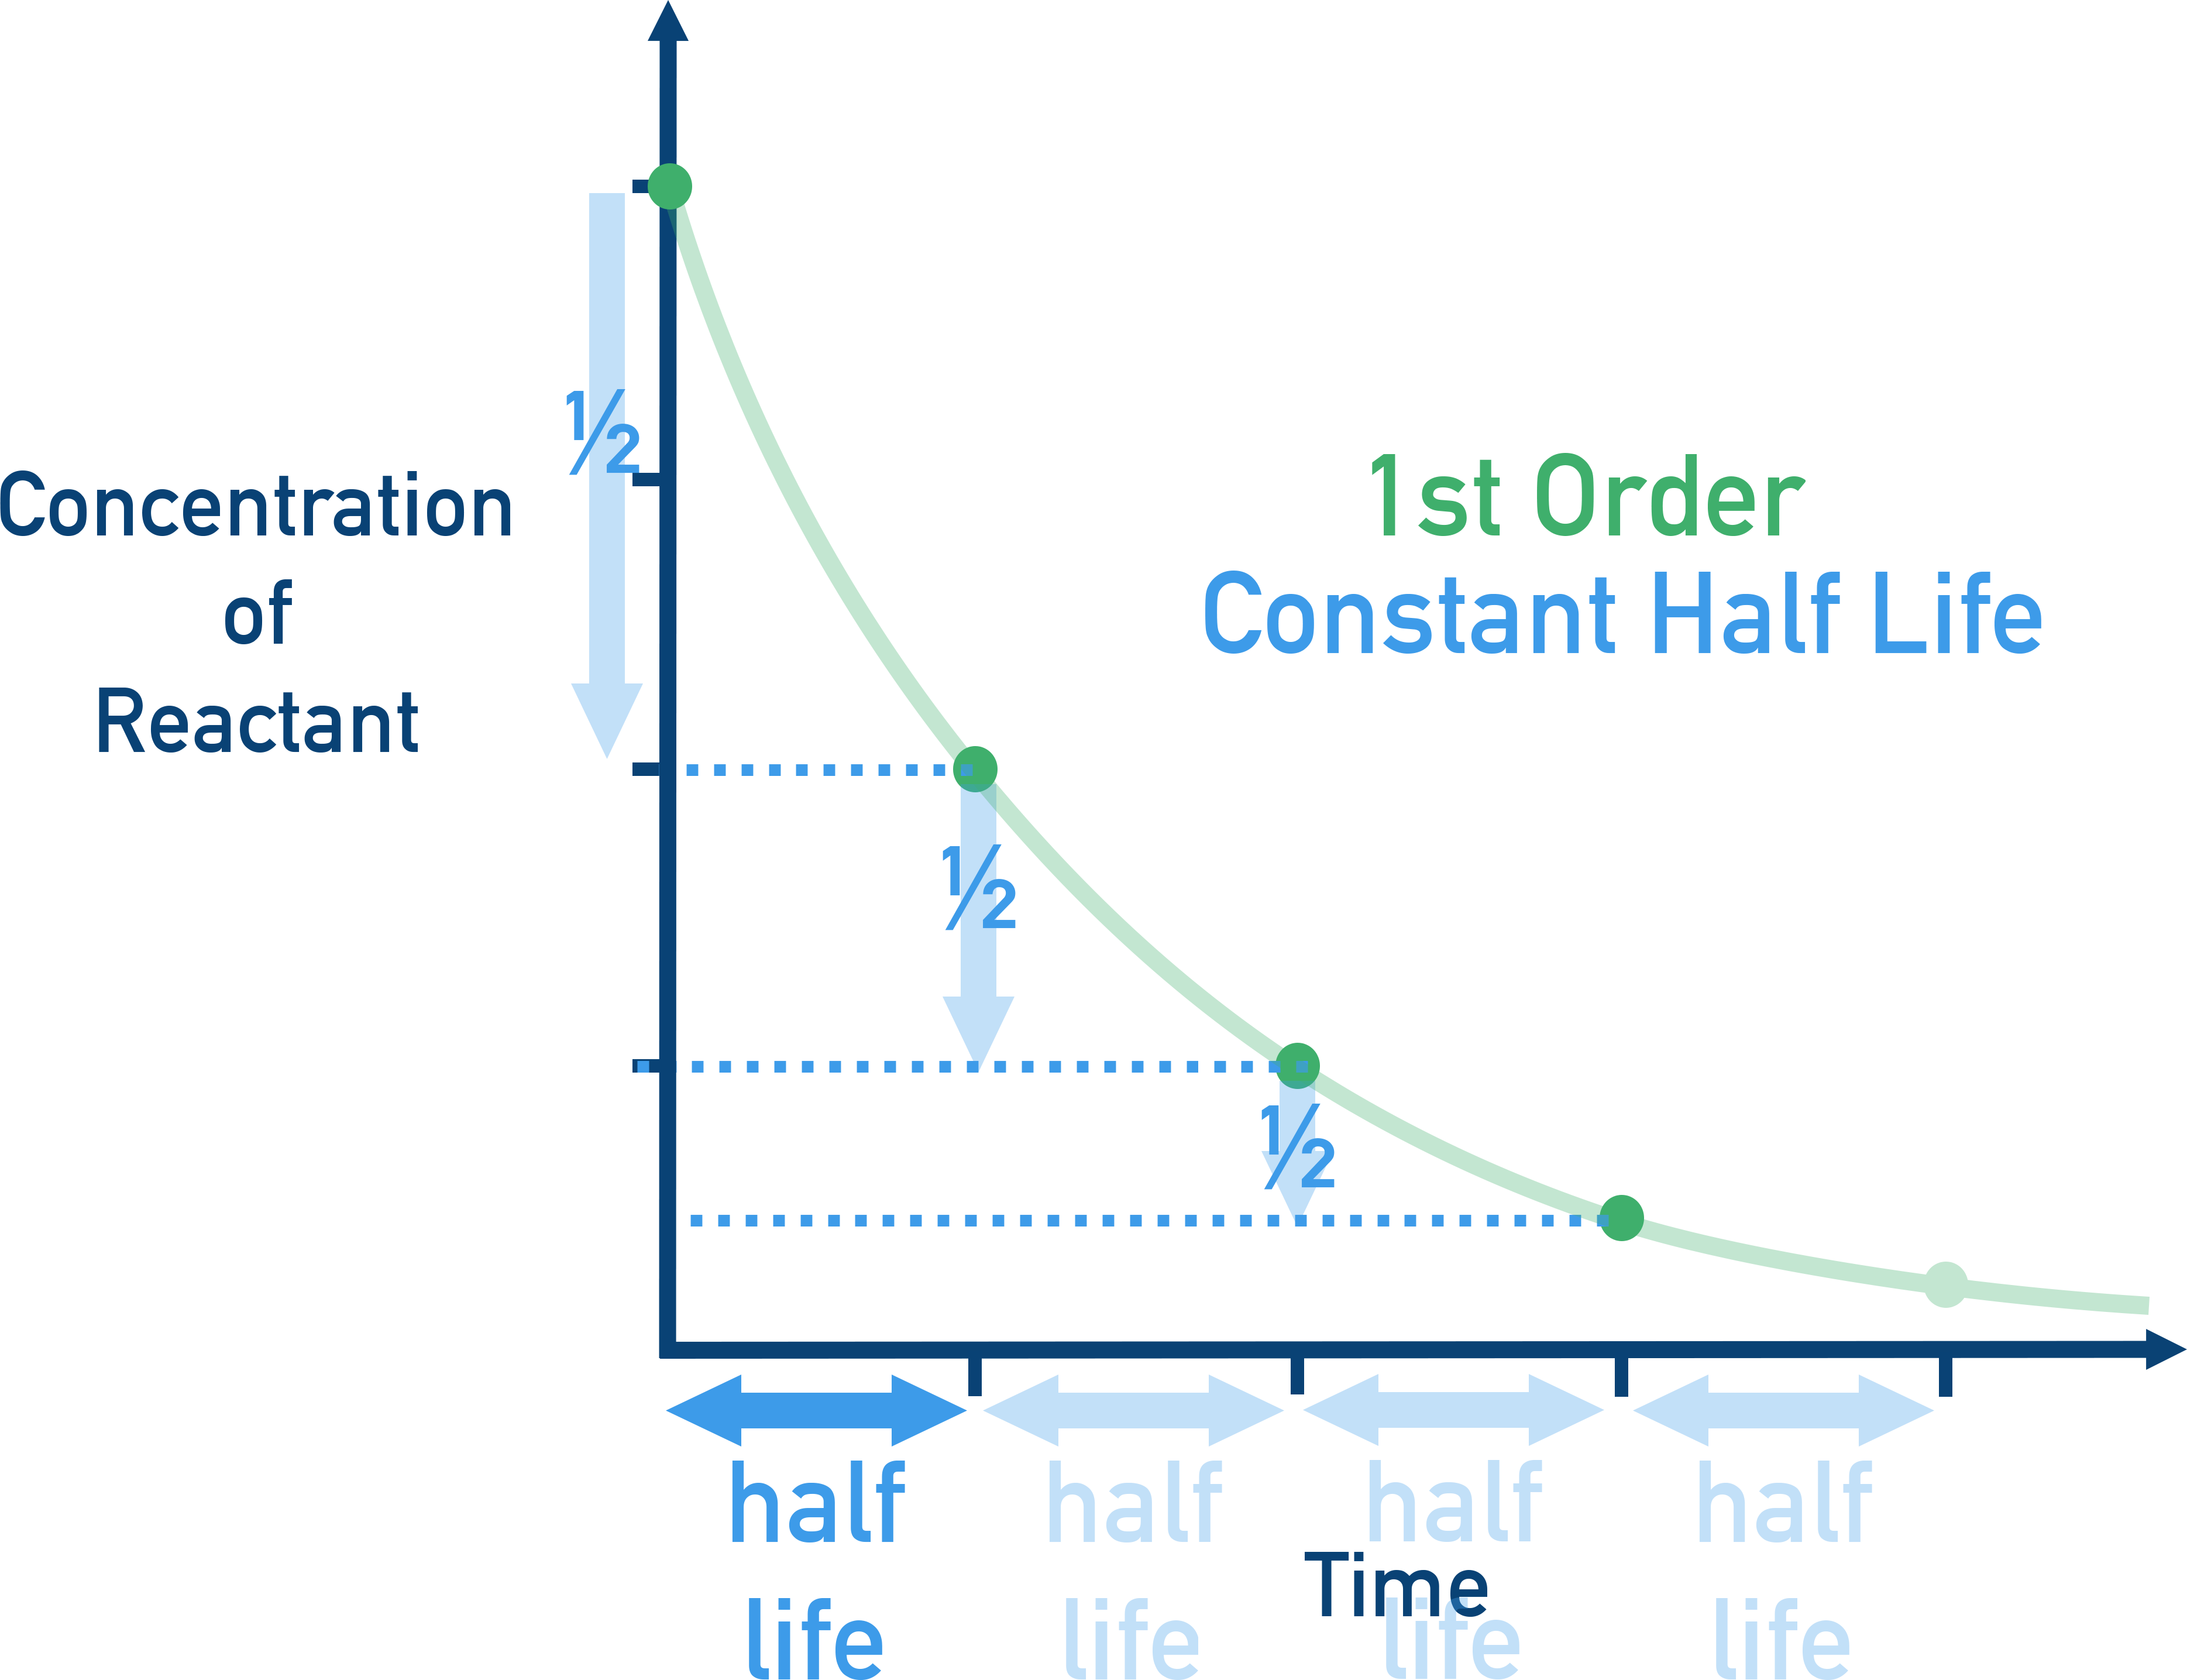
This can be useful for confirming a reaction is first-order as:
k = 0.693 / t½
where t½ is the half-life.
Note - this is only valid for first-order reactions.
Using Rate Laws to Predict Rates
Given: rate = k[A]2[B], k = 0.050 L2·mol−2·s−1, [A] = 0.10 mol·L−1, [B] = 0.20 mol·L−1
- Substitute: rate = 0.050 × (0.10)2 × 0.20
- Compute: (0.10)2 = 0.010 → 0.050 × 0.010 × 0.20 = 0.0001 = 1.0 × 10⁻⁴
- Units: L2·mol−2·s−1 × (mol·L−1)2 × (mol·L−1) → mol·L−1·s−1
rate = 1.0 × 10⁻⁴ mol·L−1·s−1
Summary
The rate law expresses how the rate depends on reactant concentrations. Orders and rate constants are determined from experimental data, and knowing them allows prediction of reaction rates under different conditions.