
Representations of Equilibrium
Quick Notes
- Particulate diagrams visualize chemical systems at the particle level.
- At equilibrium, both reactants and products are present; their relative amounts reflect the value of K.
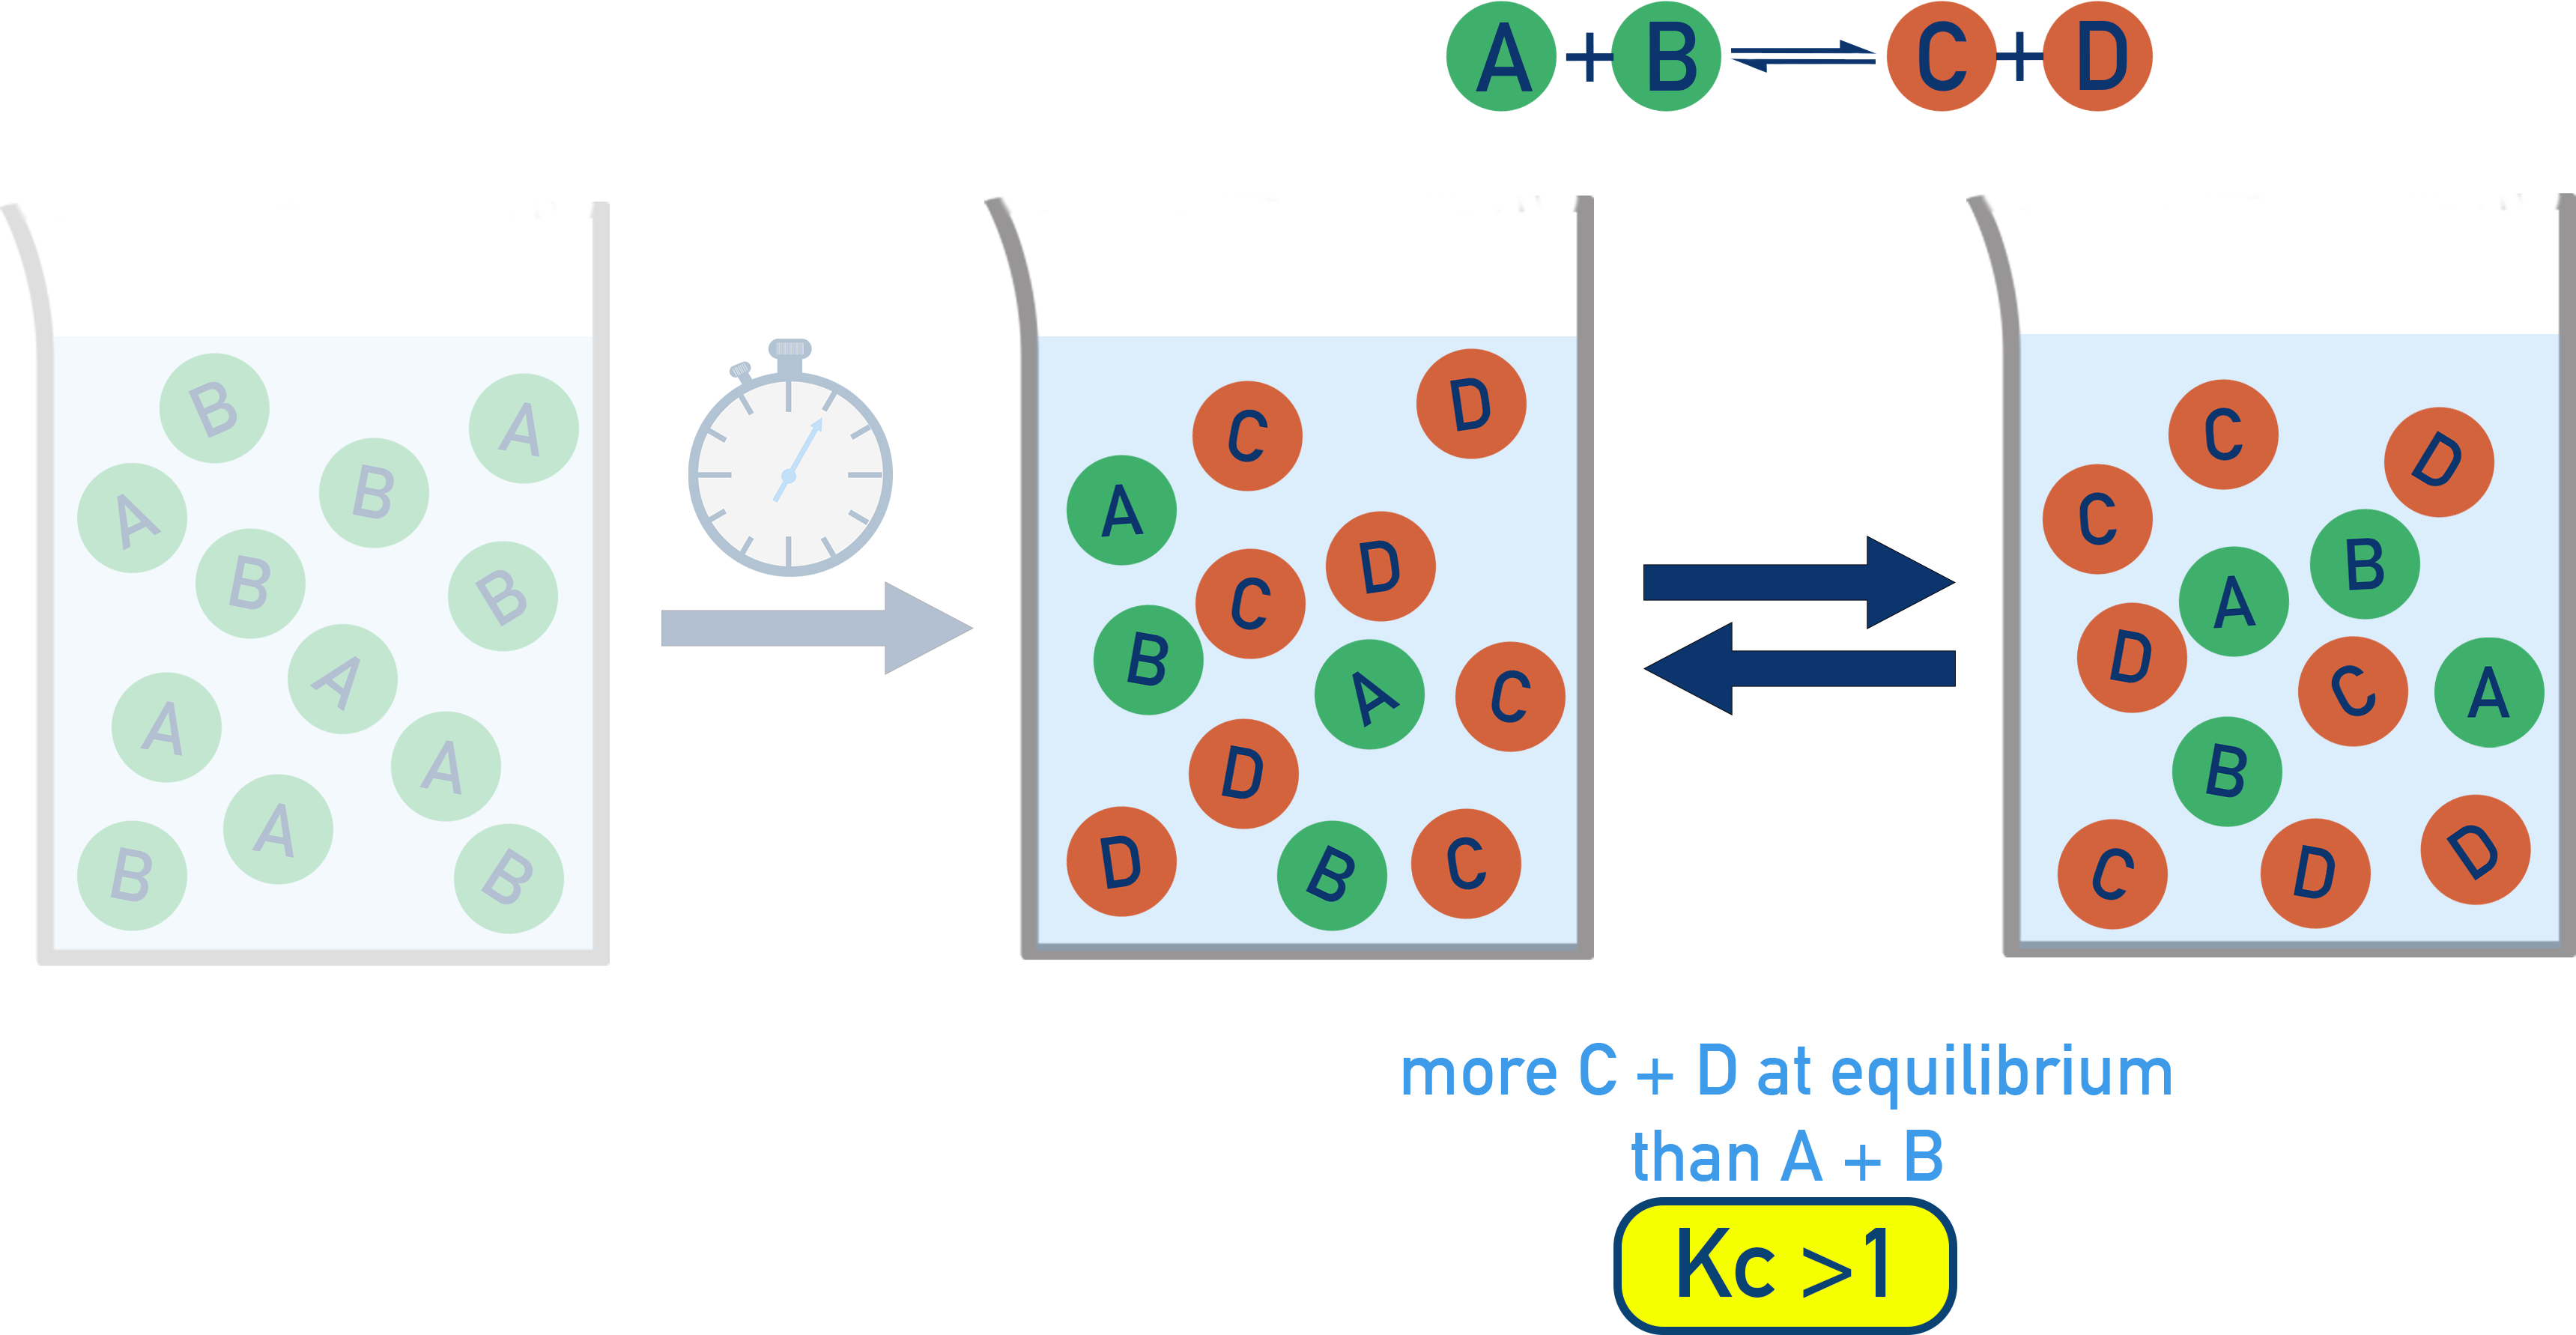
- K ≫ 1: mostly product particles at equilibrium.
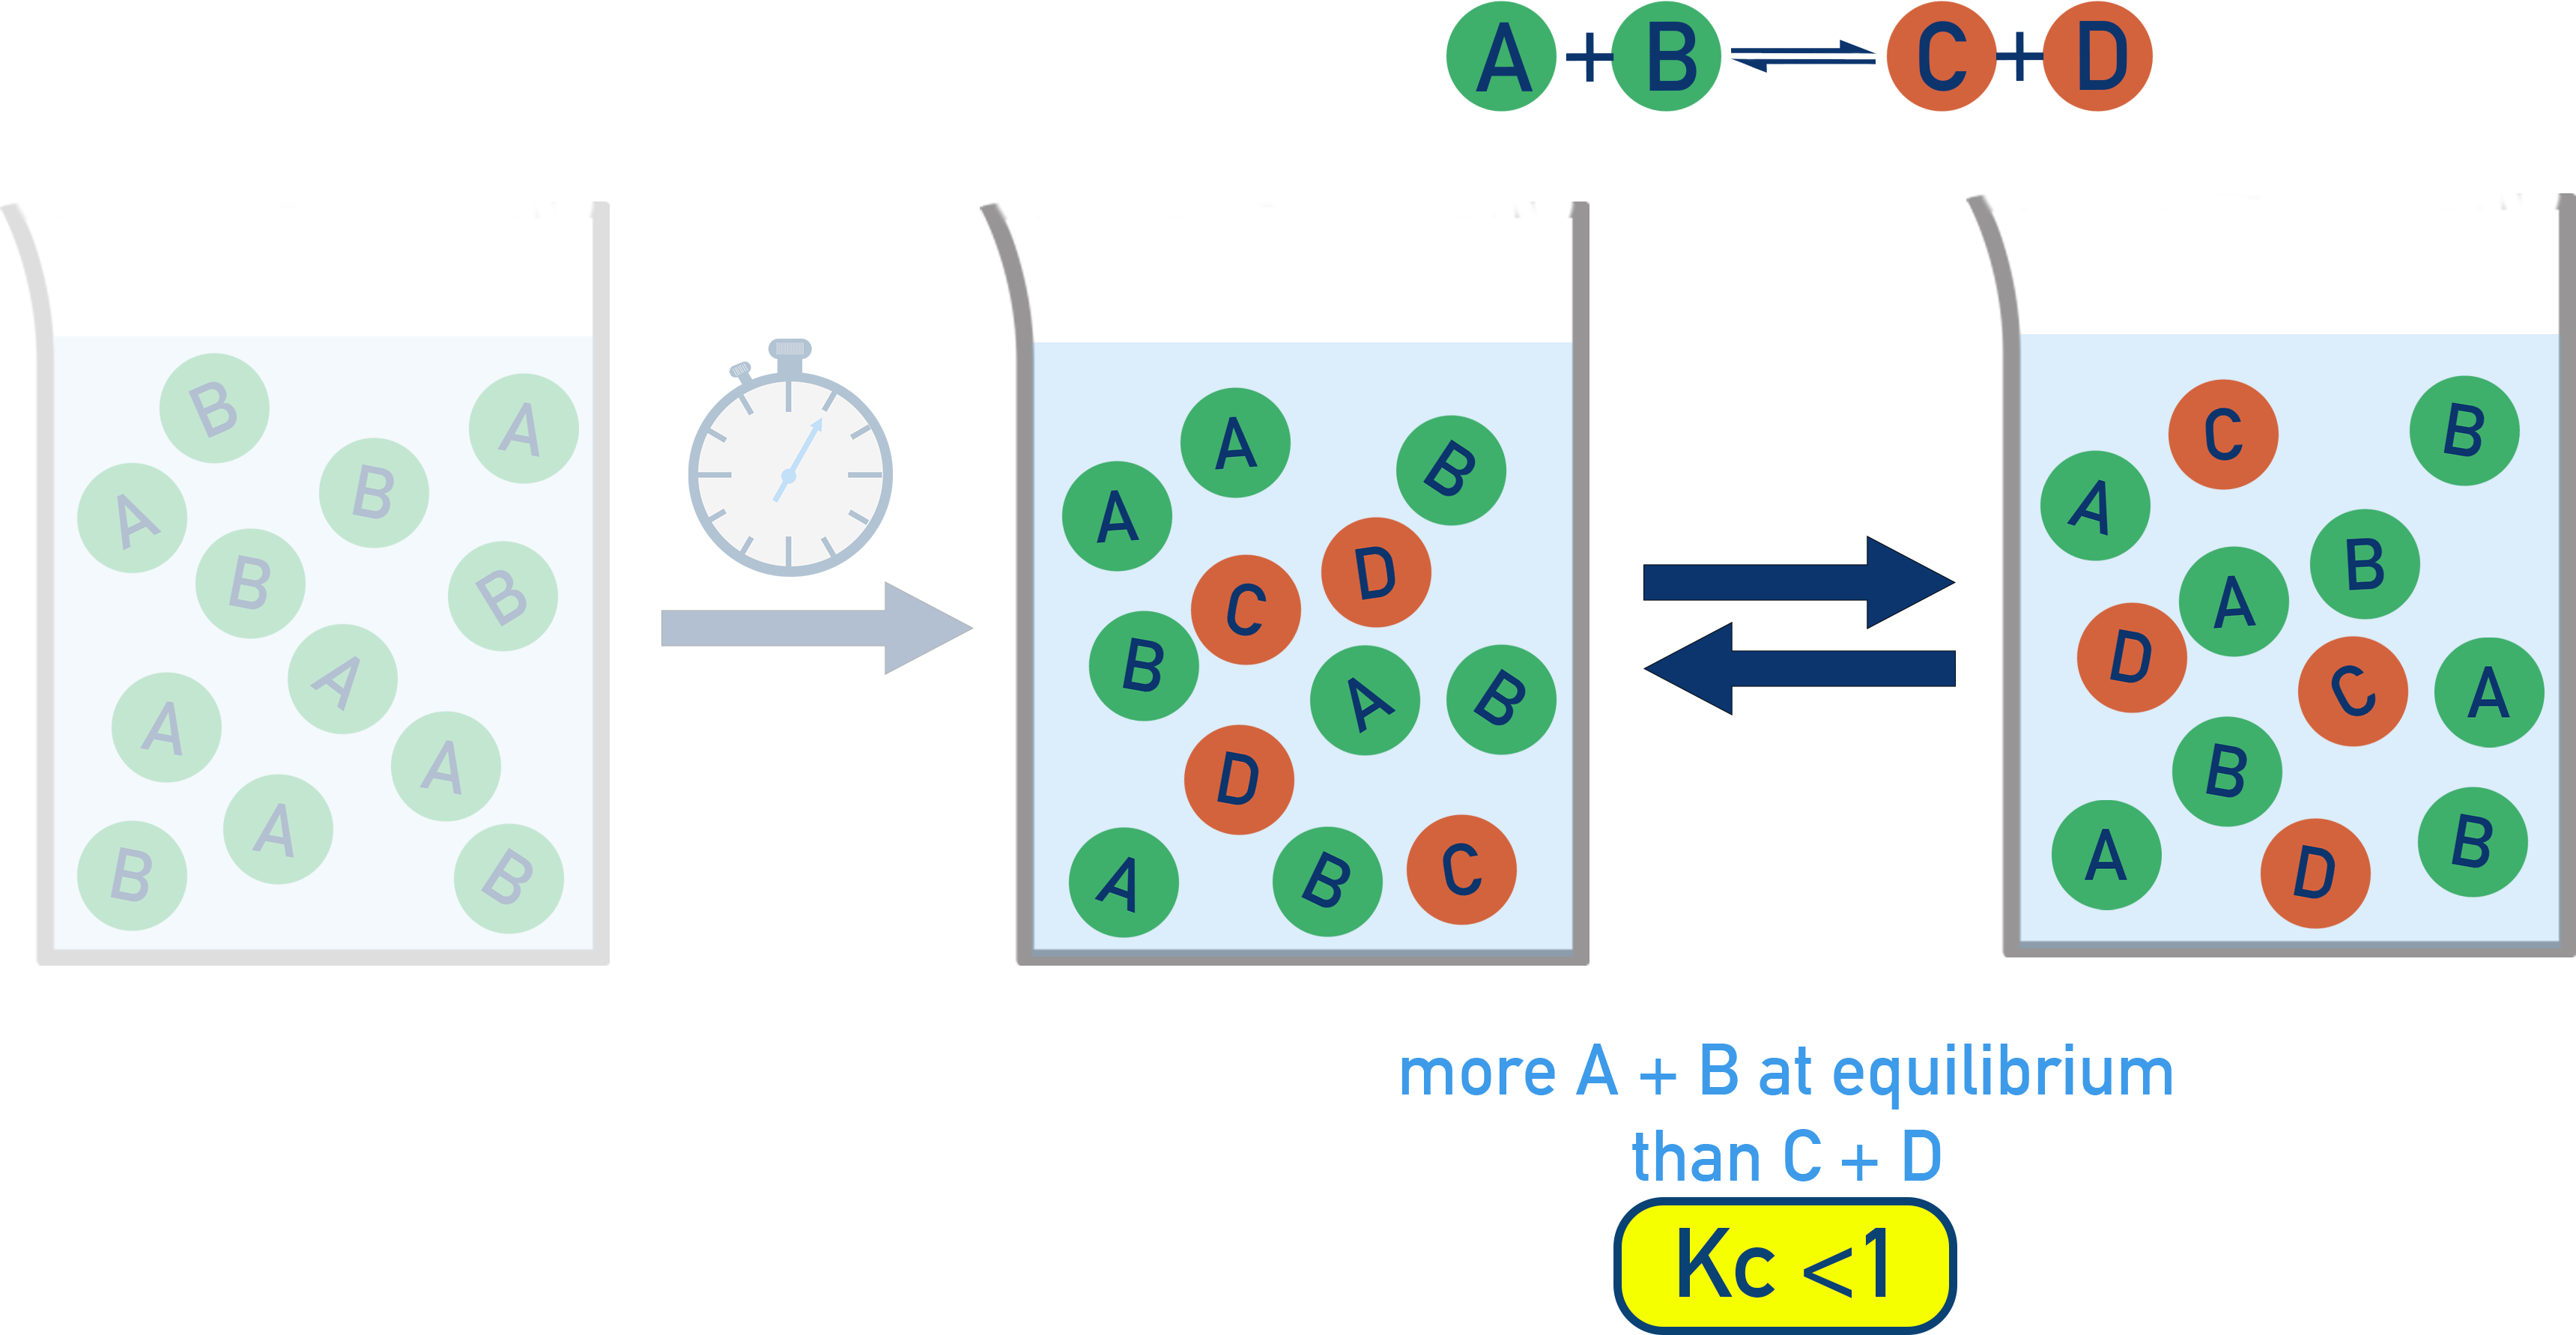
- K ≪ 1: mostly reactant particles at equilibrium.
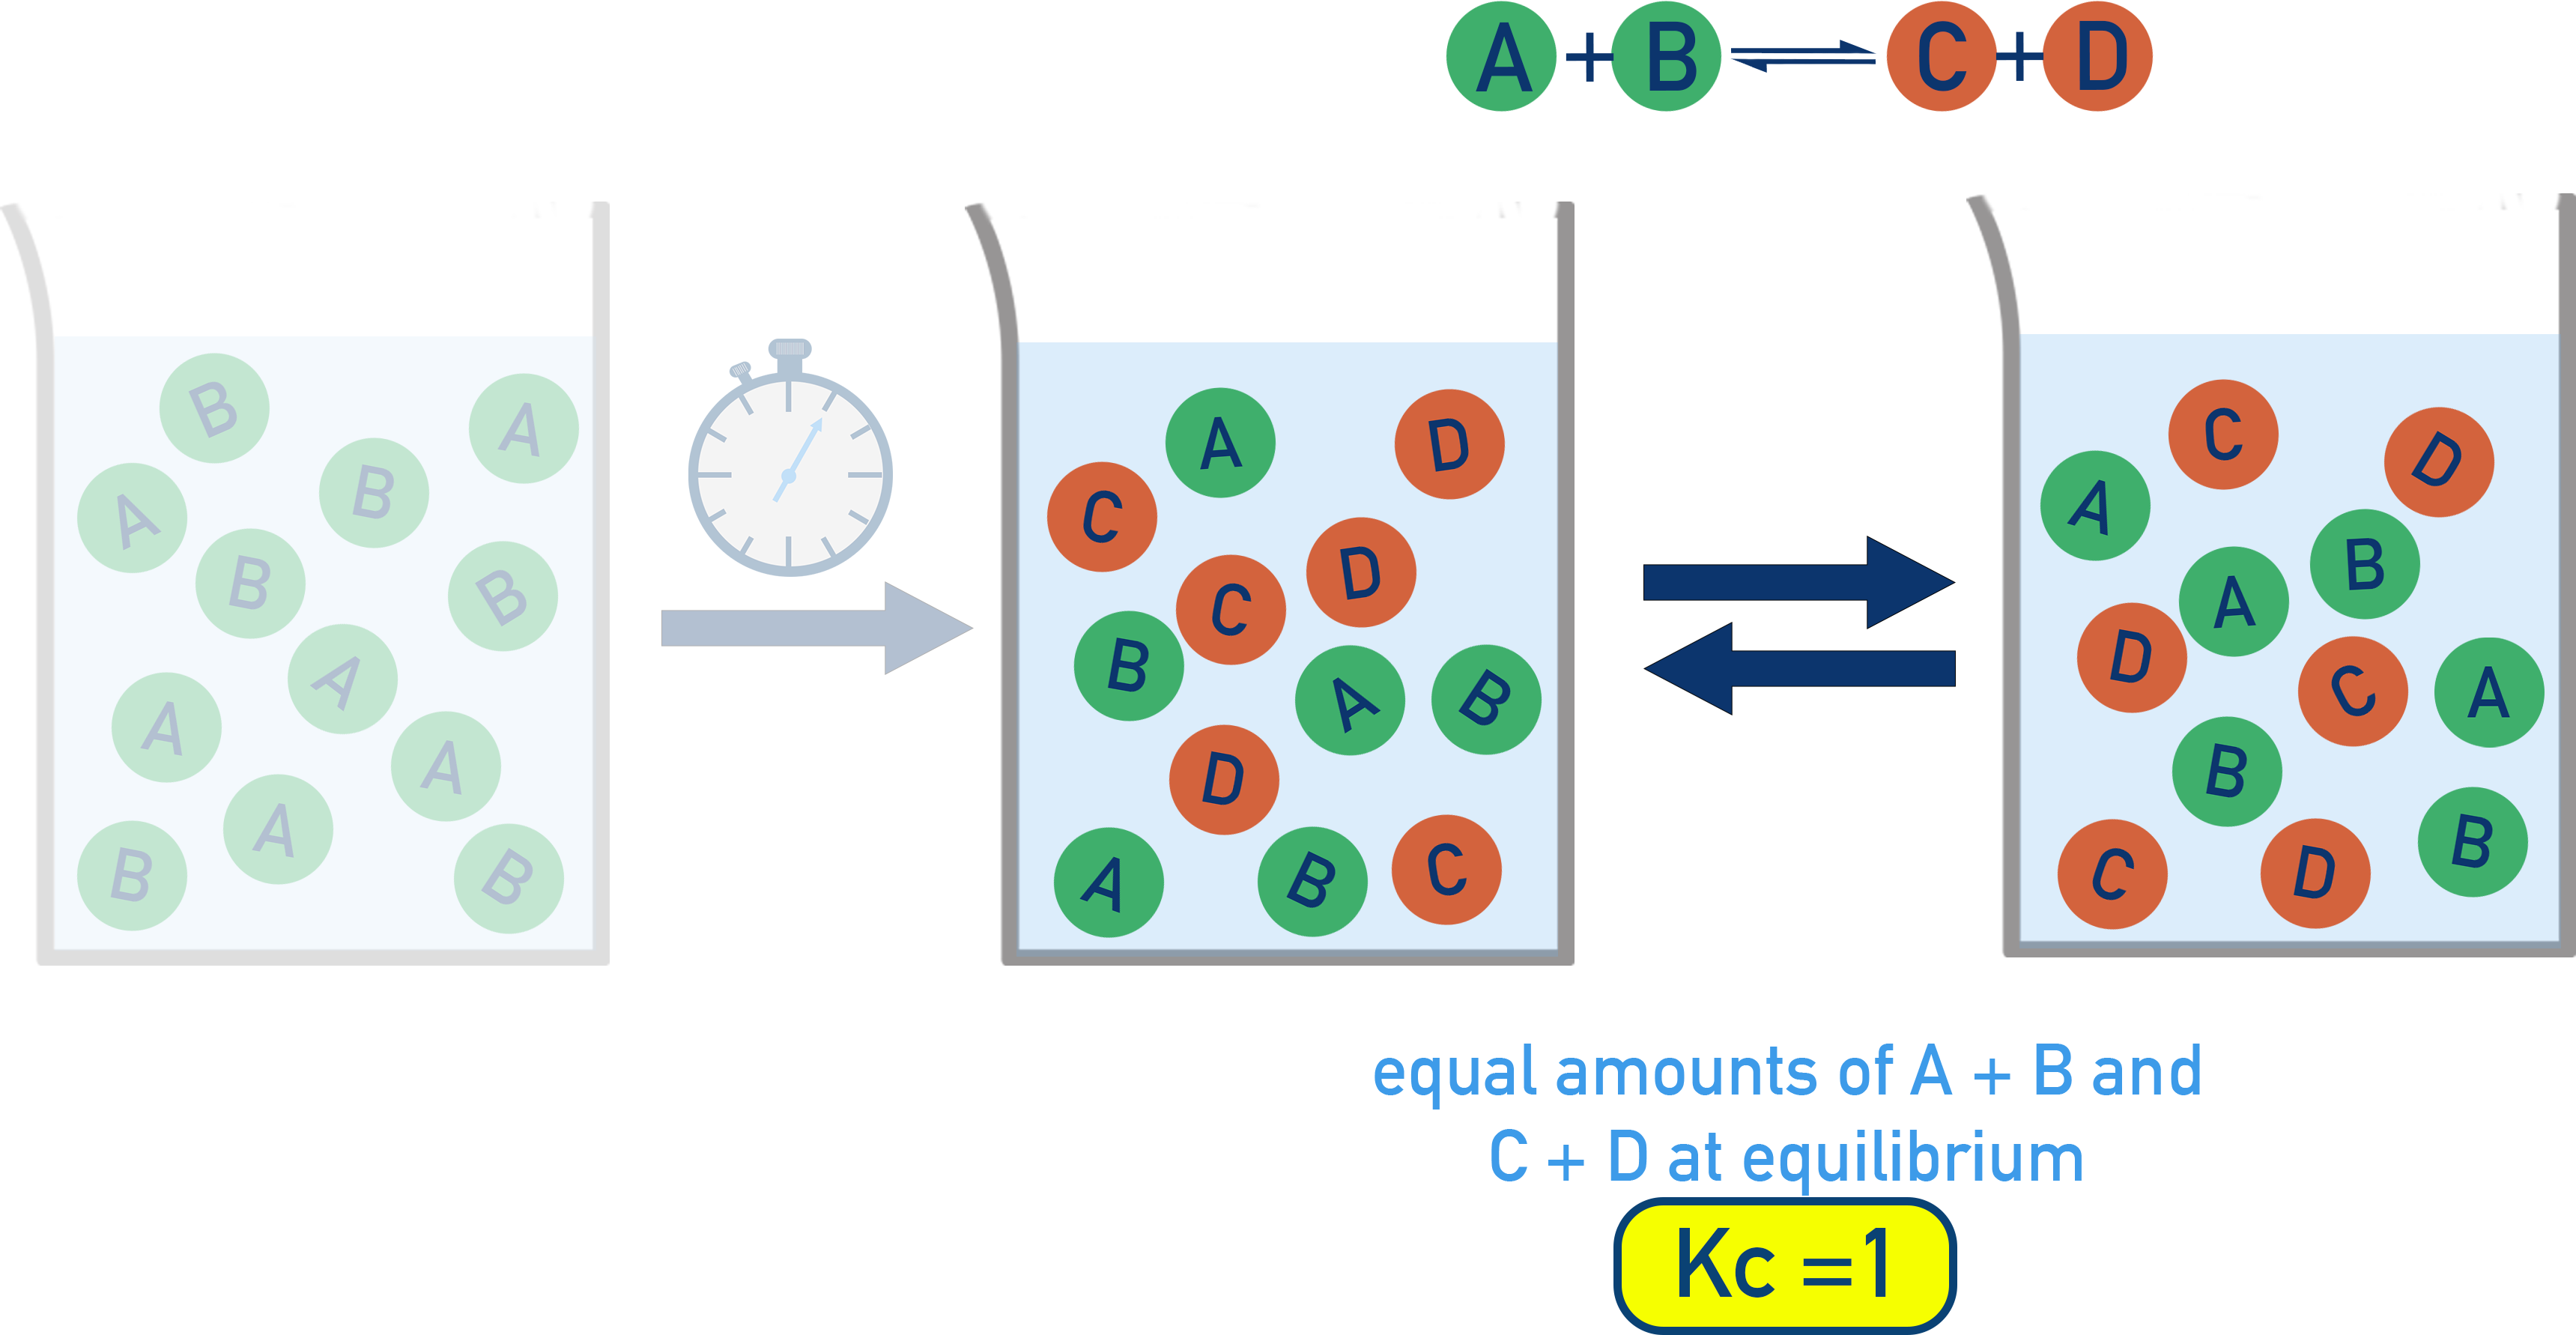
- K ≈ 1: similar amounts of reactants and products.
Full Notes
Particulate Models at Equilibrium
Particulate representations can be used to help show the proportions of reactant and product particles, the progress of a reversible reaction toward equilibrium, and the magnitude of the equilibrium constant K based on relative quantities of species.
Particulate representations can be used to help show the proportions of reactant and product particles, the progress of a reversible reaction toward equilibrium, and the magnitude of the equilibrium constant K based on relative quantities of species.
Interpreting Equilibrium with Particles
Before equilibrium: typically more reactant particles than products (or vice versa, depending on the starting conditions). The reaction proceeds in the direction that reduces the imbalance between reactants and products until equilibrium is reached. See Q and K for more.
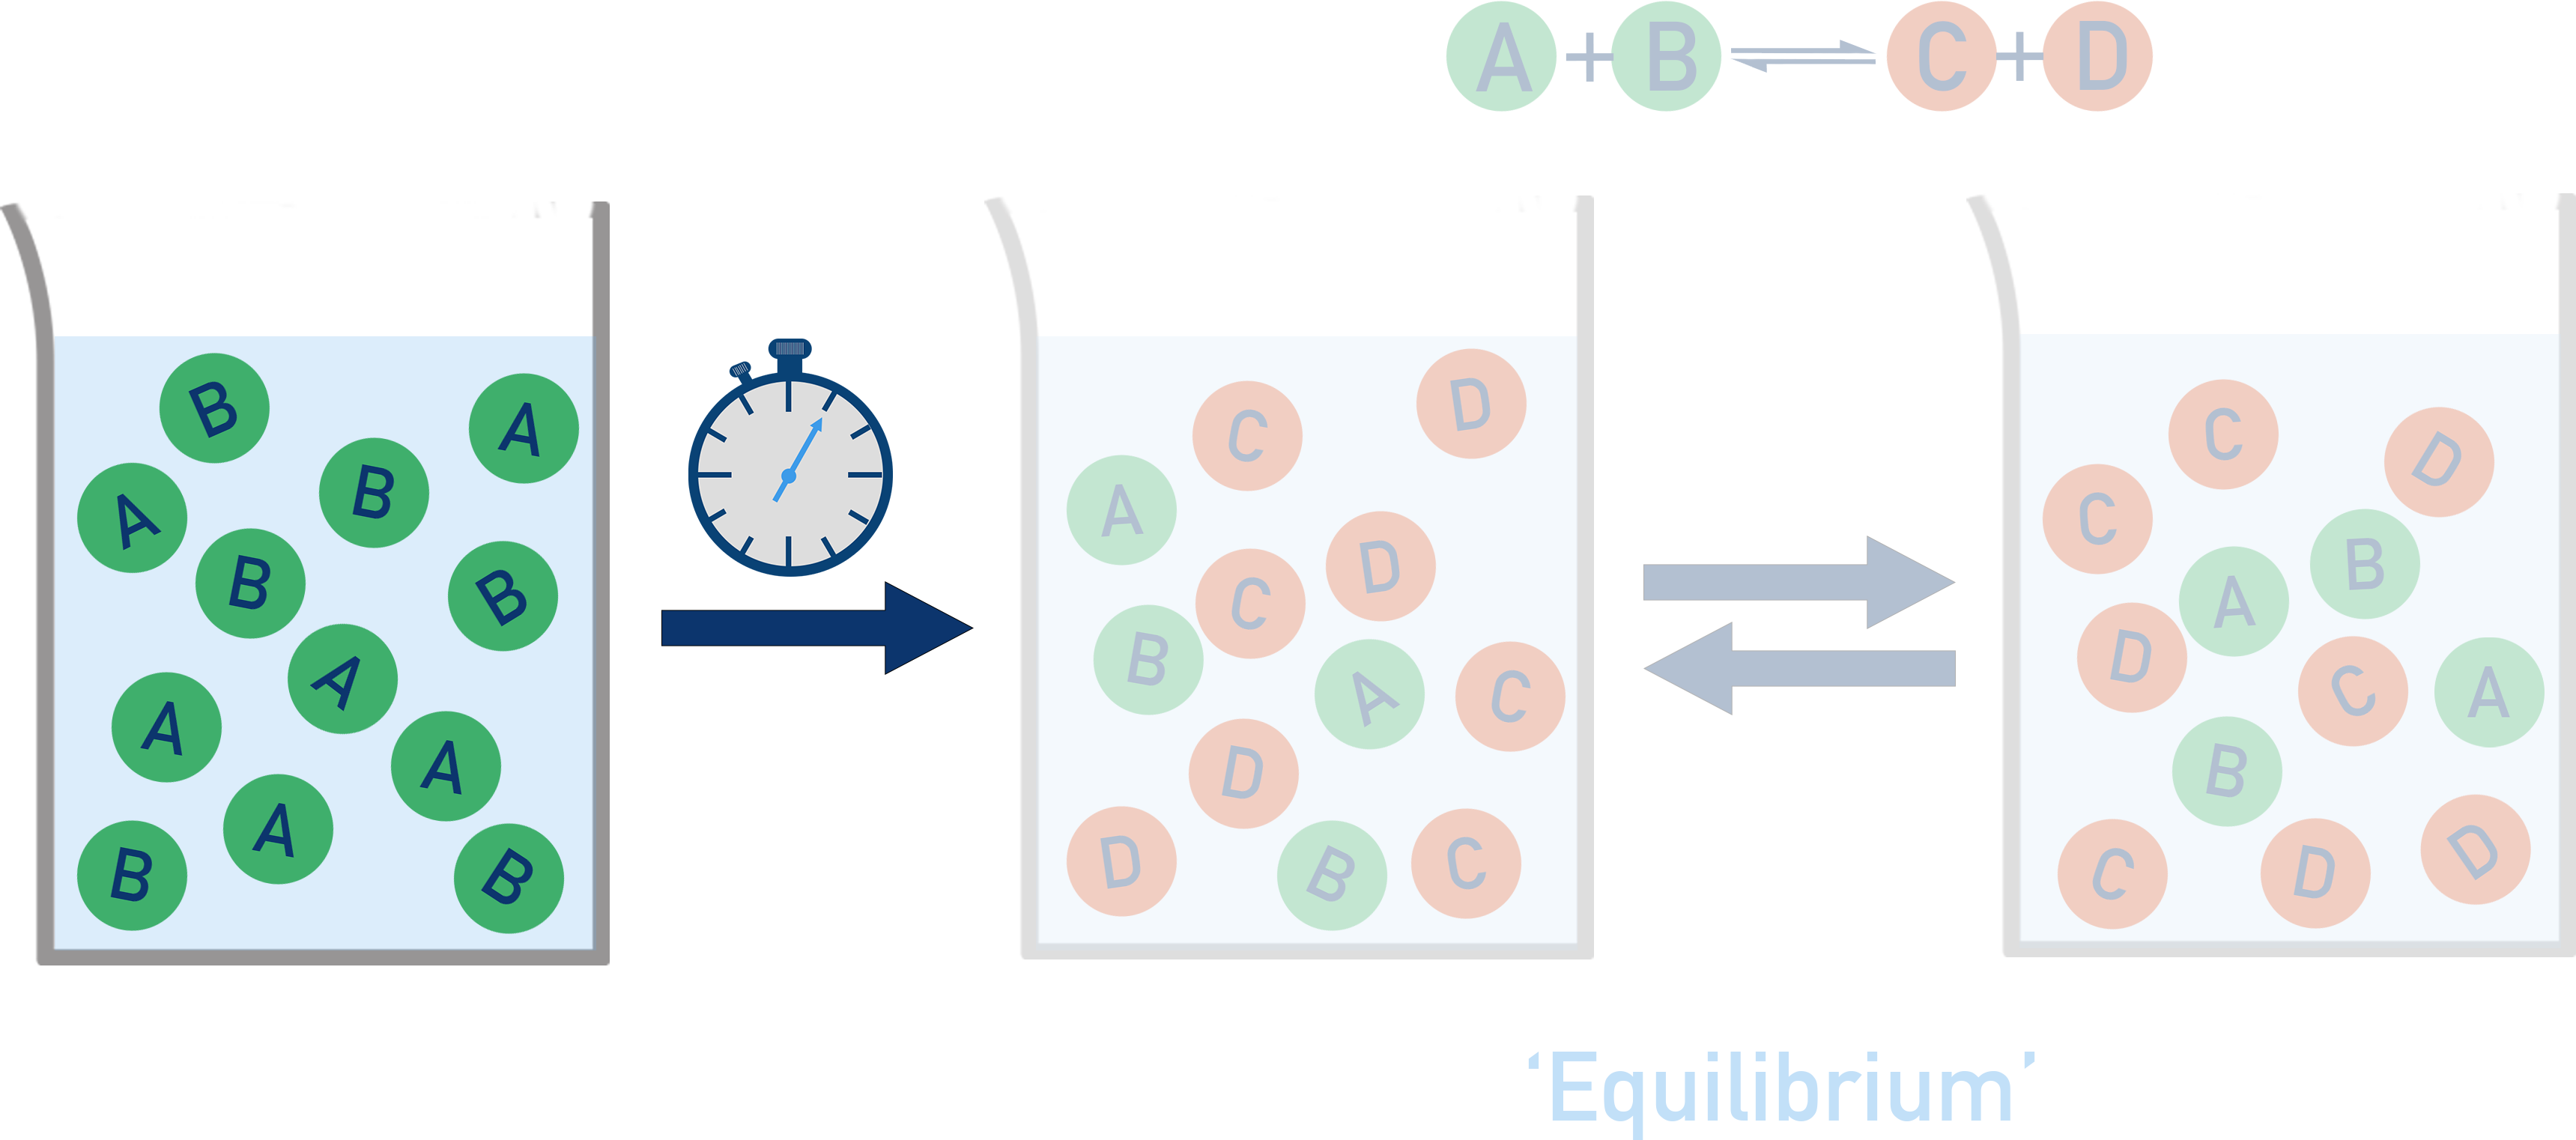
At equilibrium: there is no net change in particle numbers. Both reactants and products are present, and their ratio matches the equilibrium expression for the reaction and the value of K (Kc or Kp).
Value of K and Particle Ratios
- If K ≫ 1: mostly product particles → product-favored equilibrium.
- If K ≪ 1: mostly reactant particles → reactant-favored equilibrium.
- If K ≈ 1: similar amounts of reactants and products → balanced equilibrium.

When reading particulate diagrams, count species and relate them to the balanced equation. The ratio of products to reactants at equilibrium reflects the magnitude of K — not the drawing scale or particle size.
Summary
- Particulate models illustrate the relative numbers of particles in an equilibrium mixture.
- They show whether a system is reactant-favored, product-favored, or balanced based on K.