
Multistep Reaction Energy Profiles
Learning Objective 5.10.A
Represent the activation energy and overall energy change in a multistep reaction with a reaction energy profile.
Quick Notes
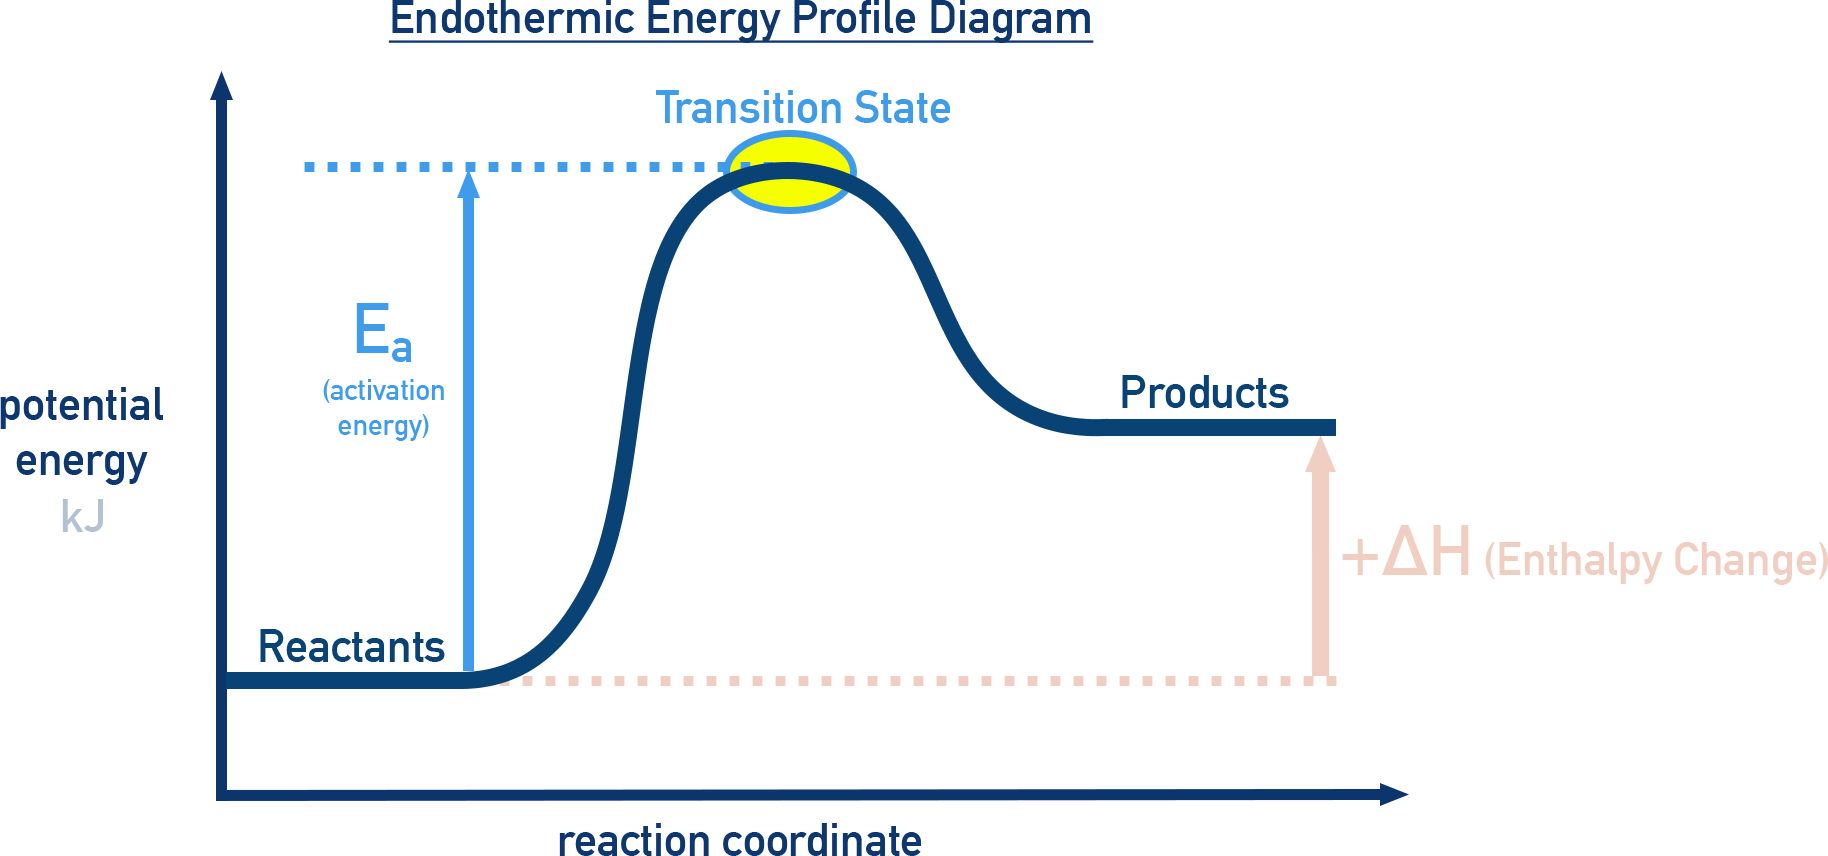
- A reaction energy profile shows the potential energy of a system as it progresses from reactants to products.
- Multistep reactions have multiple peaks and valleys:
- Each peak represents a transition state.
- Each valley corresponds to an intermediate.
- The highest peak determines the overall activation energy (difference in energy between reactants and the top of the peak).
- The difference between the reactants and products represents the overall energy change (ΔE or ΔH).
Full Notes
Recap – What Is a Reaction Energy Profile?
A reaction energy profile is a graph showing how the potential energy of a chemical system changes as the reaction progresses. See 5.6.
- The x-axis represents the reaction coordinate (progress of the reaction).
- The y-axis represents the potential energy of the system.
Example:
Interpreting Multistep Profiles
For a multistep mechanism, the profile has multiple humps, each corresponding to one elementary step.
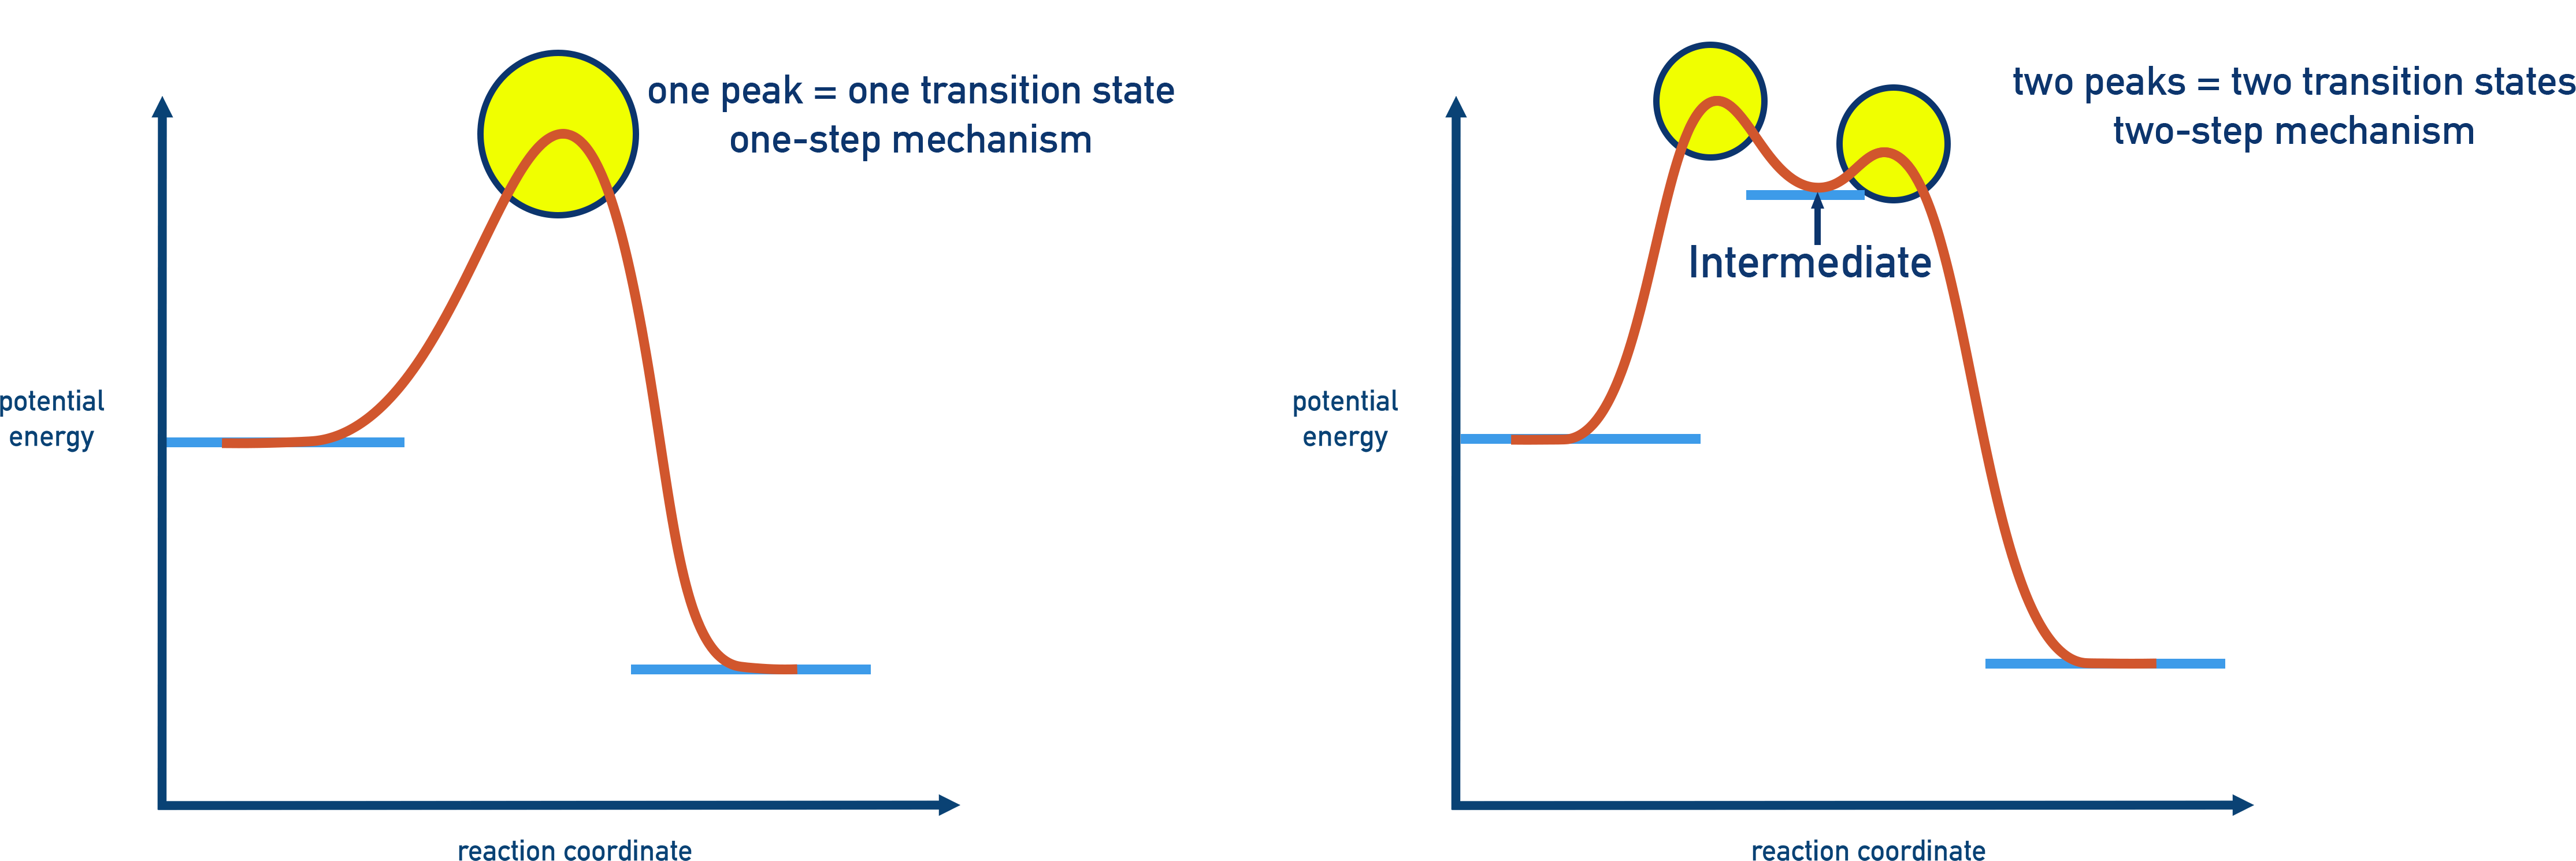
- Each peak = a transition state, where bonds are being broken and formed.
- Each valley = a reaction intermediate, a temporary species formed between steps.
- The highest peak = the rate-determining step (it has the largest activation energy).
- The overall energy change (ΔE) is the difference between the energy of the reactants and products.
Reaction Profiles and Rate-Limiting Steps
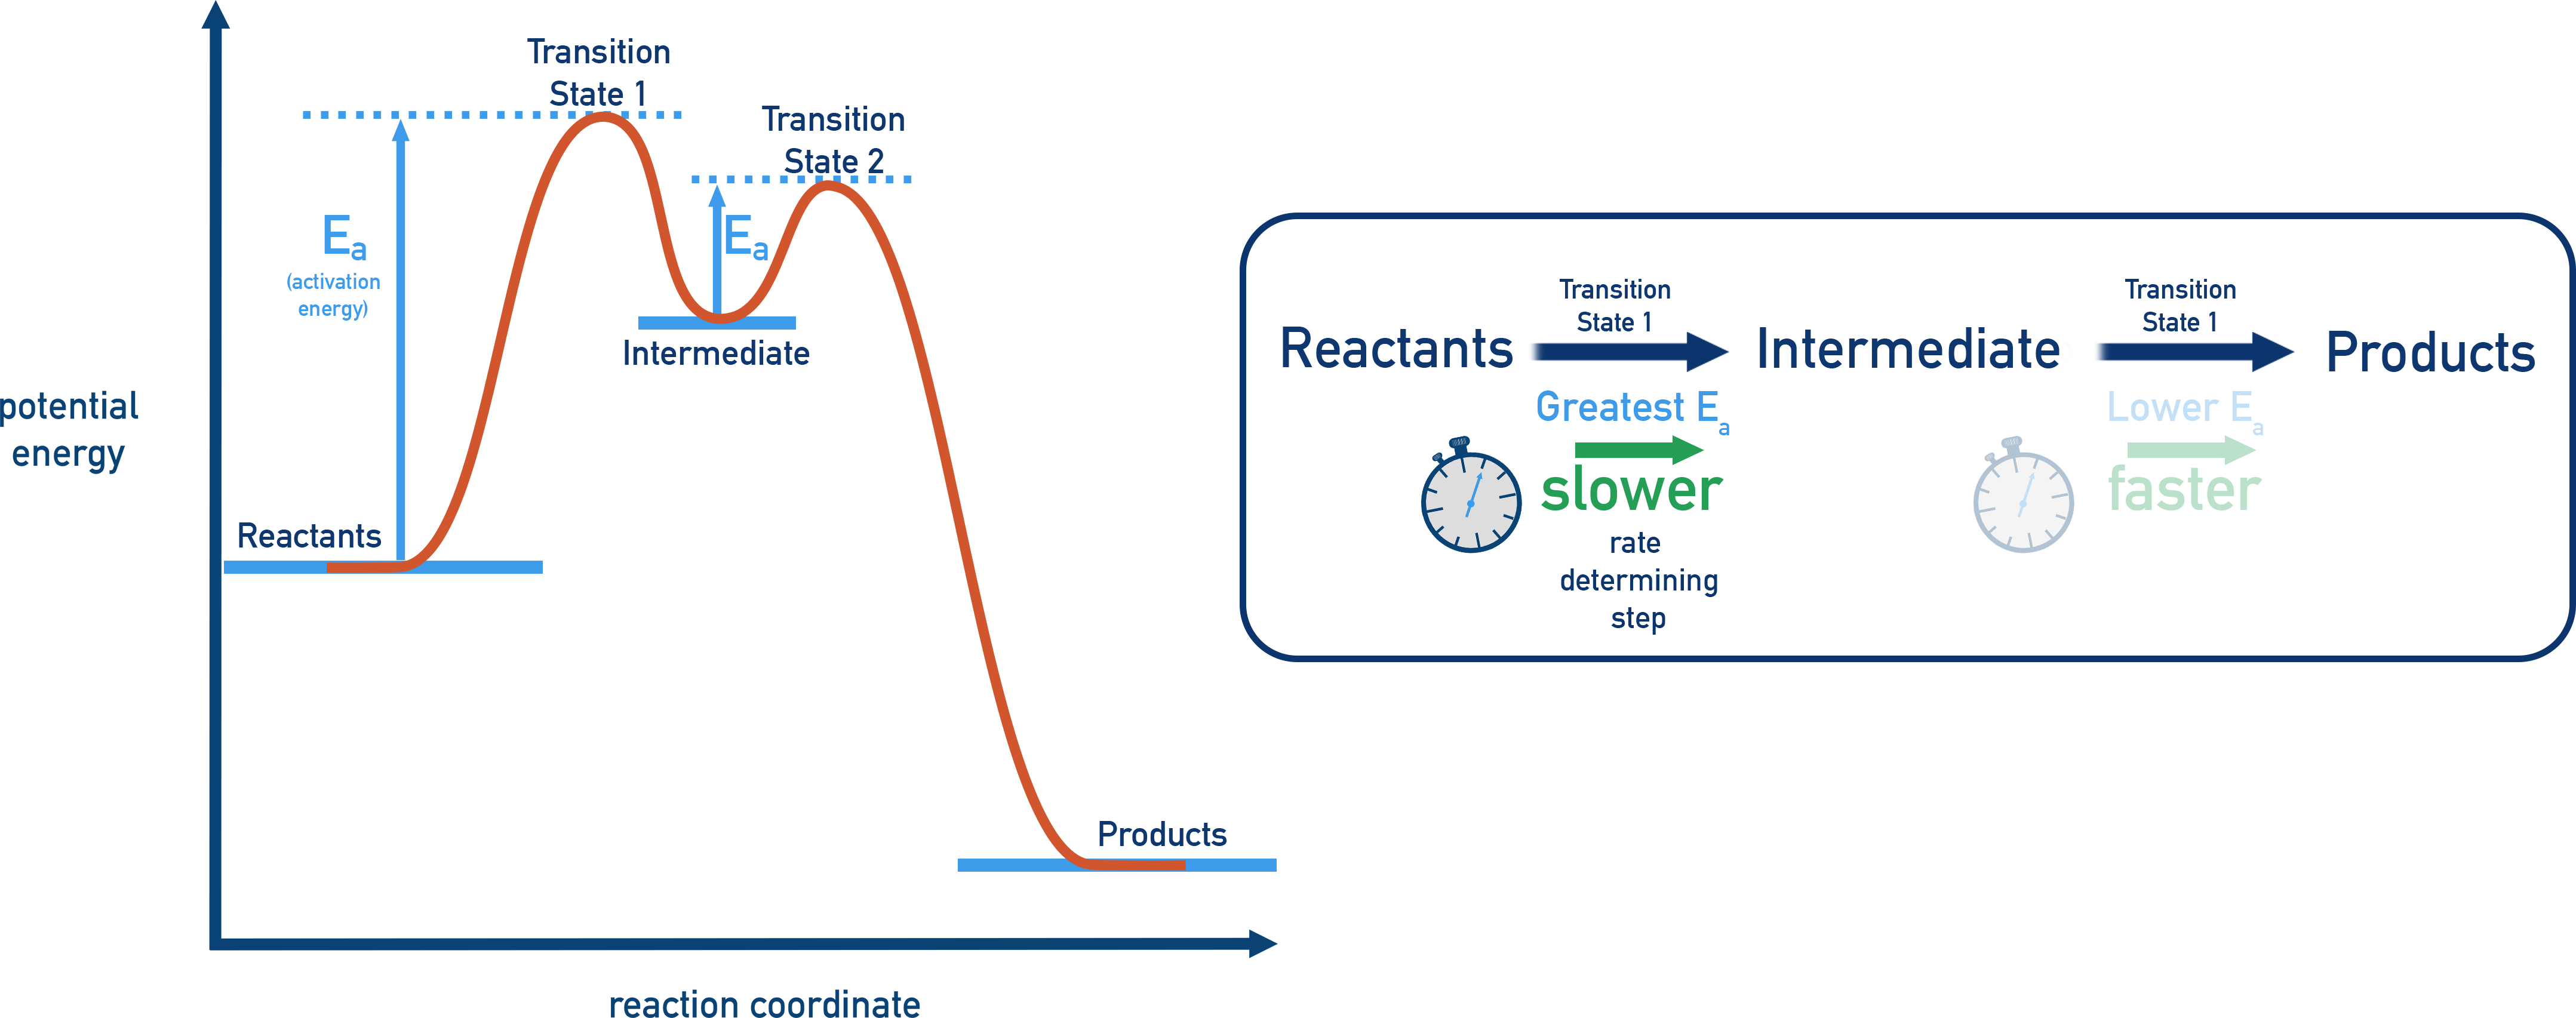
The tallest peak in a multi-step reaction pathway usually corresponds to the step with the highest activation energy (Ea). This is the slowest step and it controls the overall reaction rate.

Matt’s exam tip
Always count the number of peaks in the energy profile to determine how many steps are in the mechanism. The tallest peak usually corresponds to the slowest, rate-limiting step since the activation energy barrier is greatest at this transition state.
Summary
- A multistep reaction energy profile visually represents the energy changes during each elementary step in a mechanism.
- Each peak = transition state and each valley = an intermediate
- Peak with greatest activation energy corresponds to rate determining step.