
Photoelectron Spectroscopy
Quick Notes
- Photoelectron Spectroscopy (PES) measures the energy needed to remove electrons from different subshells of an atom.
- A PES spectrum shows:
- x-axis = binding energy (energy needed to remove electron)
- y-axis = relative number of electrons (peak height)
- Each peak corresponds to a subshell (e.g. 1s, 2s, 2p).
- Peak position (along x-axis) shows how tightly electrons are held — closer to nucleus = higher binding energy.
- Relative peak heights are proportional to the number of electrons in each subshell.
- PES data supports and reflects an atom’s ground-state electron configuration.
Full Notes
Photoelectron Spectroscopy (PES) is an experimental technique used to investigate the electronic structure of atoms.
It allows us to determine how much energy is needed to remove electrons from different subshells within an atom or ion. This energy is called binding energy.
- Electrons that are closer to the nucleus are more strongly attracted and require more energy to remove.
The data from PES is presented as a photoelectron spectrum.
Interpreting a PES Spectrum
Each peak represents electrons in a specific subshell. The height of the peak is proportional to the number of electrons in that subshell. The position of the peak (how far to the right on the x-axis) shows how strongly the electrons in the subshell are attracted to the nucleus of the atom.
- x-axis: binding energy (in megajoules per mole, MJ/mol or electronvolts, eV)
- y-axis: relative number of electrons (peak height)
Relationship to Electron Configuration
PES spectra can be directly linked to the ground-state (lowest possible energy) electron configuration of an atom or ion. Each group of peaks matches the electrons in different subshells.
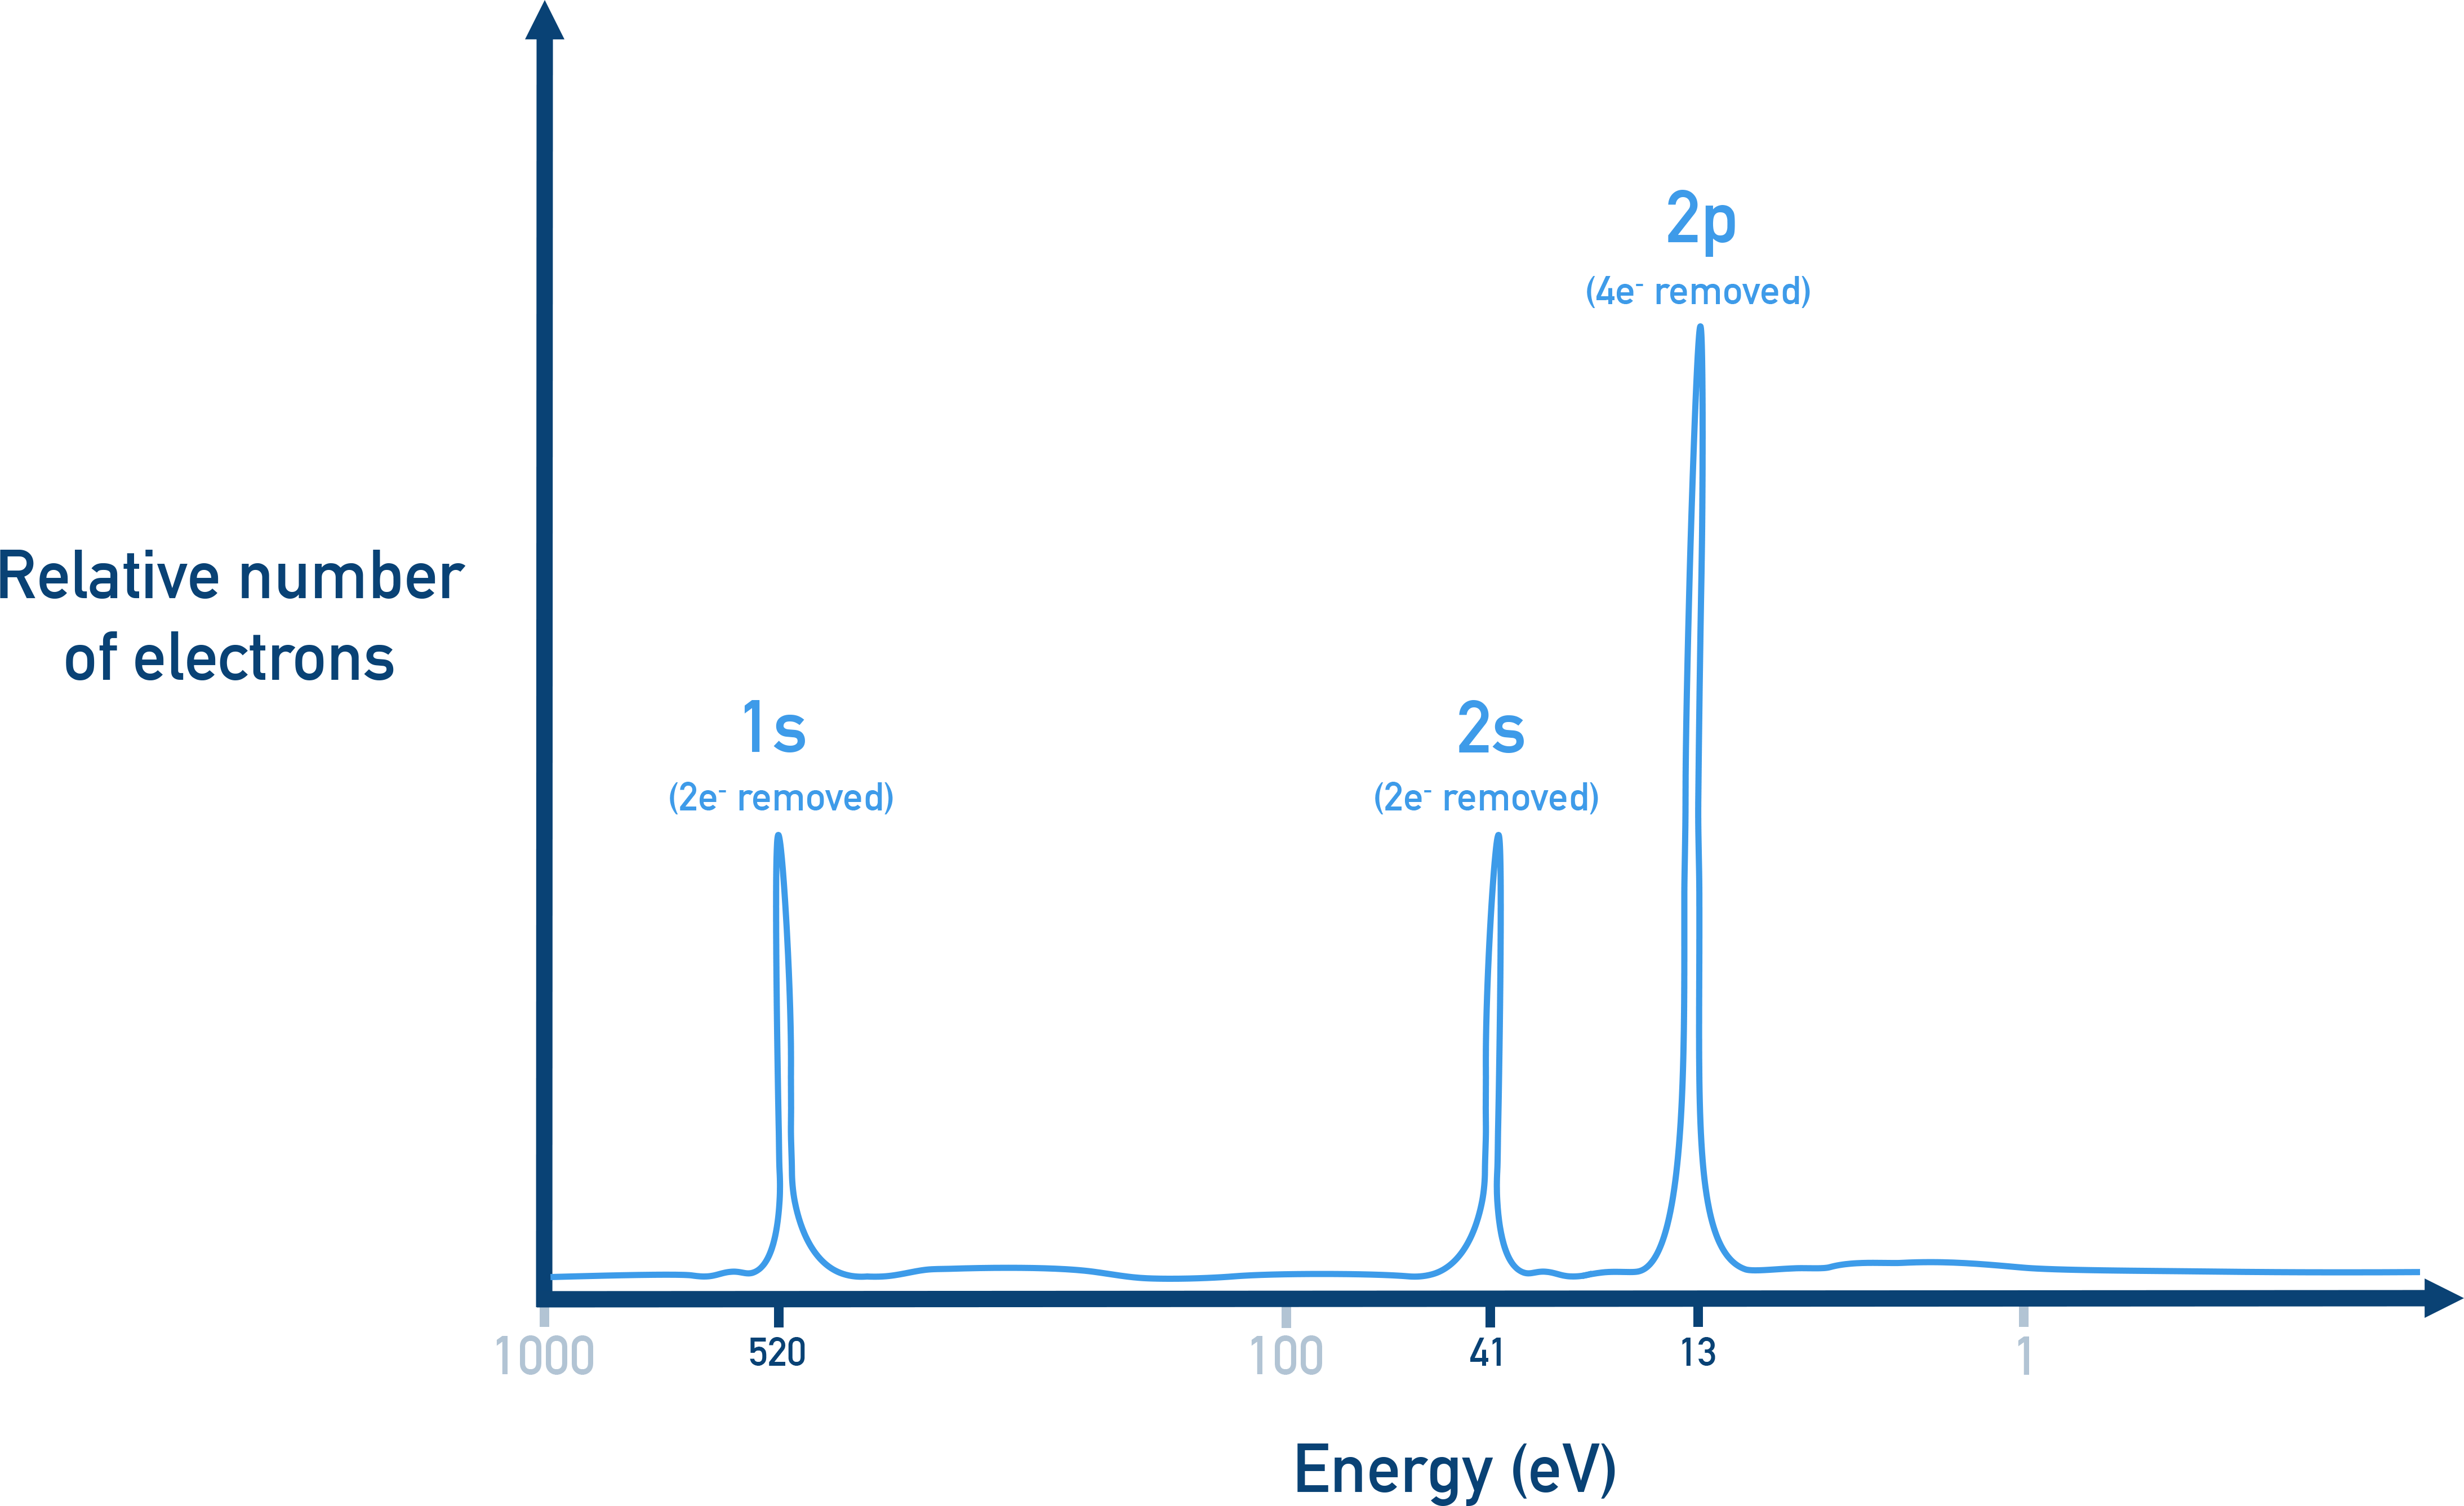
Example: A PES spectrum for oxygen (1s2 2s2 2p4) would show:
- One peak at high binding energy → 1s (2 electrons)
- One peak at lower energy → 2s (2 electrons)
- One larger peak at slightly lower energy than the 2s peak → 2p (4 electrons)
Interactions Between Electrons and the Nucleus
Electrons in inner shells are closer to the positively charged nucleus and are more strongly attracted, which means they require more energy to remove (greater binding energy).
Shielding from inner electrons reduces the attraction felt by outer electrons, lowering their binding energy and making them easier to remove.
These effects are visible in a PES spectrum, where:
- Inner electrons (like 1s) show peaks at high binding energy
- Outer electrons (like 2p or 3p) show peaks at lower binding energy
Element X has a PES spectrum with the following features:
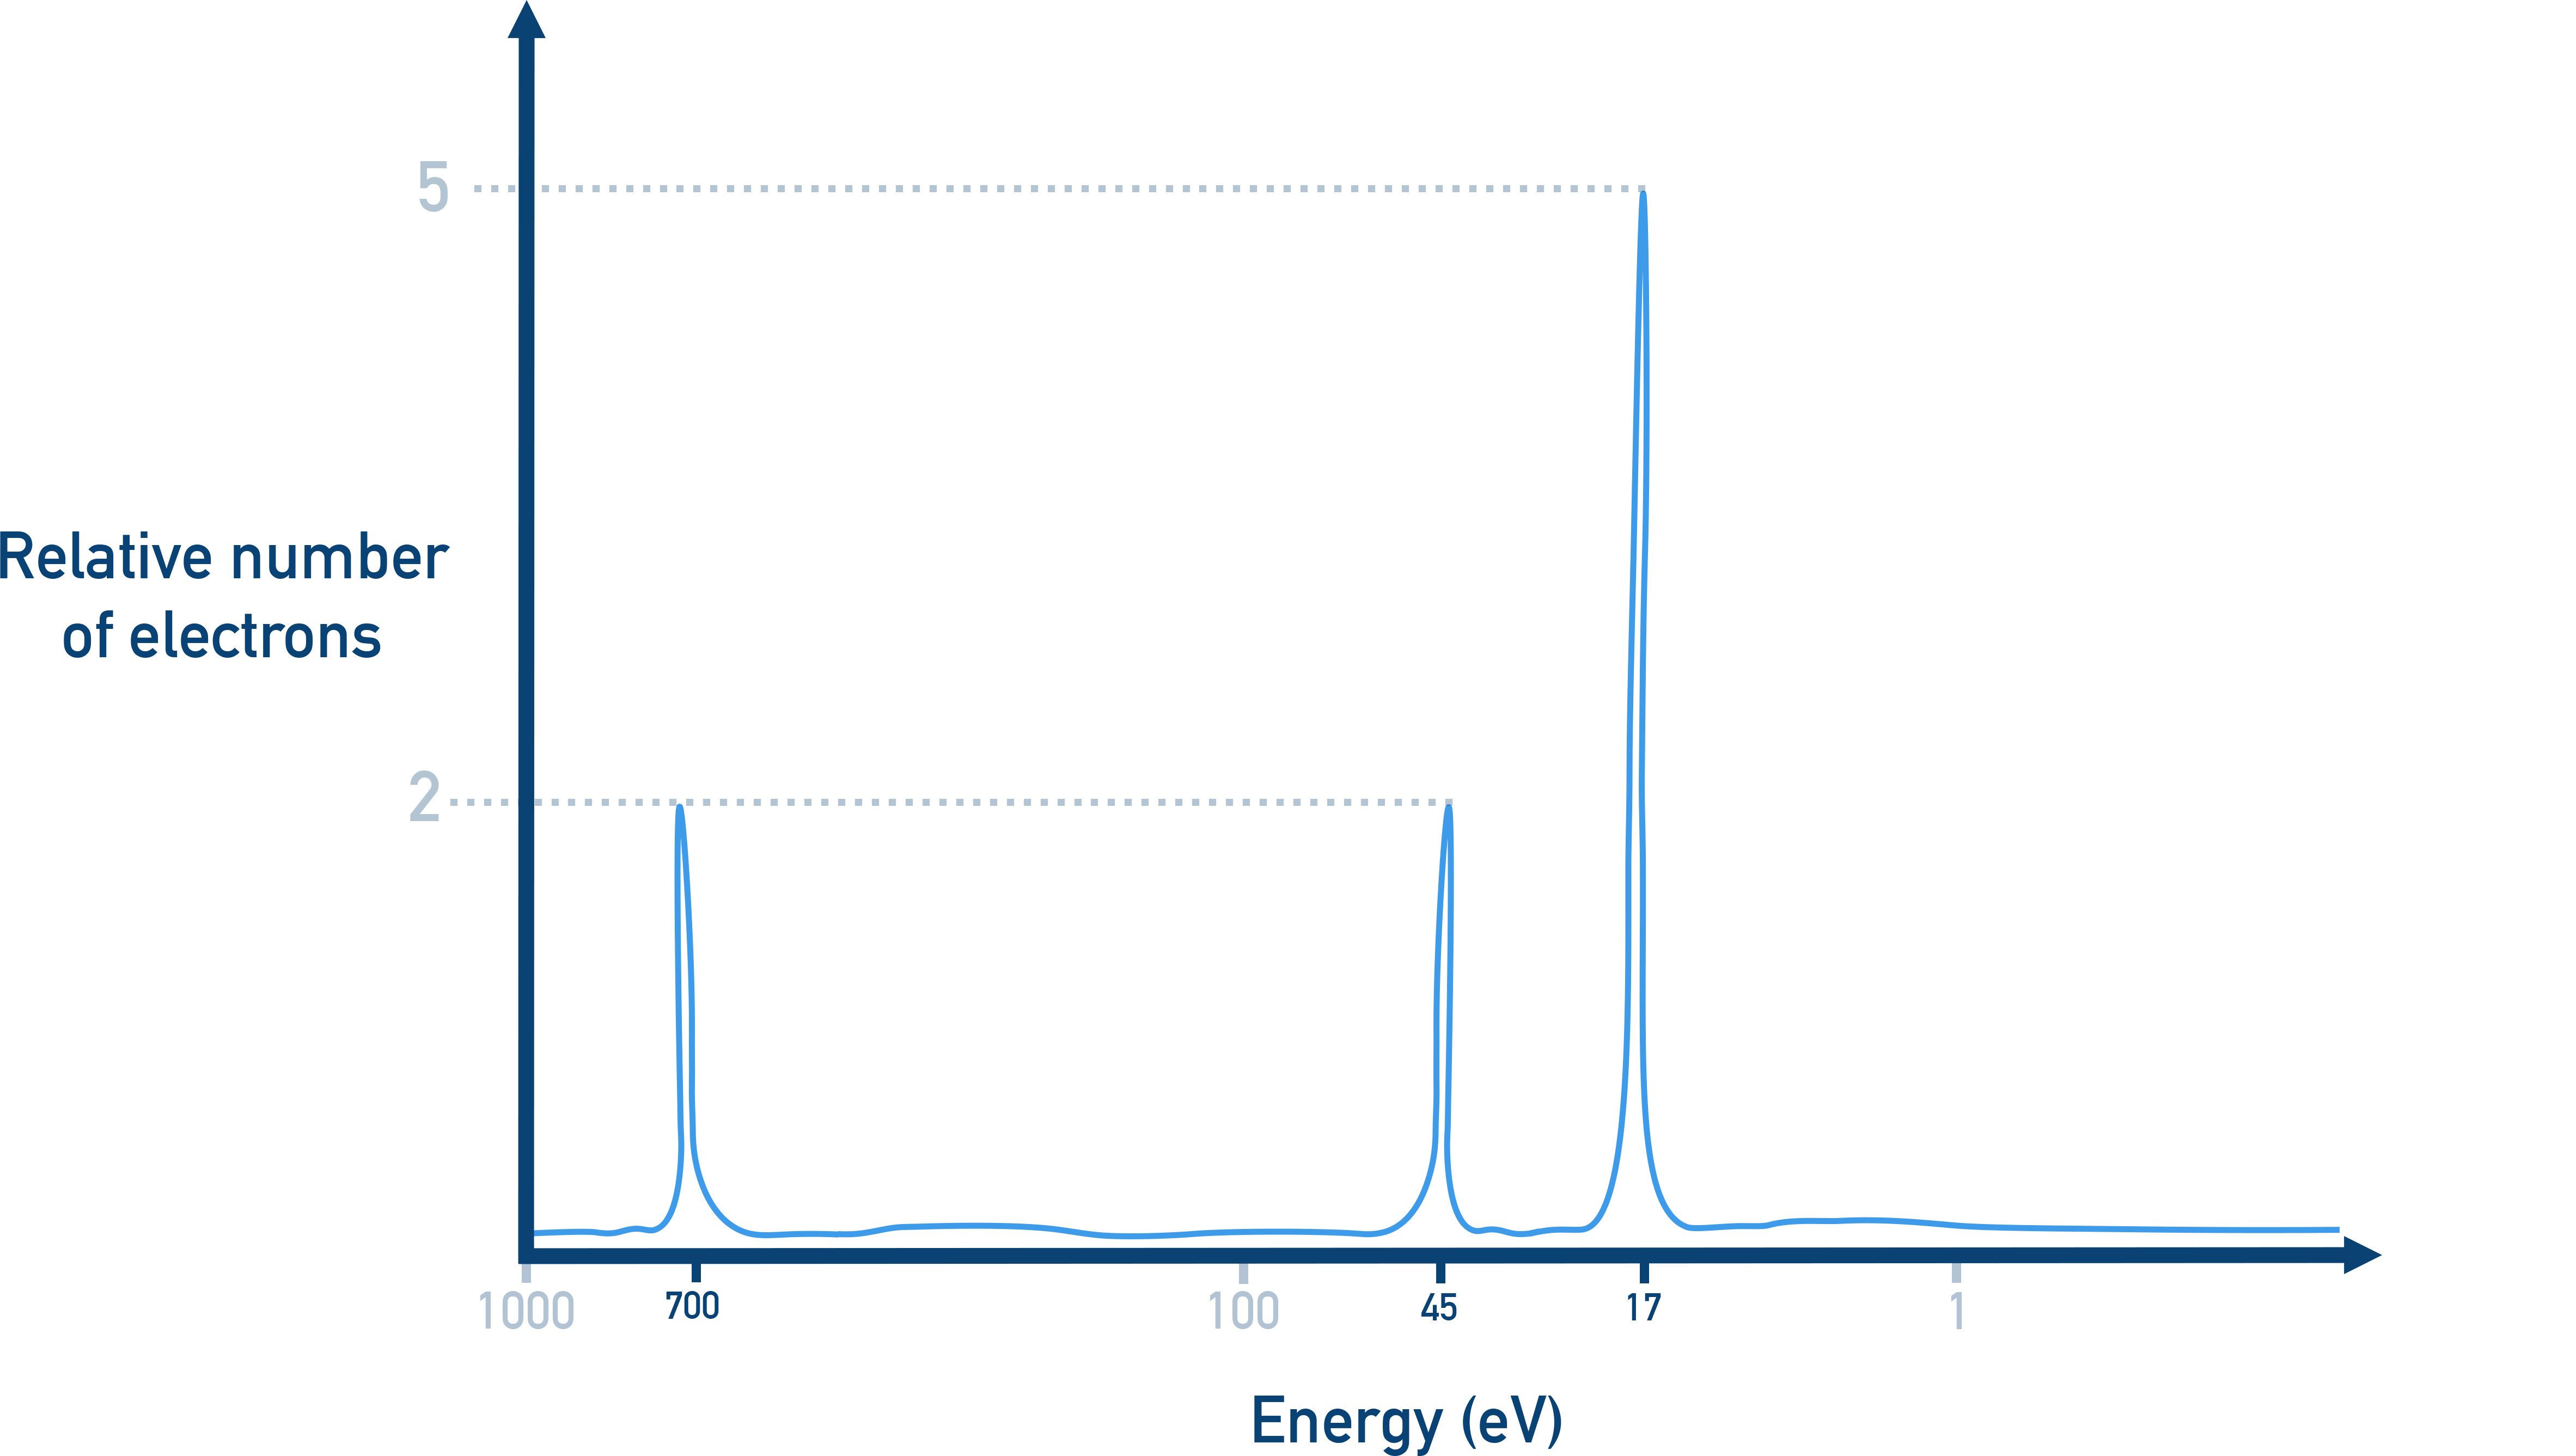
- One large peak at high binding energy
- One medium peak at intermediate energy
- One medium peak at low binding energy
Interpretation:
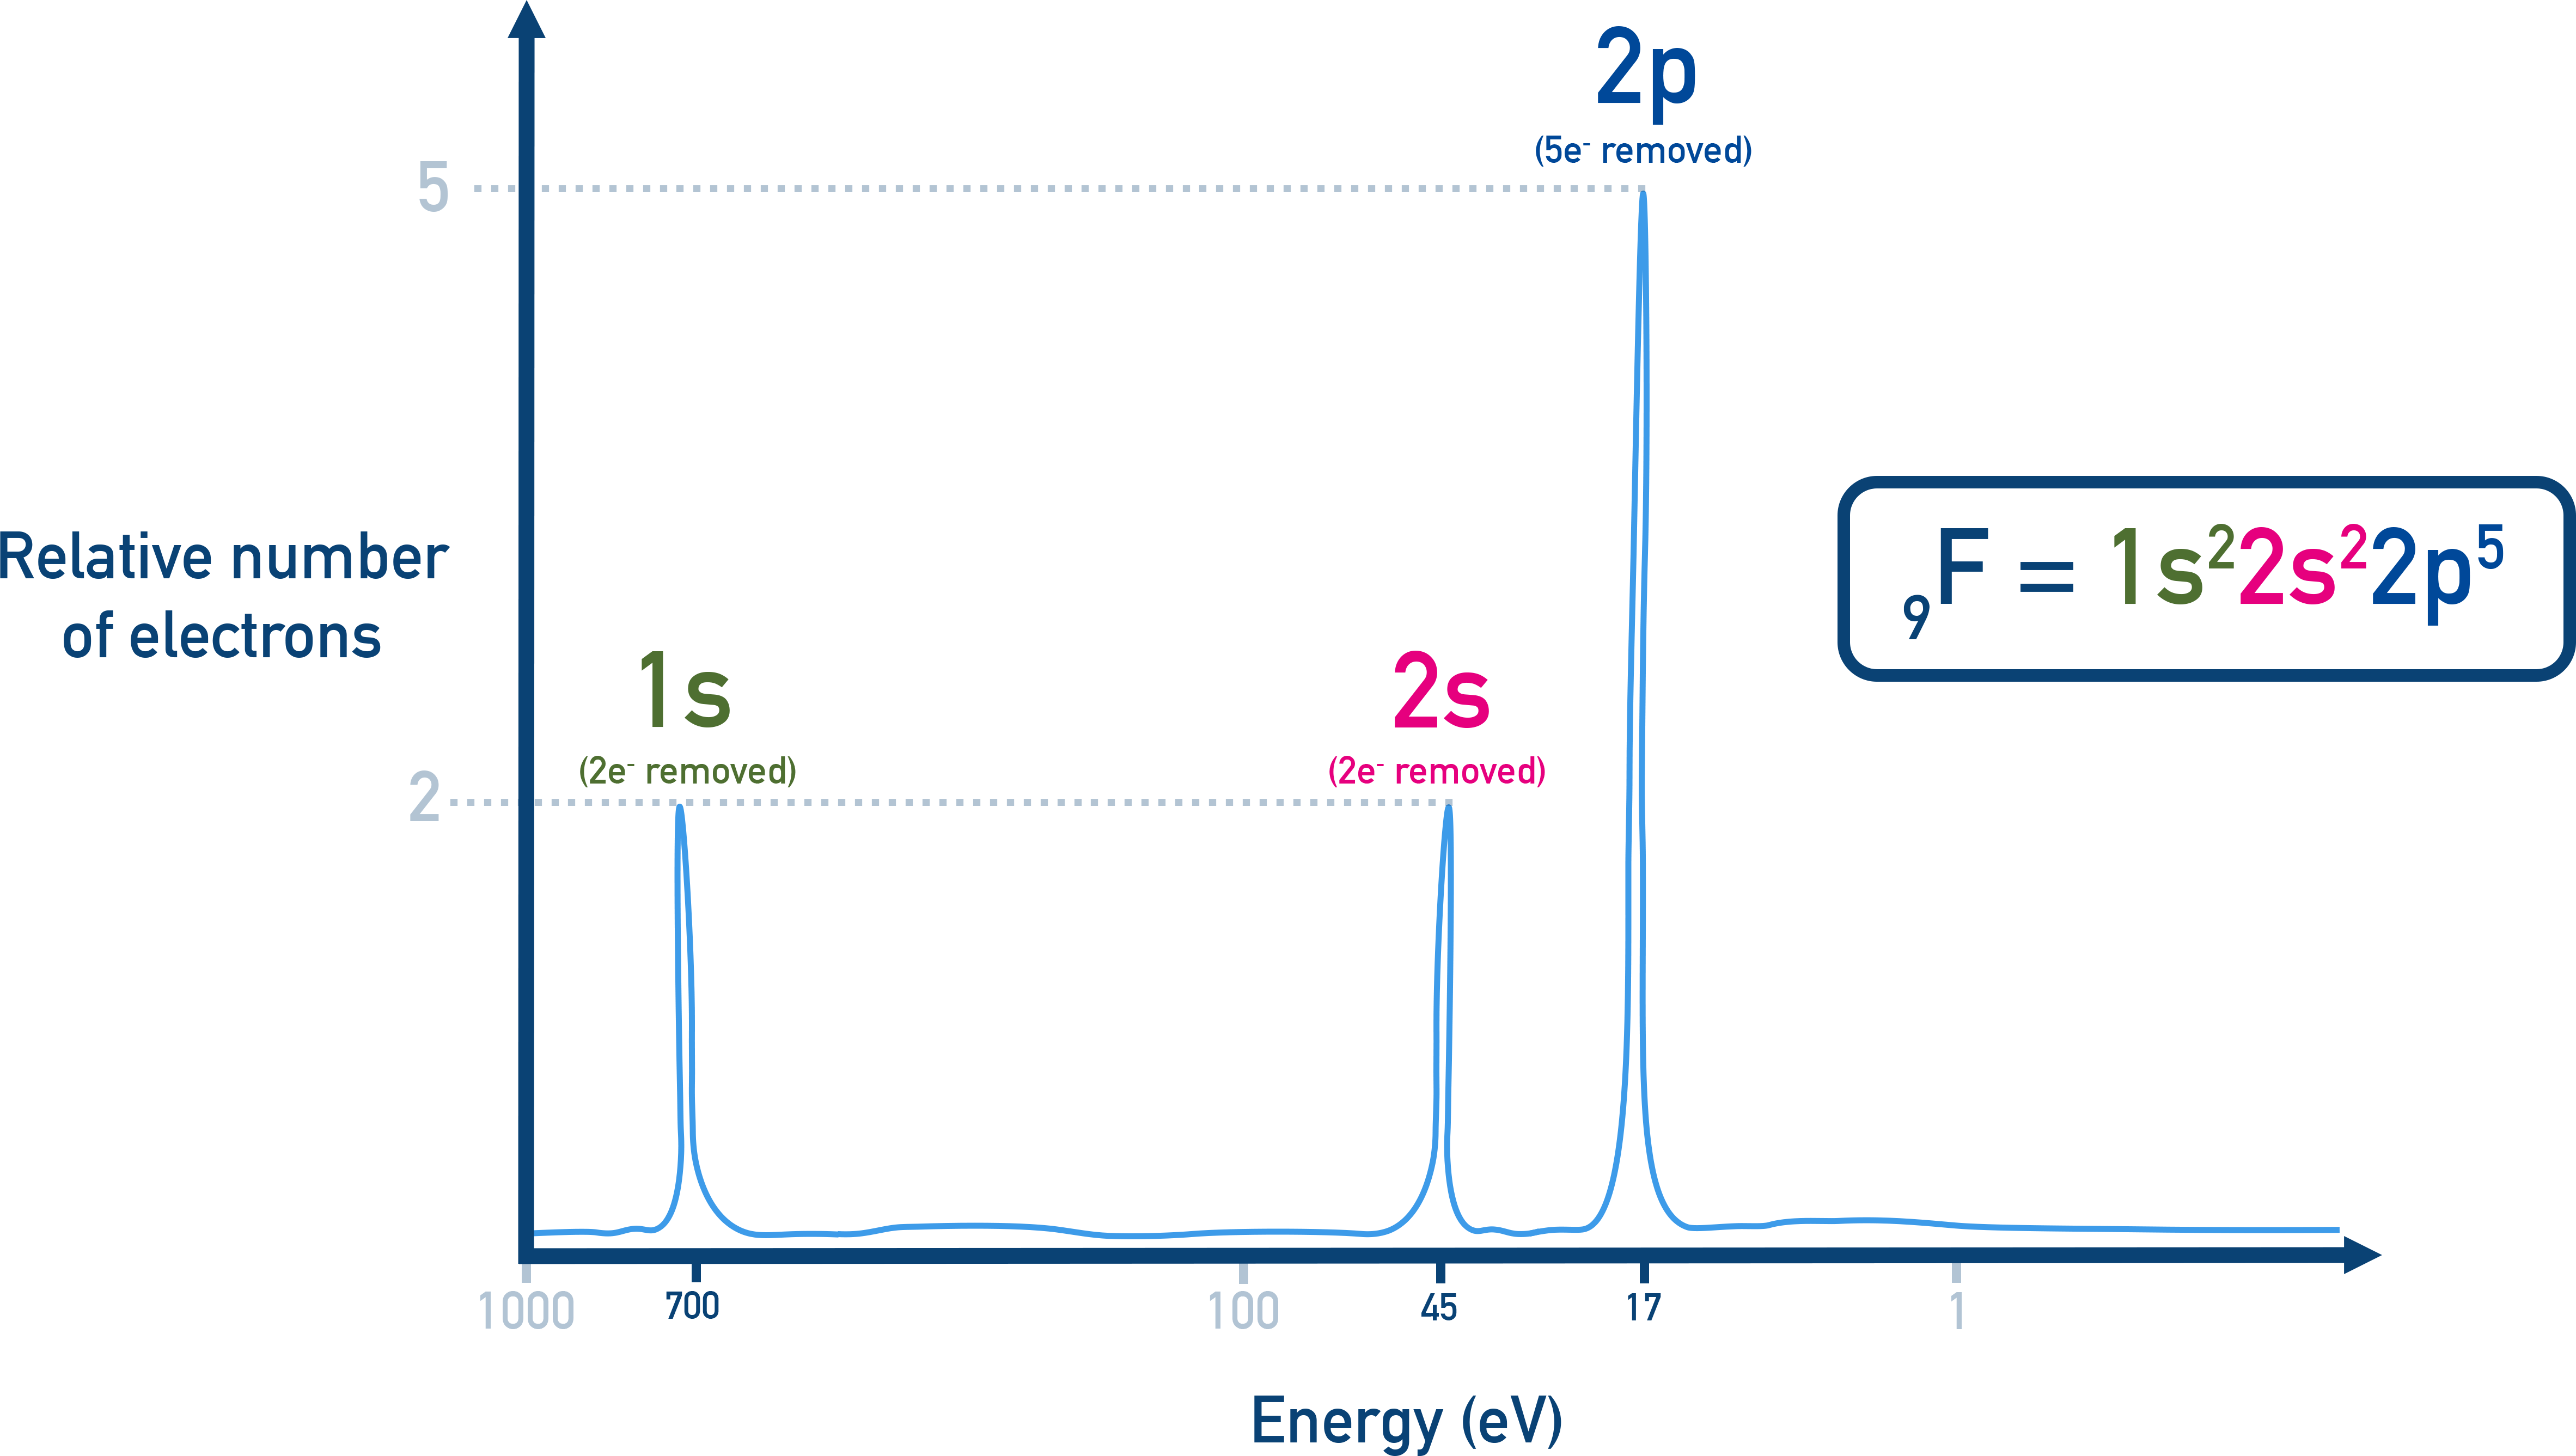
- High energy peak (2 electrons) = 1s
- Intermediate peak (2 electrons) = 2s
- Low energy peak (5 electrons) = 2p → Electron configuration = 1s2 2s2 2p5 → Element F is fluorine

In PES questions, be ready to match spectra to electron configurations or explain differences in binding energy. Focus on how close electrons are to the nucleus and how many occupy each subshell. Also, watch the x-axis as binding energy often decreases to the right, which can trip students up.
Summary
- Photoelectron spectroscopy (PES) provides experimental evidence for the ground-state electron configuration of atoms.
- The position of each peak reflects how tightly an electron is held (binding energy), and the height corresponds to the number of electrons in that subshell.
- Binding energy increases for electrons closer to the nucleus and shielding lowers outer‑electron binding energies.