
Energy Diagrams
Learning Objective 6.2.A
Represent a chemical or physical transformation with an energy diagram.
Quick Notes
- Energy diagrams illustrate how potential energy changes overall for a chemical or physical process.
- They show whether a process is endothermic or exothermic by comparing reactant and product energy levels.
- Key features:
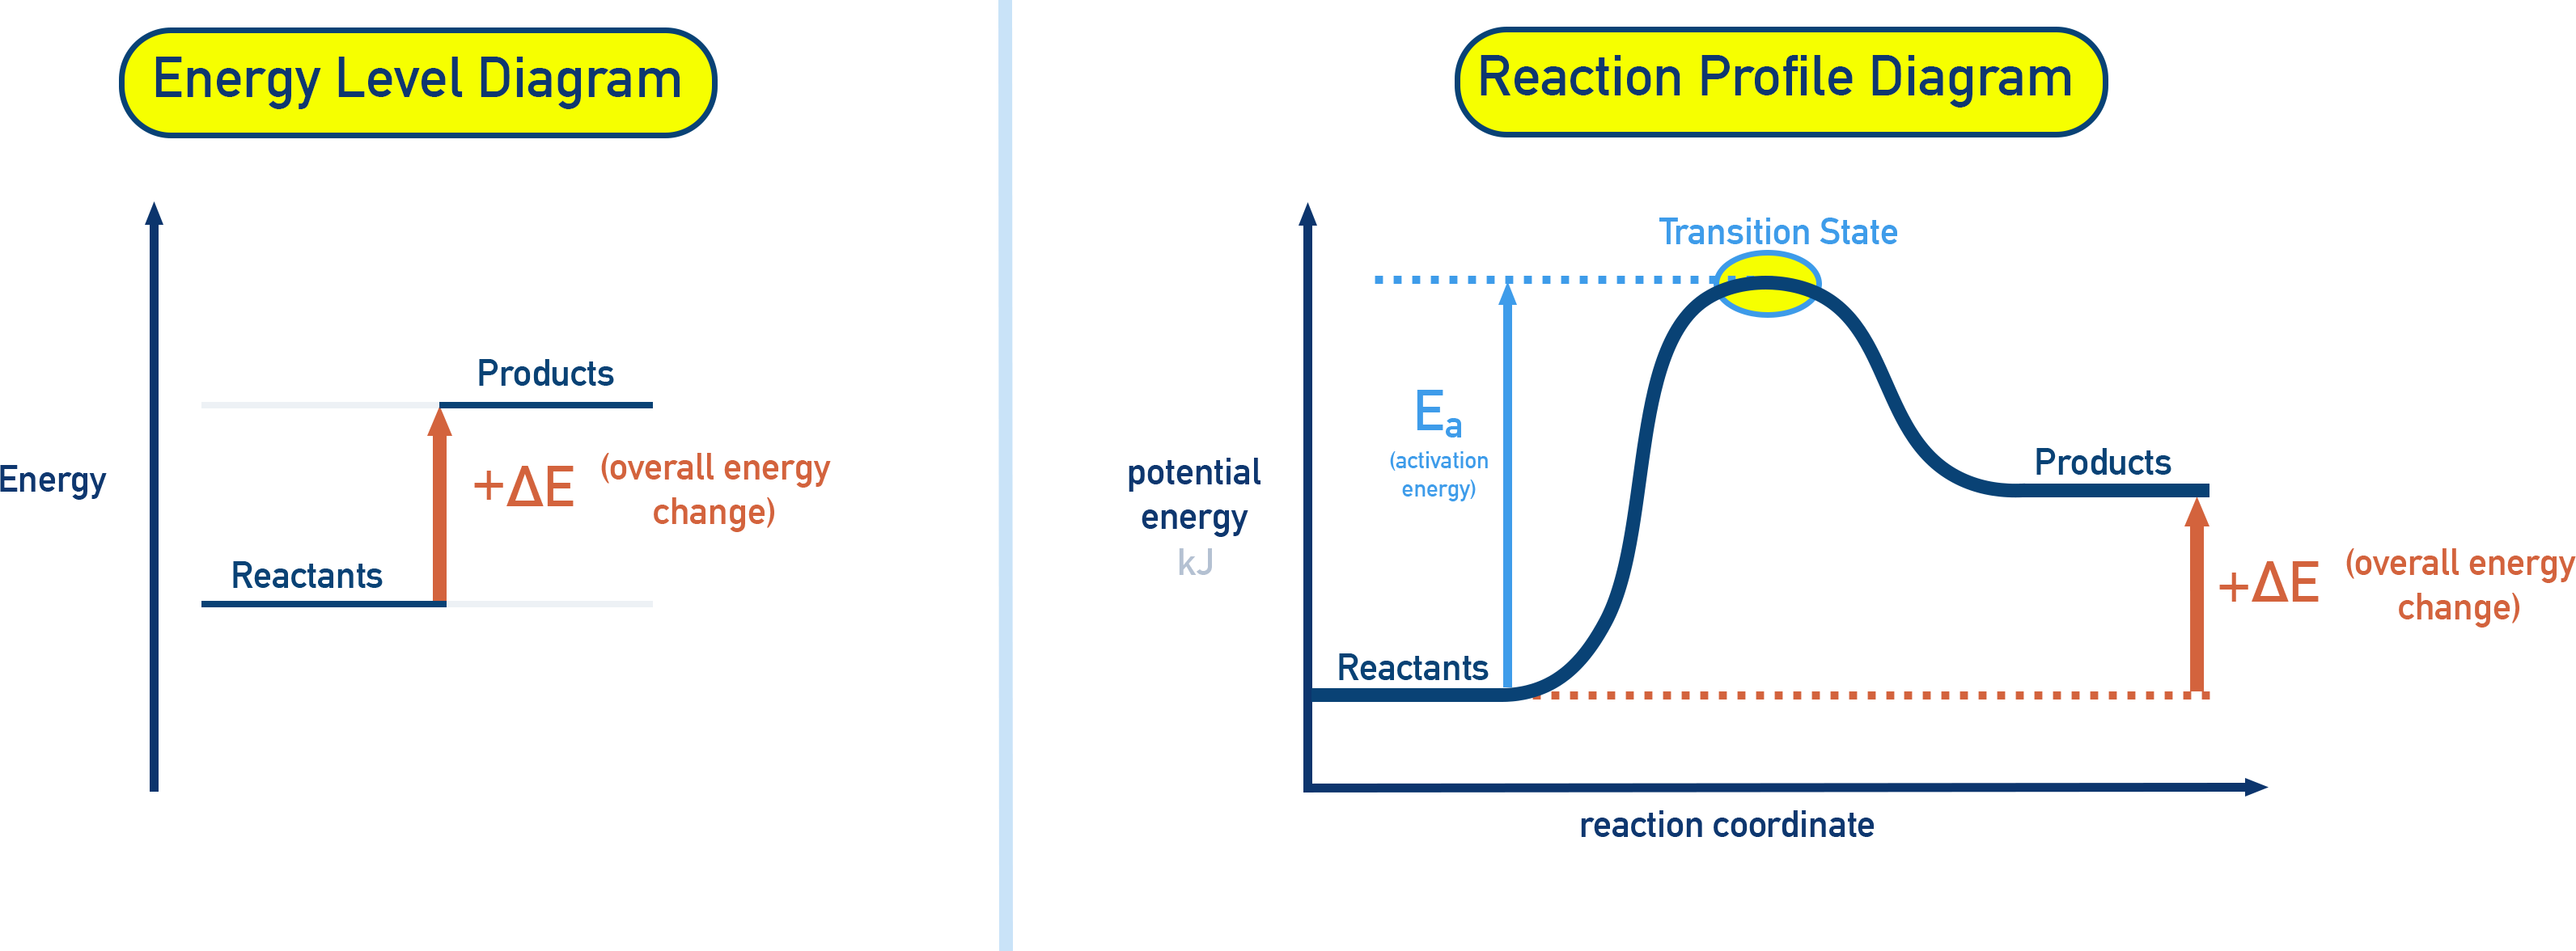
- Reactants on the left, products on the right.
- ΔE = difference between product and reactant energy levels.
- -ΔE = exothermic
- +ΔE = endothermic
Full Notes
What Is an Energy Diagram?
An energy diagram is a graphical way of showing the overall energy change that occurs during a chemical reaction or physical process. The y-axis represents potential energy.
Note: Energy diagrams are also covered in kinetics as reaction profile diagrams (see 5.6). Strictly speaking, an energy level diagram may refer only to the relative energies of reactants and products, whereas a reaction profile (reaction coordinate) diagram also shows the pathway of the reaction, including activation energy and any transition states or intermediates. However, in AP Chemistry, the term “energy diagram” is commonly used for reaction profile diagrams as well.
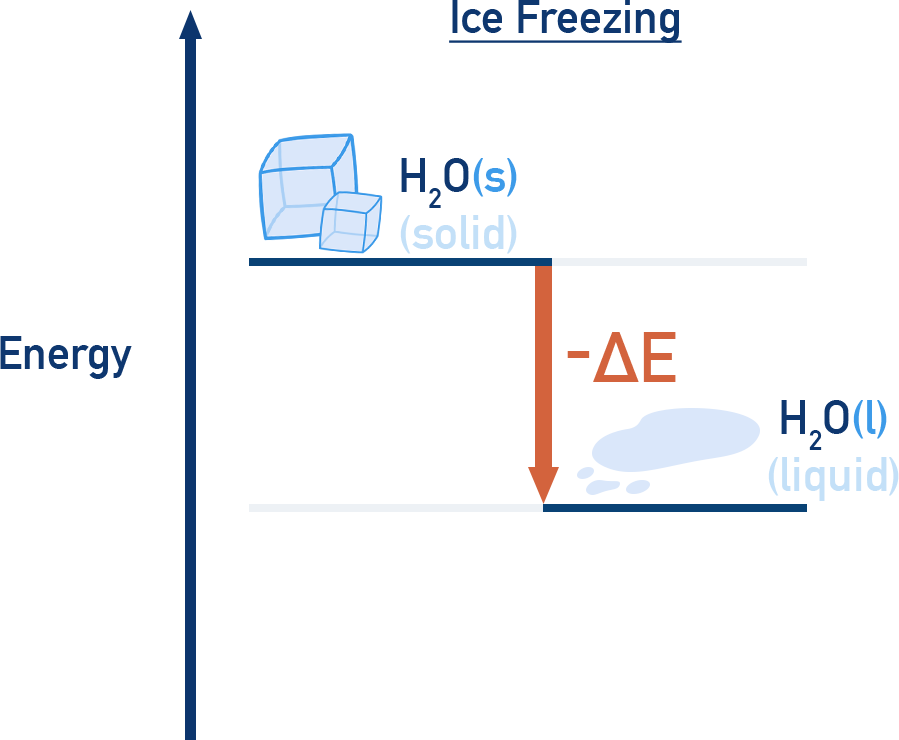
Exothermic Energy Diagram
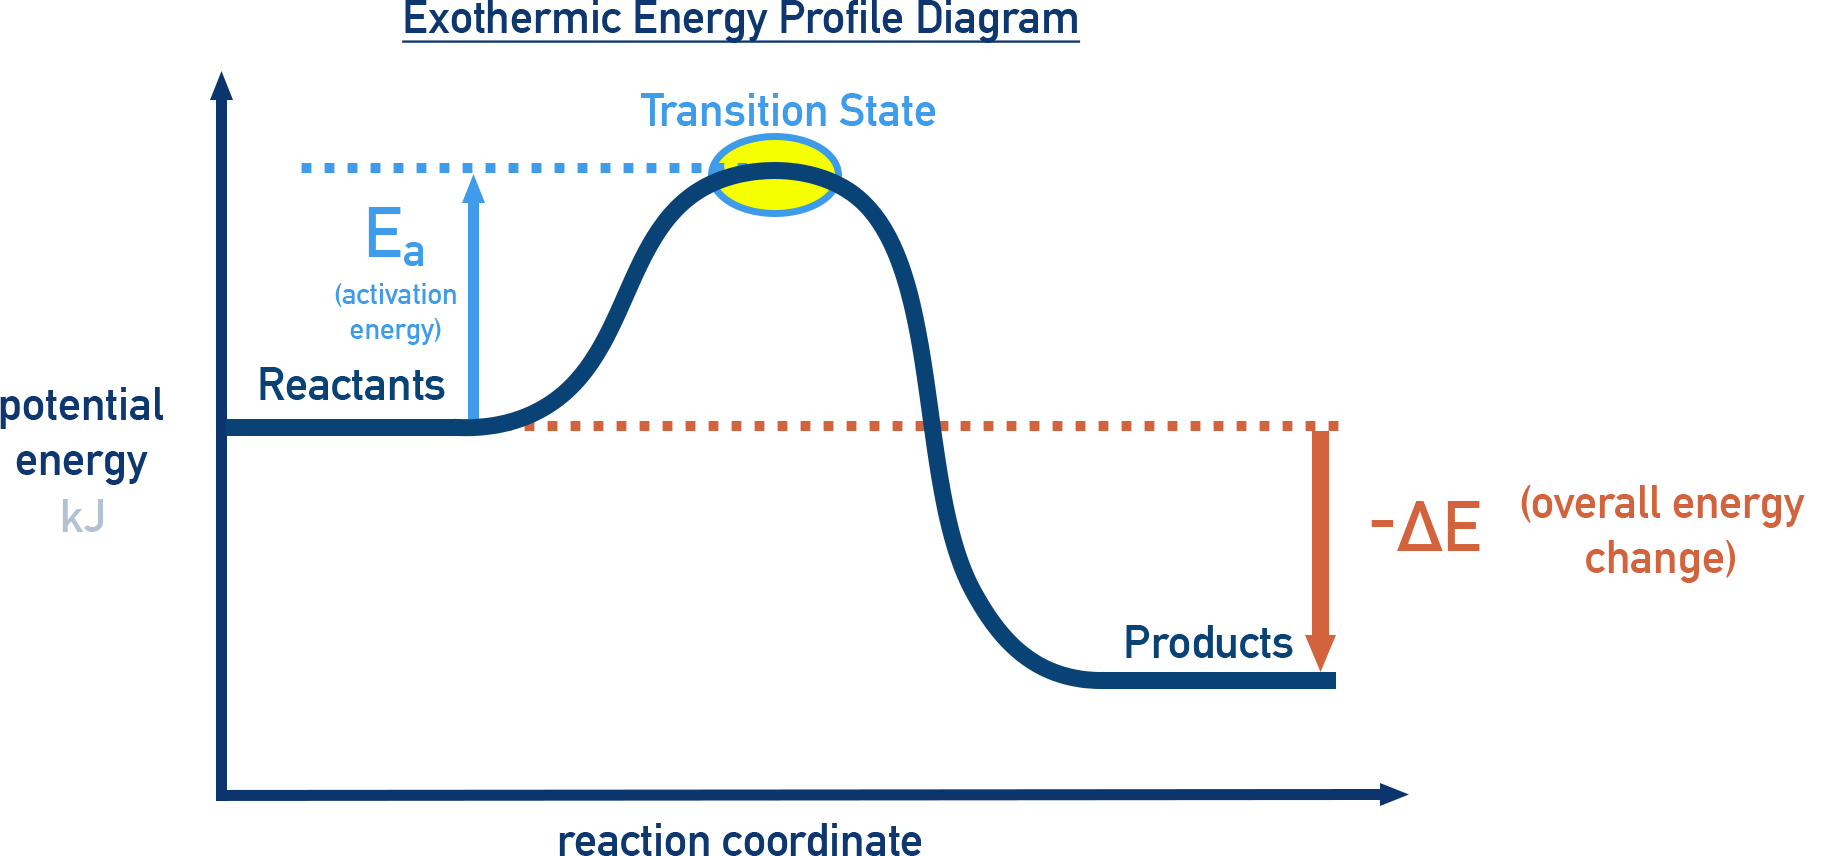
ΔE < 0
- Products have lower energy than reactants.
- Energy is released to the surroundings.
- Examples: combustion, neutralisation.
Endothermic Energy Diagram
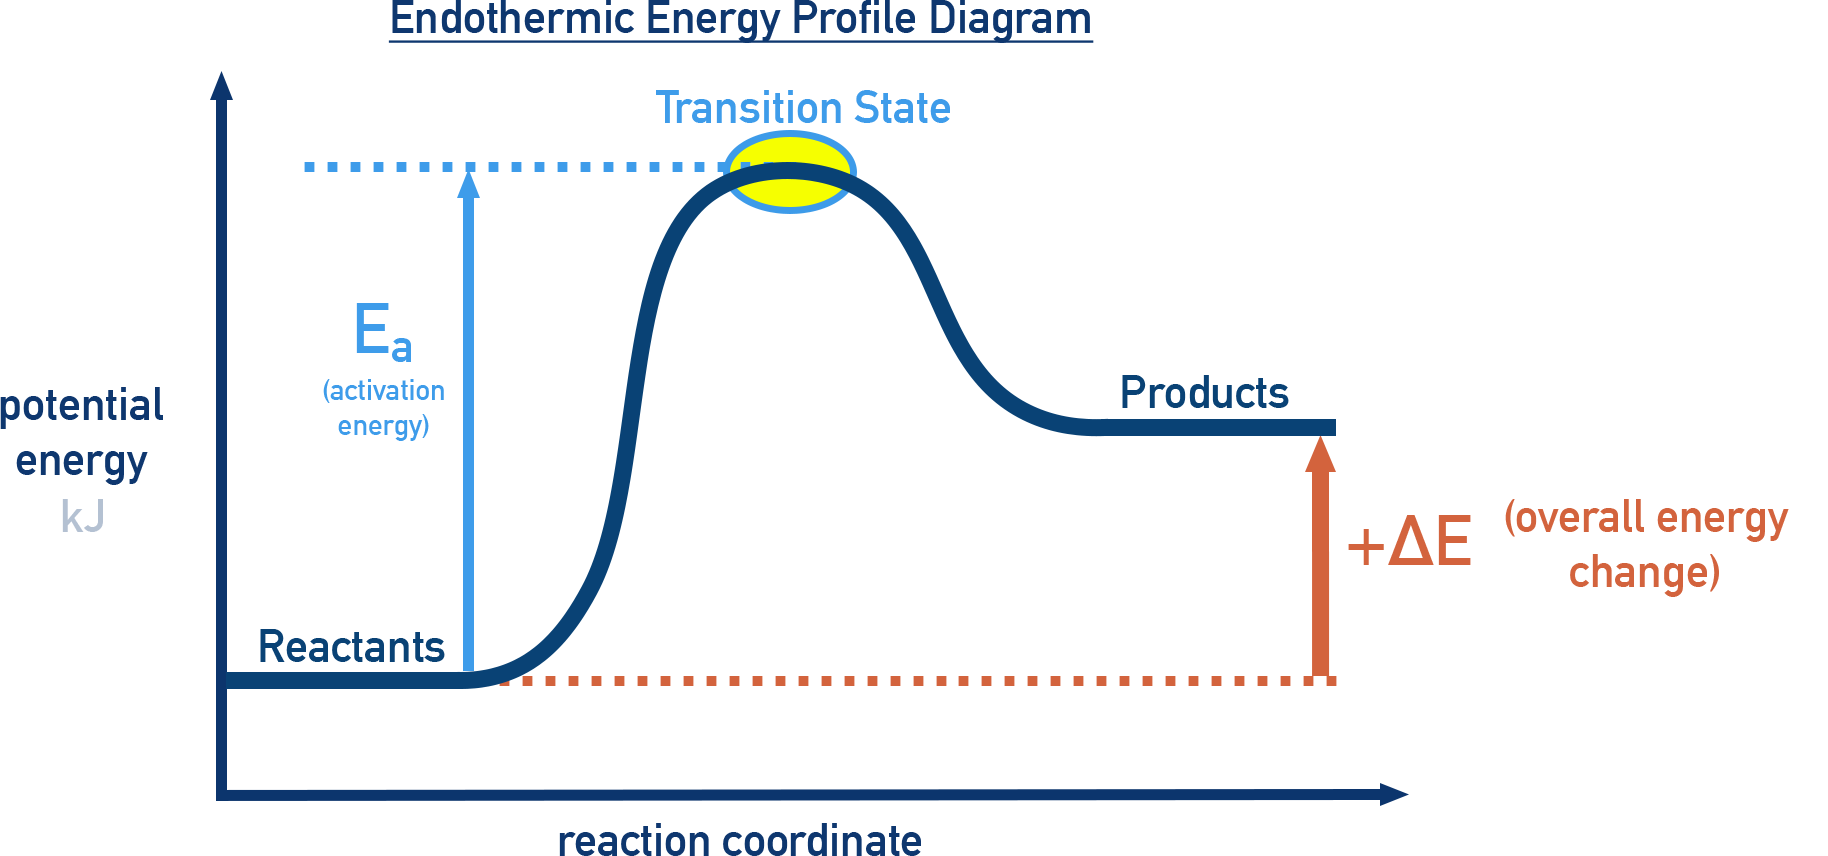
ΔE > 0
- Products have higher energy than reactants.
- Energy is absorbed from the surroundings.
- Examples: photosynthesis, melting.
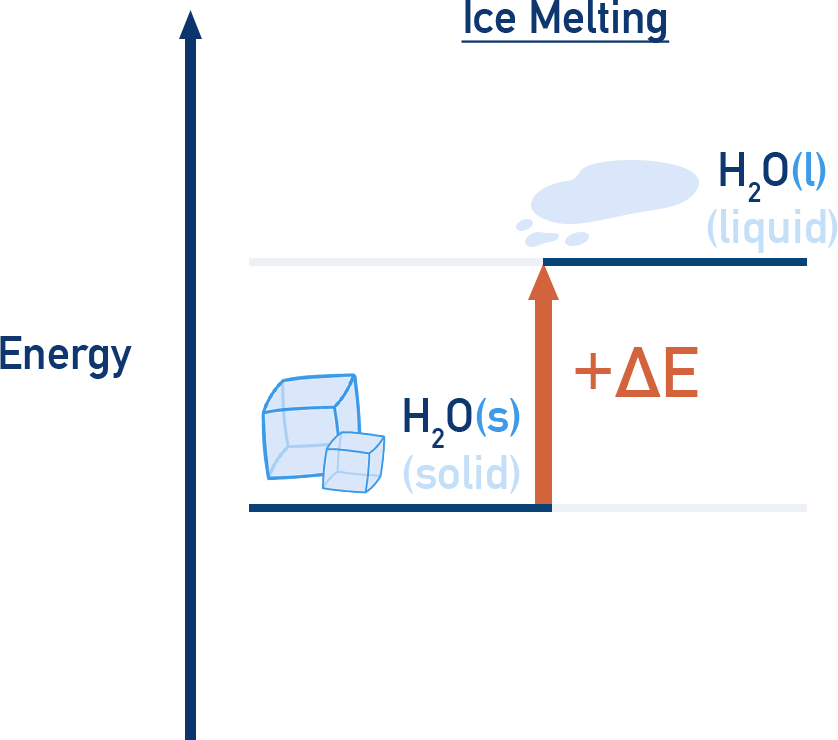
Physical Transformations
Energy diagrams also apply to phase changes and other physical transformations:
- Melting: endothermic (energy absorbed)
- Freezing: exothermic (energy released)
Summary
- Energy diagrams are visual tools that represent whether a process is endothermic or exothermic.
- They show the energy difference (ΔE) between reactants and products and can also be extended to reaction profile diagrams that include activation energy.