Quick Notes Colorimetry
- Colorimetry is a technique used to find the concentration of a solution based on the intensity of light (of a specific wavelength) it absorbs or scatters.
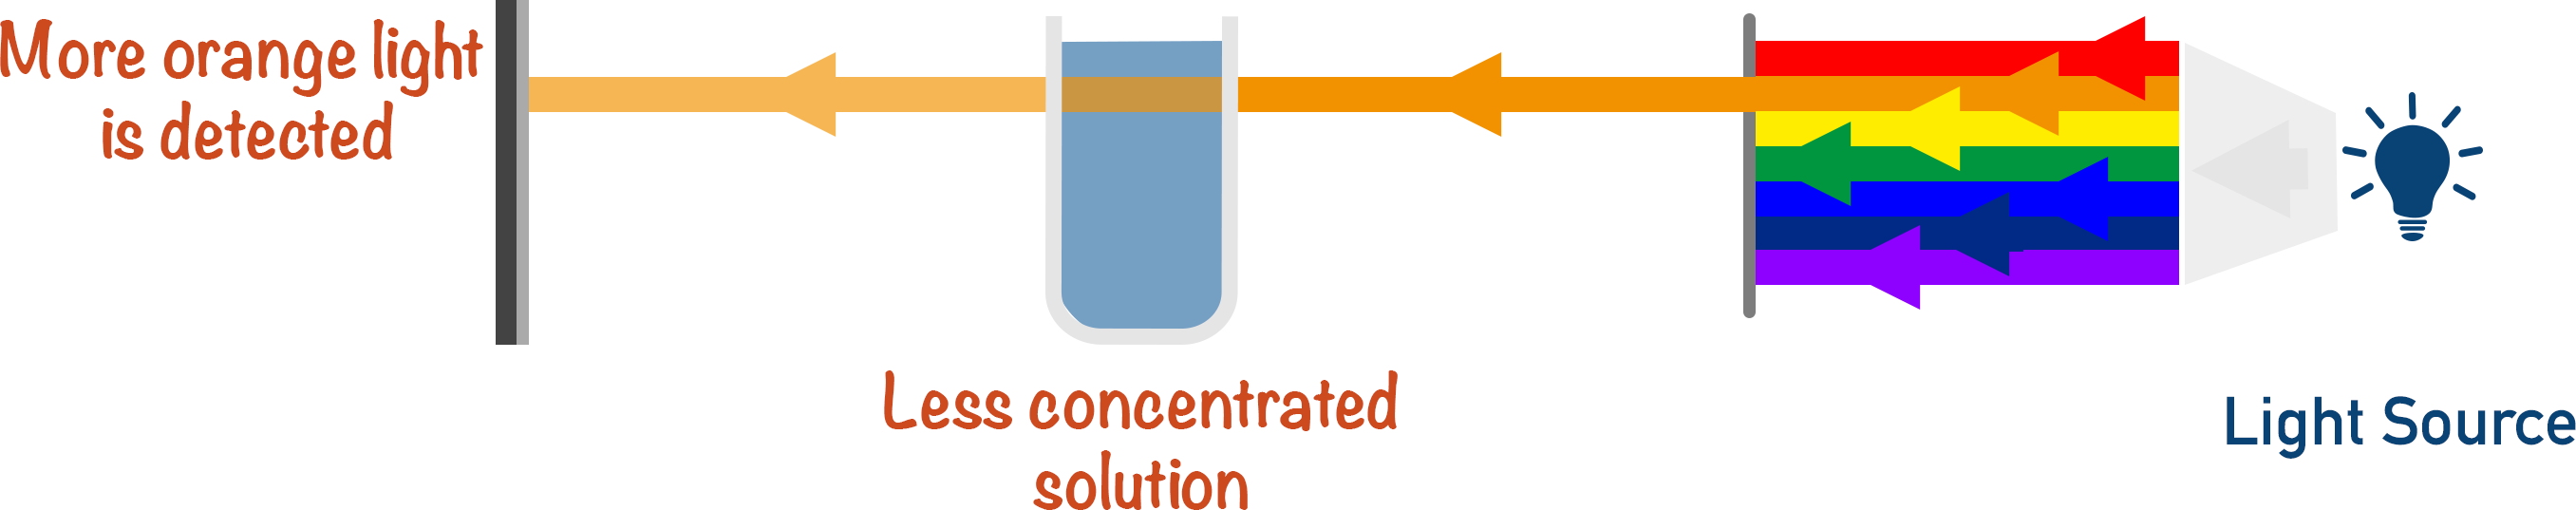
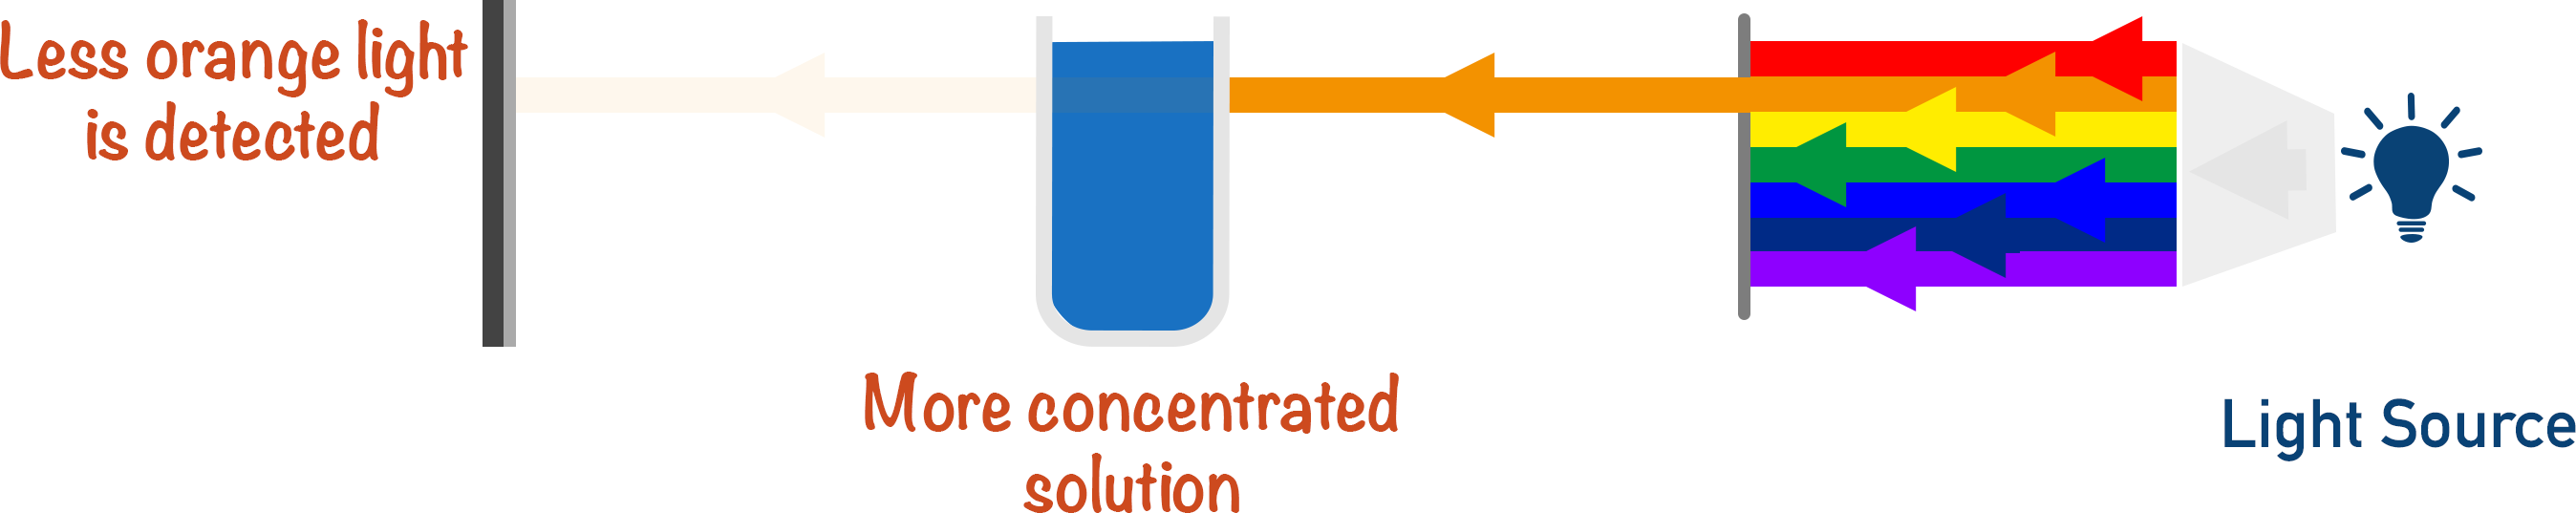
- Coloured solutions absorb specific wavelengths of visible light. The more concentrated a solution is, the greater the intensity of light it absorbs.
- The amount of light that passes through a sample is detected, giving an indication as to the amount of light absorbed by the sample.
- A calibration curve is made using the absorbances of solutions of known concentrations.
- The absorbance of the unknown concentration is compared to the calibration curve, and the concentration is found.
Full Notes Colorimetry
The intensity of light absorbed by a coloured solution is dependent on the concentration of the solution. The greater the concentration of a solution, the greater the intensity of light absorbed by it. Colorimetry is a technique used to find the concentration of a solution. The intensity of light absorbed by a sample with an unknown concentration is measured, then compared to the absorbances for known concentrations of the same substance, using a calibration curve.
Colorimeters measure the specific wavelengths of light absorbed or scattered by a sample, enabling graphs (spectra) to be formed that are unique to every substance and concentration of solution.
A colour filter is used to remove the wavelengths of light not absorbed by the solution.
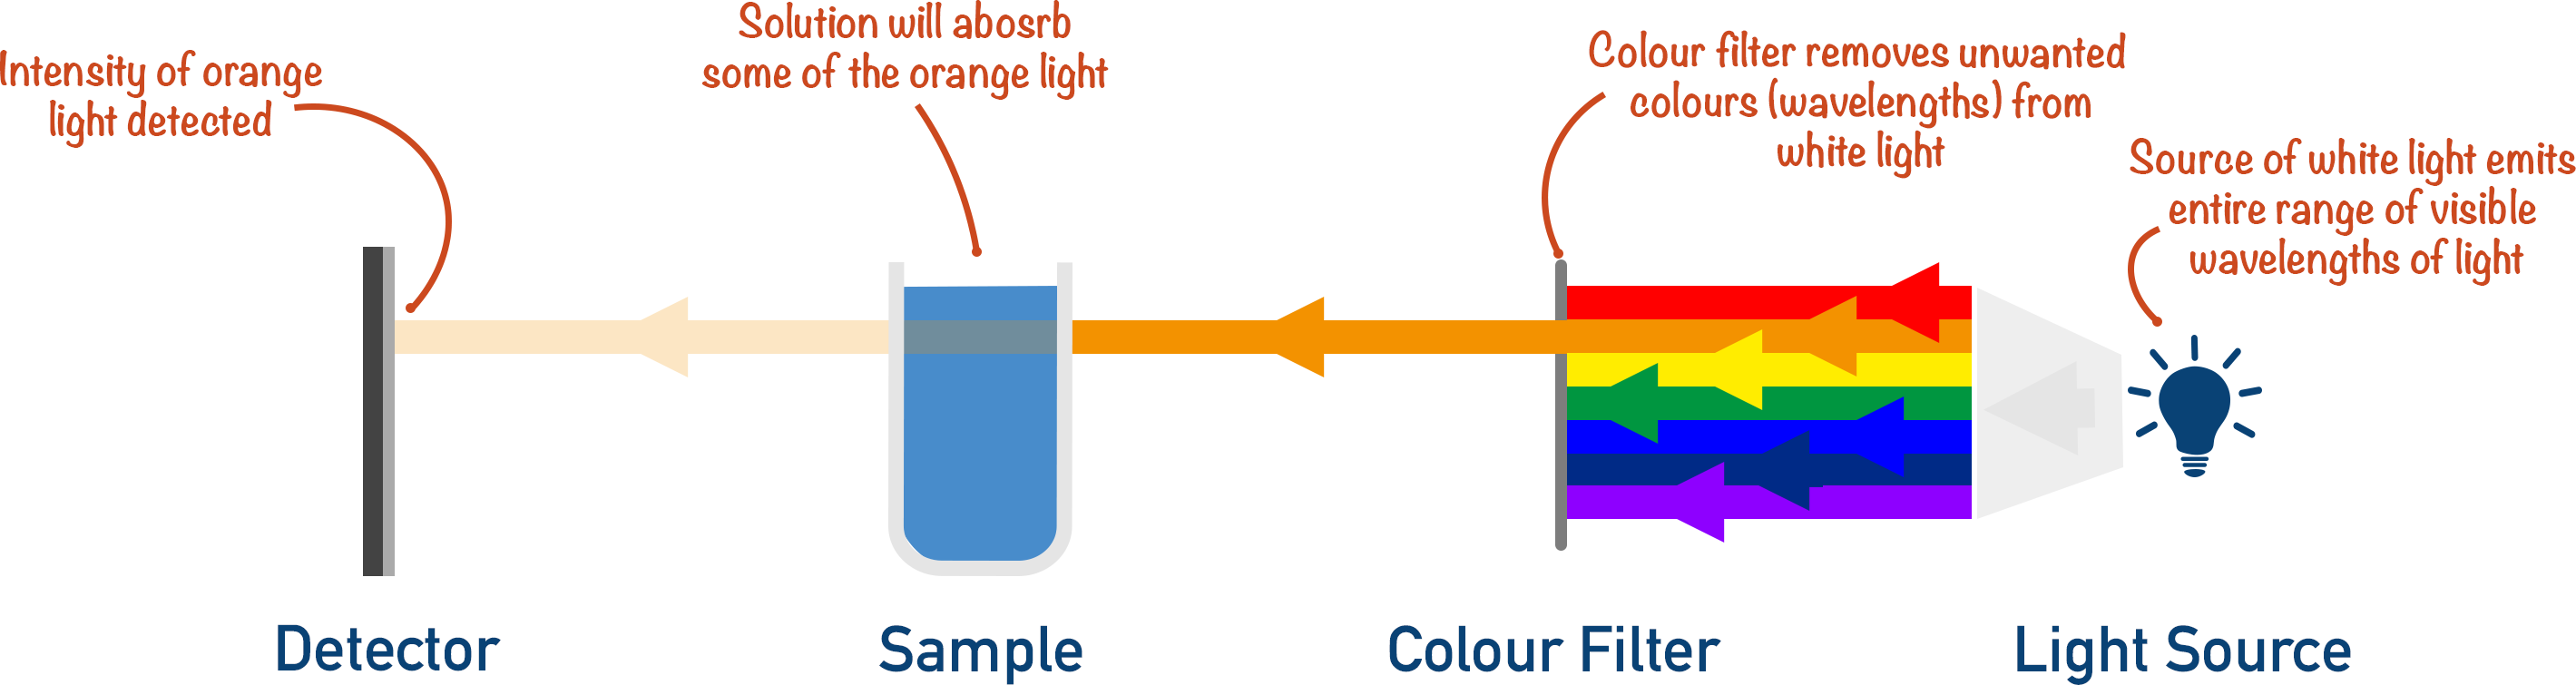
The greater the concentration of solution, the greater the intensity of wavelengths absorbed by the solution (in this example, orange light).
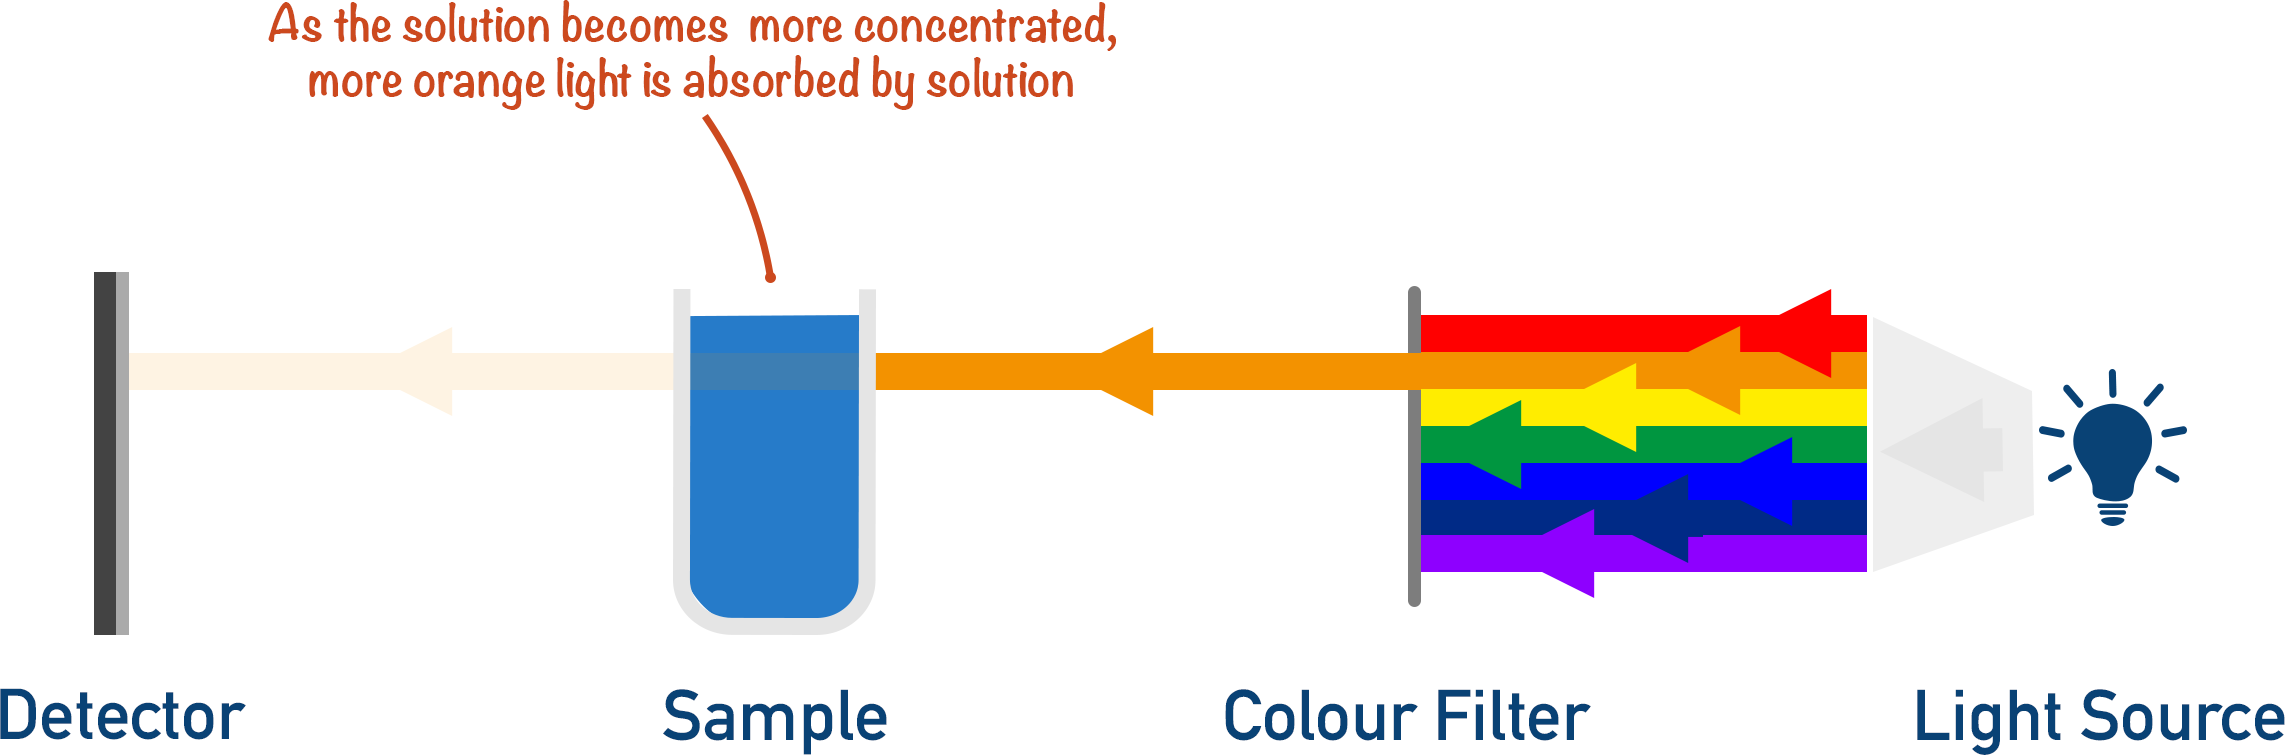
The intensity of the wavelengths detected are related to the concentration of the sample.
The intensity of absorption for the solution is measured for known concentrations.
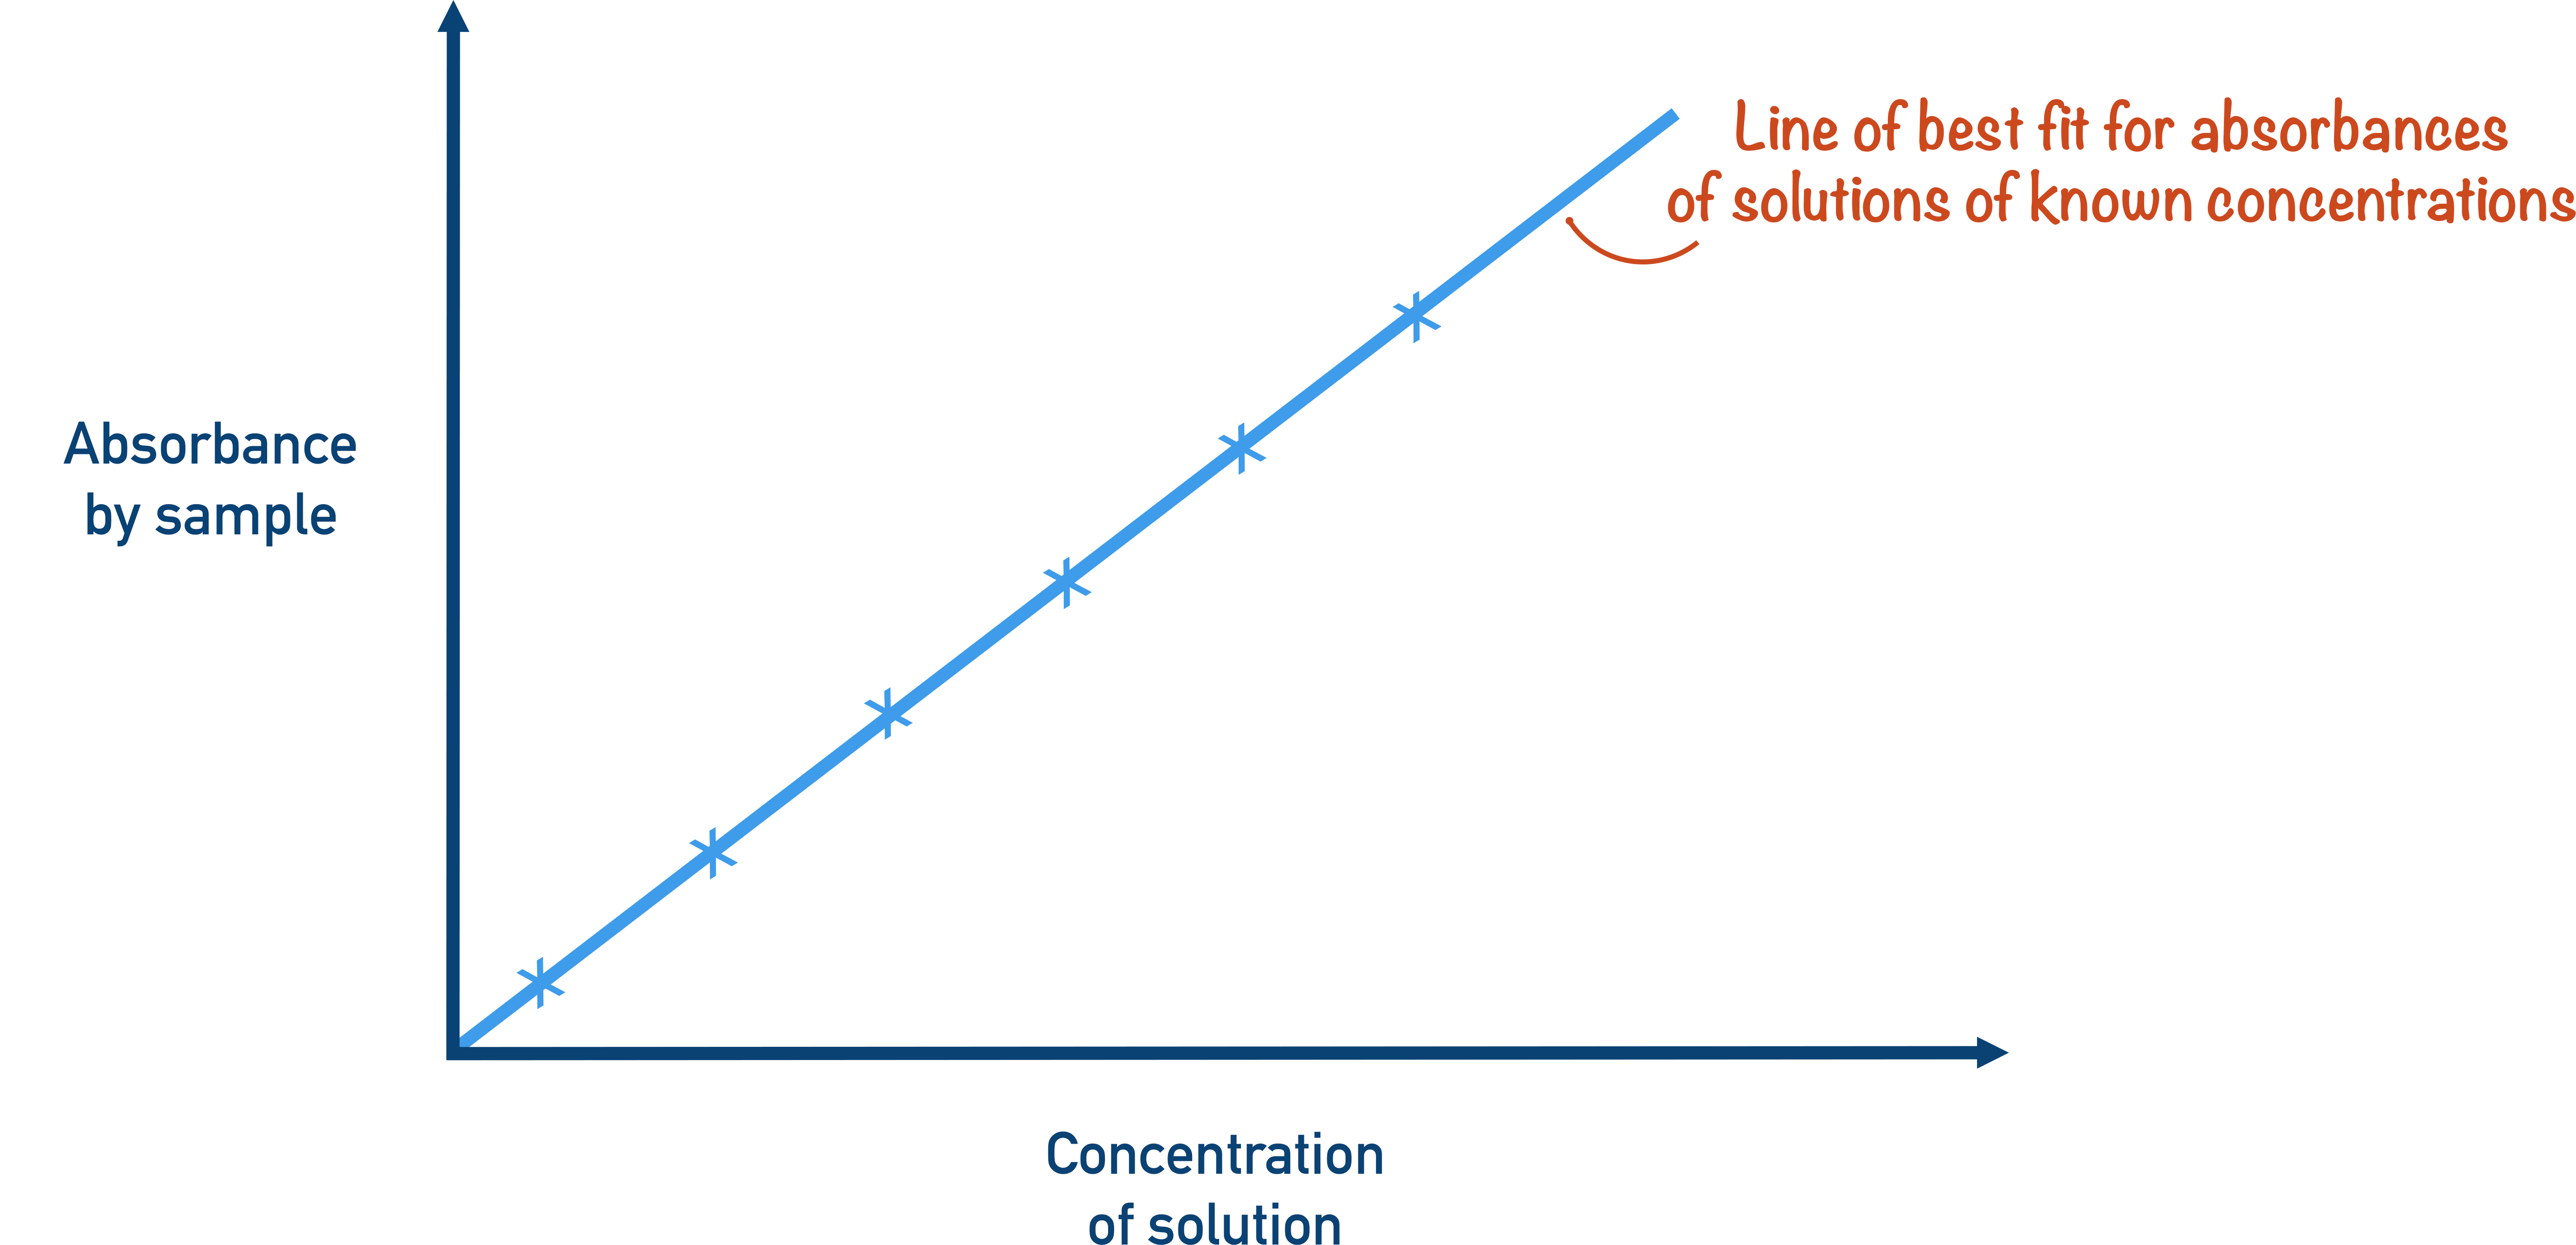
The results are plotted on a graph and a line of best fit is drawn. This is called a calibration curve.
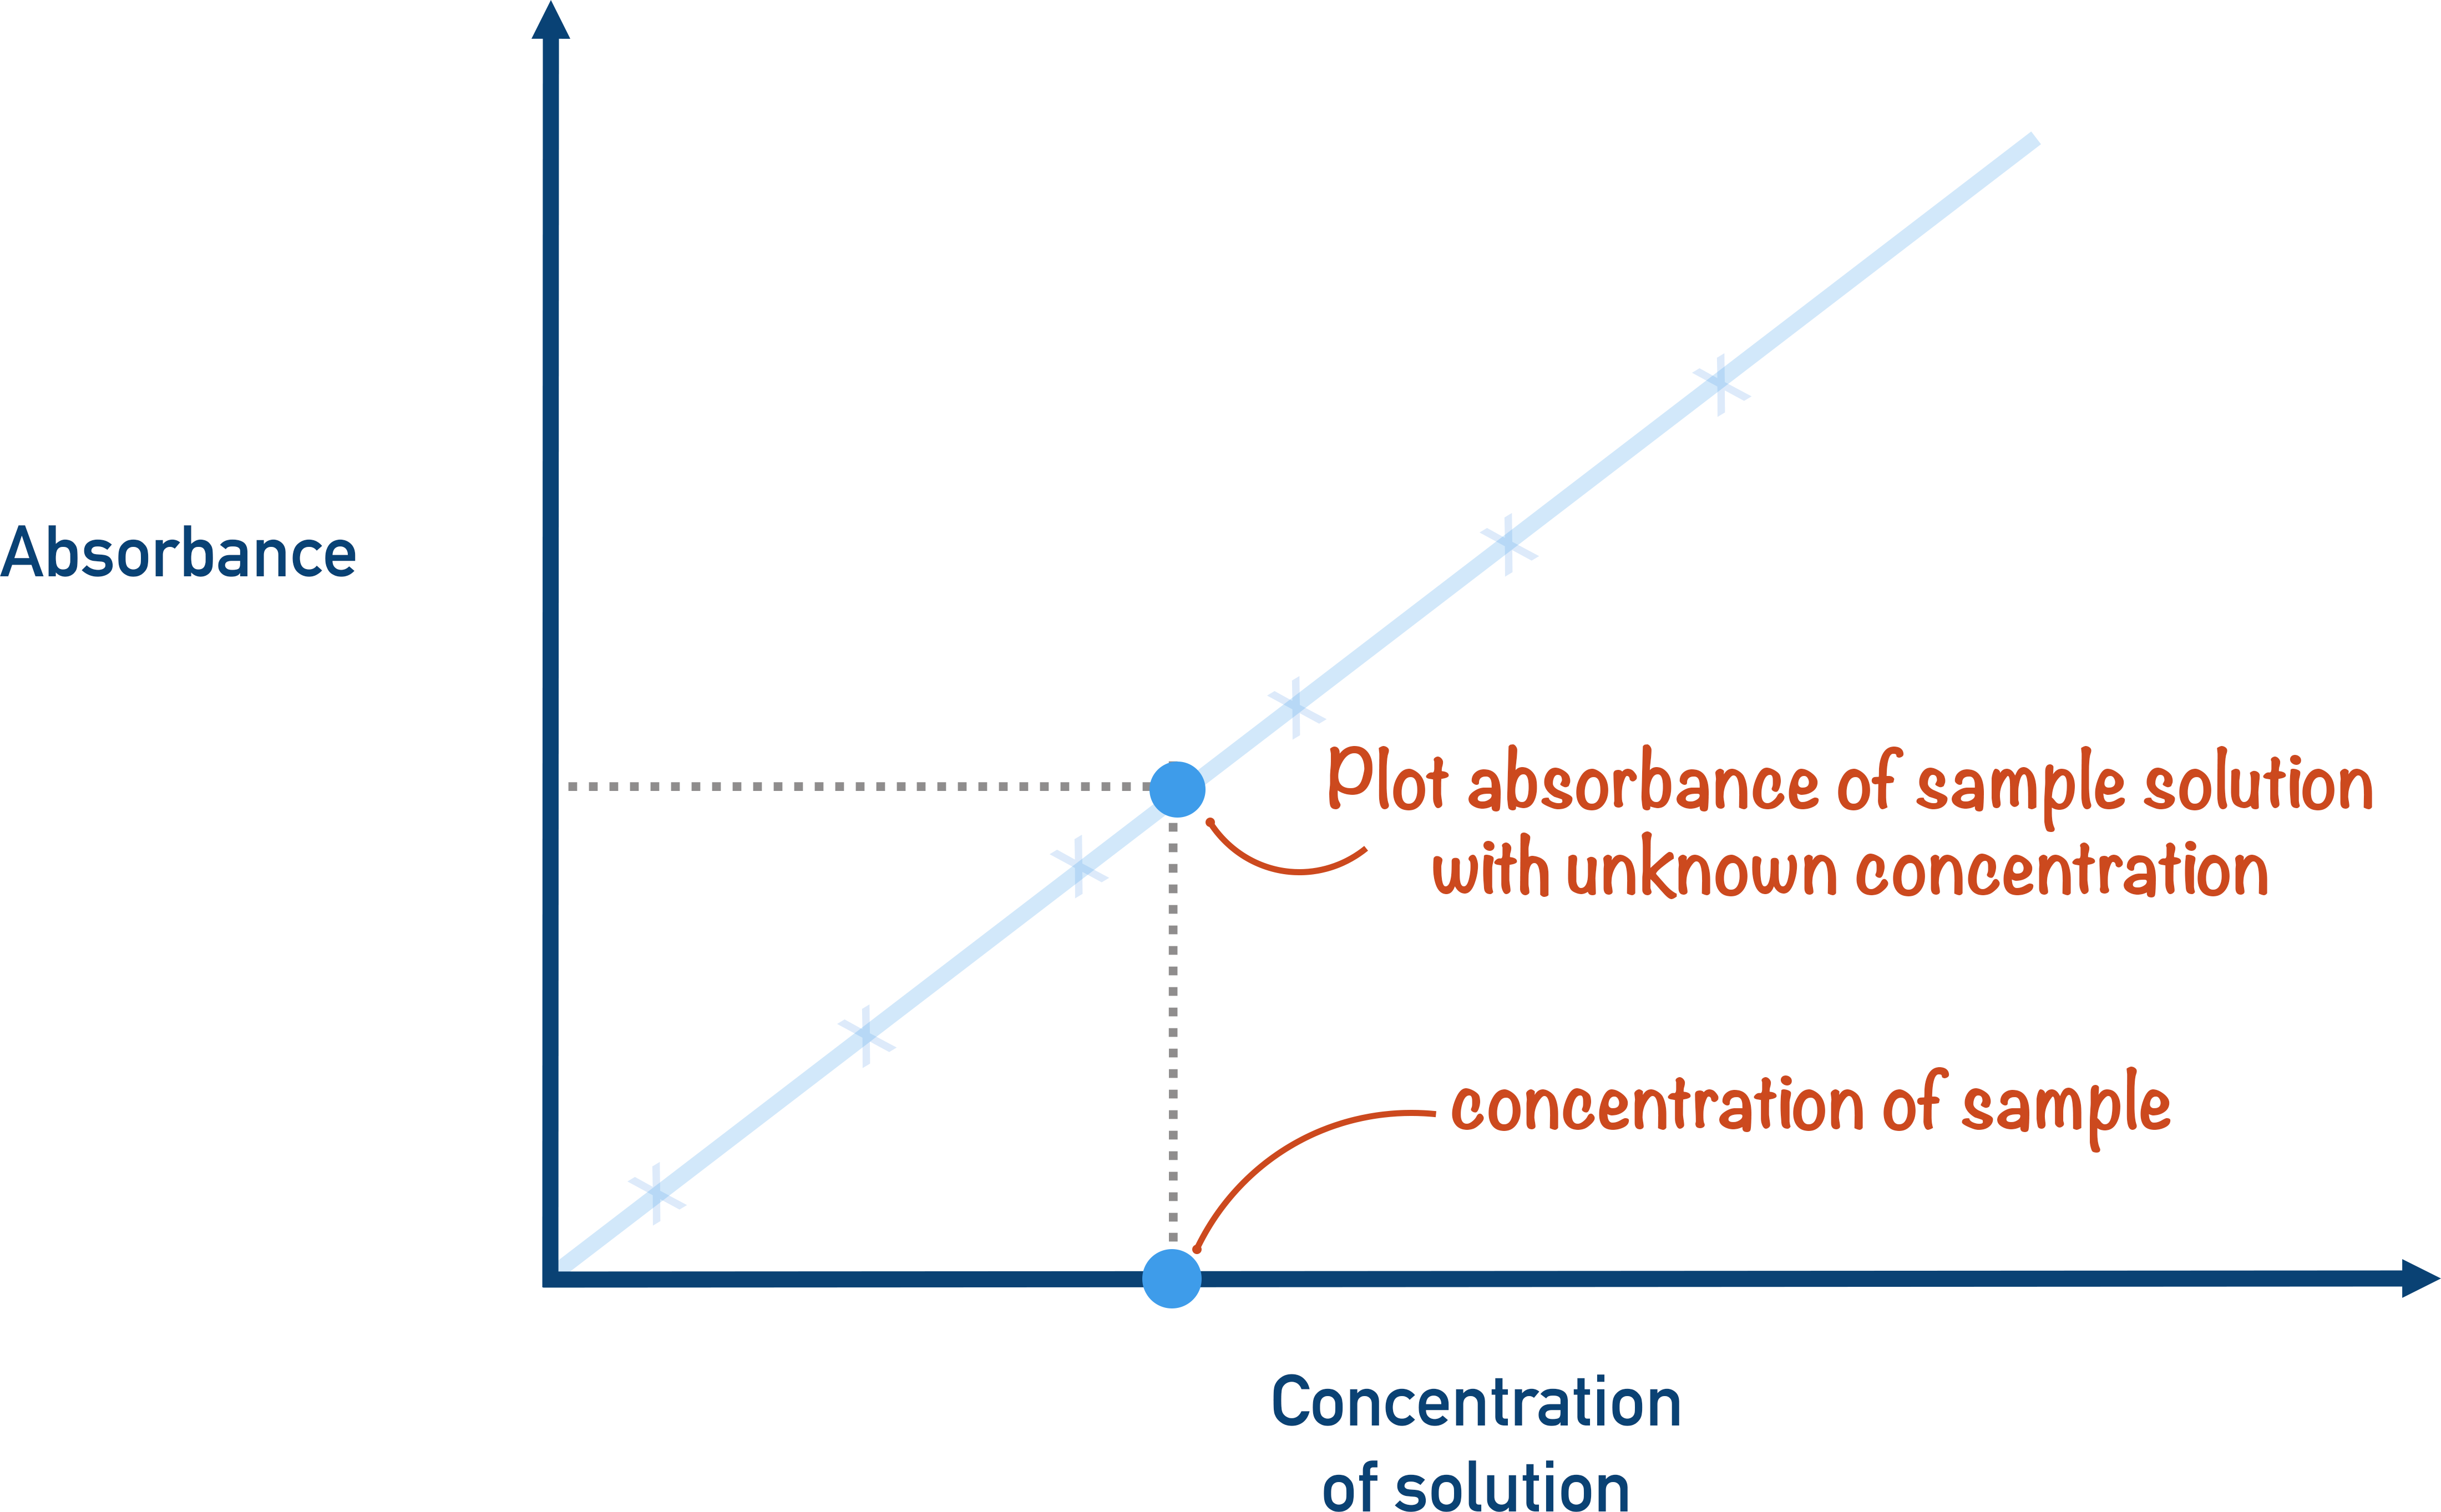
The results for the original solution with an unknown concentration are obtained and compared with the calibration curve, and the concentration is found.