
Energy Profiles for Endothermic and Exothermic Reactions
Quick Notes:
- Exothermic reactions: products are more stable (lower potential energy) than reactants.
- Endothermic reactions: products are less stable (higher potential energy) than reactants.
- Energy profile diagrams:
- Y-axis: potential energy
- X-axis: reaction coordinate (progress of reaction)
- The difference in height between reactants and products = enthalpy change (ΔH).
- The activation energy is the energy required to start the reaction — shown as the peak of the curve.
Full Notes:
Sketching Energy Profile Diagrams
Energy profiles are graphs used to visualise energy changes during a reaction.
Axes:
Y-axis: potential energy (units often in kJ)
X-axis: reaction coordinate (represents progress of reaction)
Exothermic Reaction
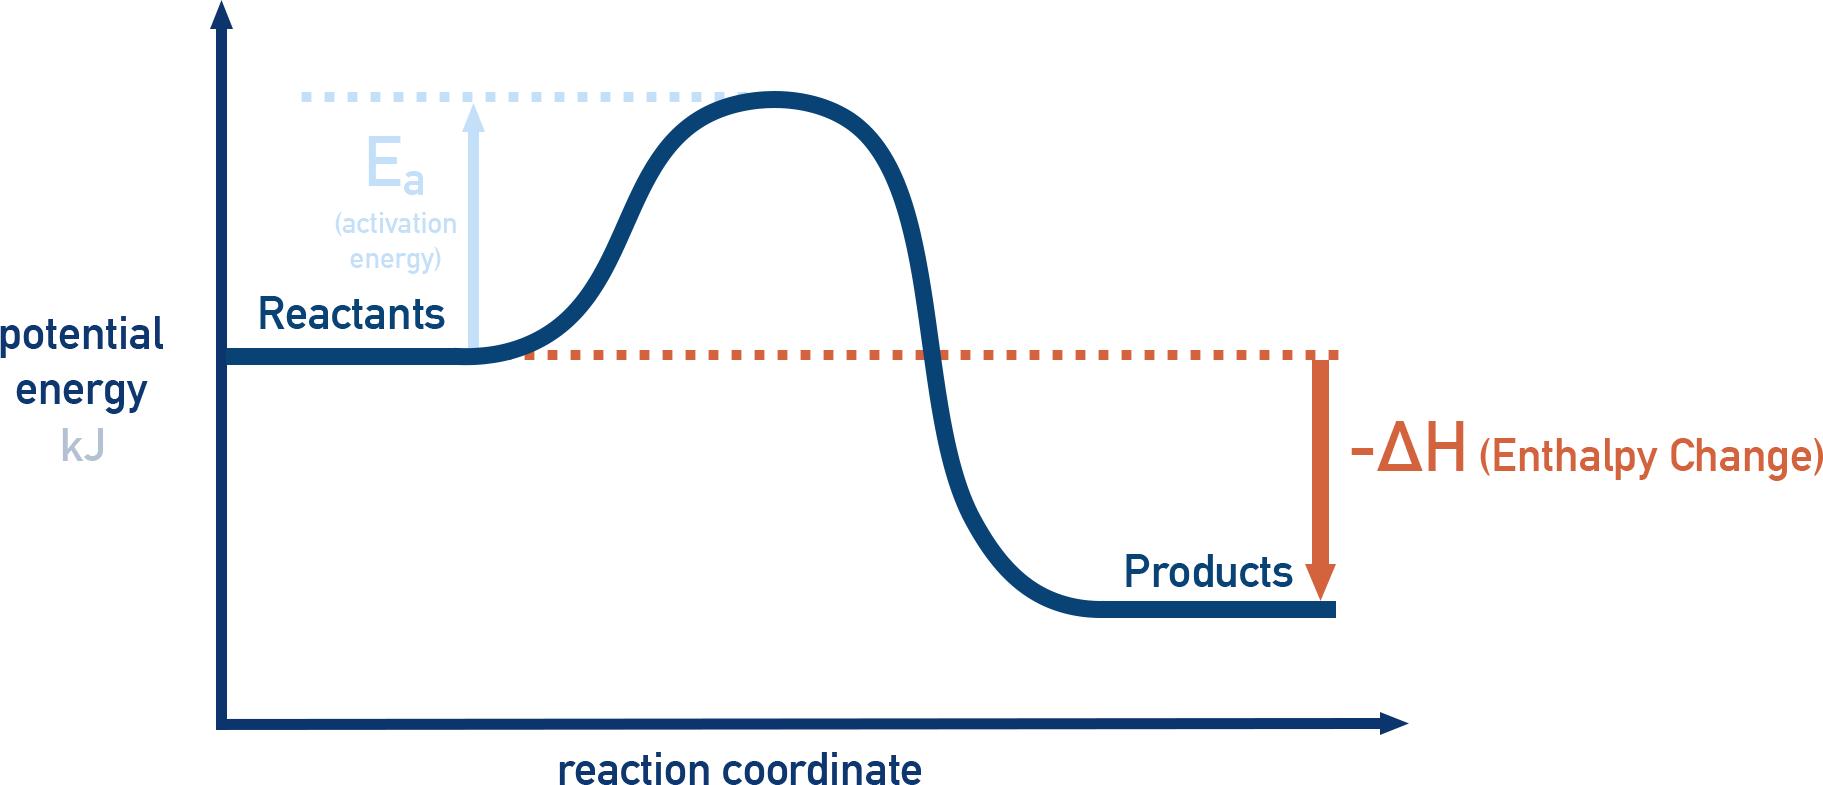
Reactants start high, products end lower.
ΔH is negative.
A downward slope from reactants to products.
Endothermic Reaction
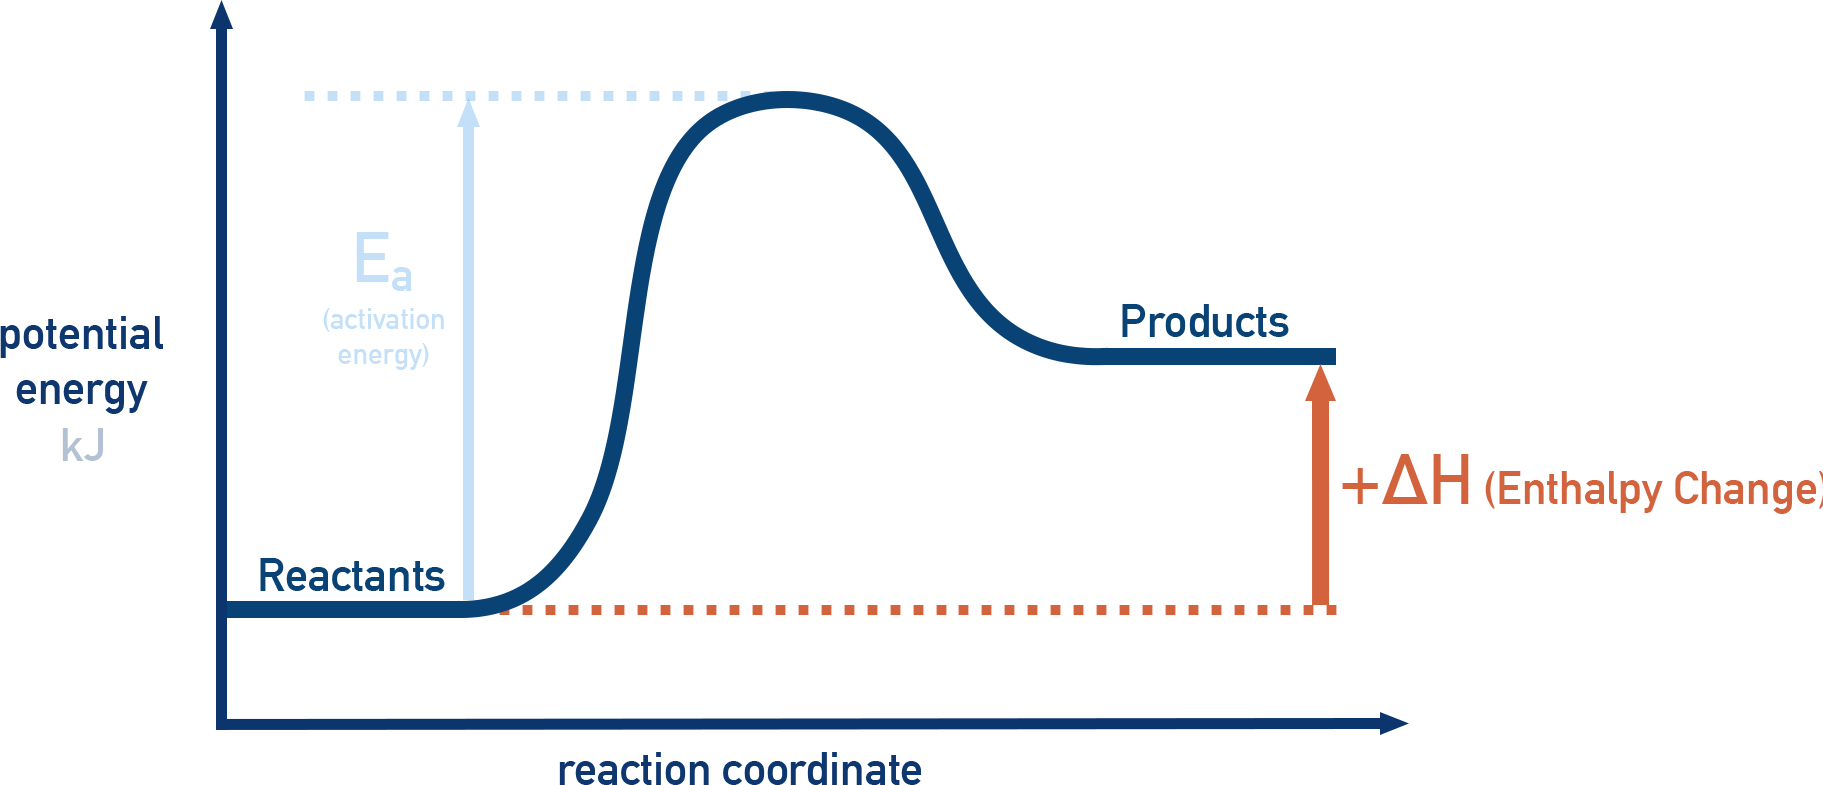
Reactants start low, products end higher.
ΔH is positive.
An upward slope from reactants to products.
Both profiles include a hump representing the activation energy (Ea) – the minimum energy required to initiate the reaction.
Key Labels on the Diagram
| Label | Meaning | Where it appears on the diagram |
|---|---|---|
| Reactants | Starting potential energy level | Left plateau at the beginning |
| Products | Final potential energy level | Right plateau at the end |
| ΔH | Enthalpy change (products − reactants) | Vertical gap between product and reactant levels |
| Ea | Activation energy | Vertical rise from reactants to the peak |
| Reaction coordinate | Progress of reaction | X-axis |
| Potential energy | Relative energy of system | Y-axis |
Summary Table
| Reaction type | Relative energies | Sign of ΔH | Profile trend | Activation energy (Ea) |
|---|---|---|---|---|
| Exothermic | Products < Reactants | Negative | Overall downward | Peak above reactants |
| Endothermic | Products > Reactants | Positive | Overall upward | Peak above reactants |
Why is the combustion of N2 endothermic, unlike most exothermic combustion reactions?
Most combustion reactions are exothermic because they form strong bonds in the products. However, nitrogen gas (N2) has an extremely strong triple bond, which requires a large amount of energy to break. In nitrogen combustion, more energy is needed to break N≡N than is released when new bonds form (e.g. in NO or NO2), making the overall process endothermic.
Summary
- Exothermic profiles end lower than they start, with ΔH negative.
- Endothermic profiles end higher than they start, with ΔH positive.
- The peak on each diagram represents the activation energy needed to start the reaction.