
Reaction Order and Graphical Analysis HL Only
Quick Notes
- The order of reaction with respect to a reactant is the exponent in the rate equation (e.g. rate = k[A]n).
- The overall order is the sum of the individual orders.
- Graphical methods help determine order:
- Zero Order — linear (constant rate).
- First Order — exponential decay.
- Second Order — steeper exponential decay.
- Rate vs concentration graphs:
- Zero order: horizontal line.
- First order: straight line through origin.
- Second order: curve starting from origin.
Full Notes
The order of reaction with respect to a reactant tells us how the rate changes as the concentration of that reactant changes. See here for a recap.
It is the power (exponent) of the reactant concentration in the rate equation:
e.g. rate = k[A]1 is first order in A.
e.g. rate = k[A]1[B]2 is first order in A, second order in B, overall order = 3.
Reaction Order and the Rate-Determining Step
The order gives information about the number of particles involved in the rate-determining step.
If a reactant does not appear in the rate equation, its order is zero, meaning it doesn't affect the rate.
Graphical Methods to Determine Order
Graphs can be used to determine orders, plotted using experimental data.
Concentration–Time Graphs
We can measure how the initial reaction rate of a reaction changes when reactant concentrations are varied.
Graphs of rate–concentration can then be used to identify order with respect to each reactant based on their shape.
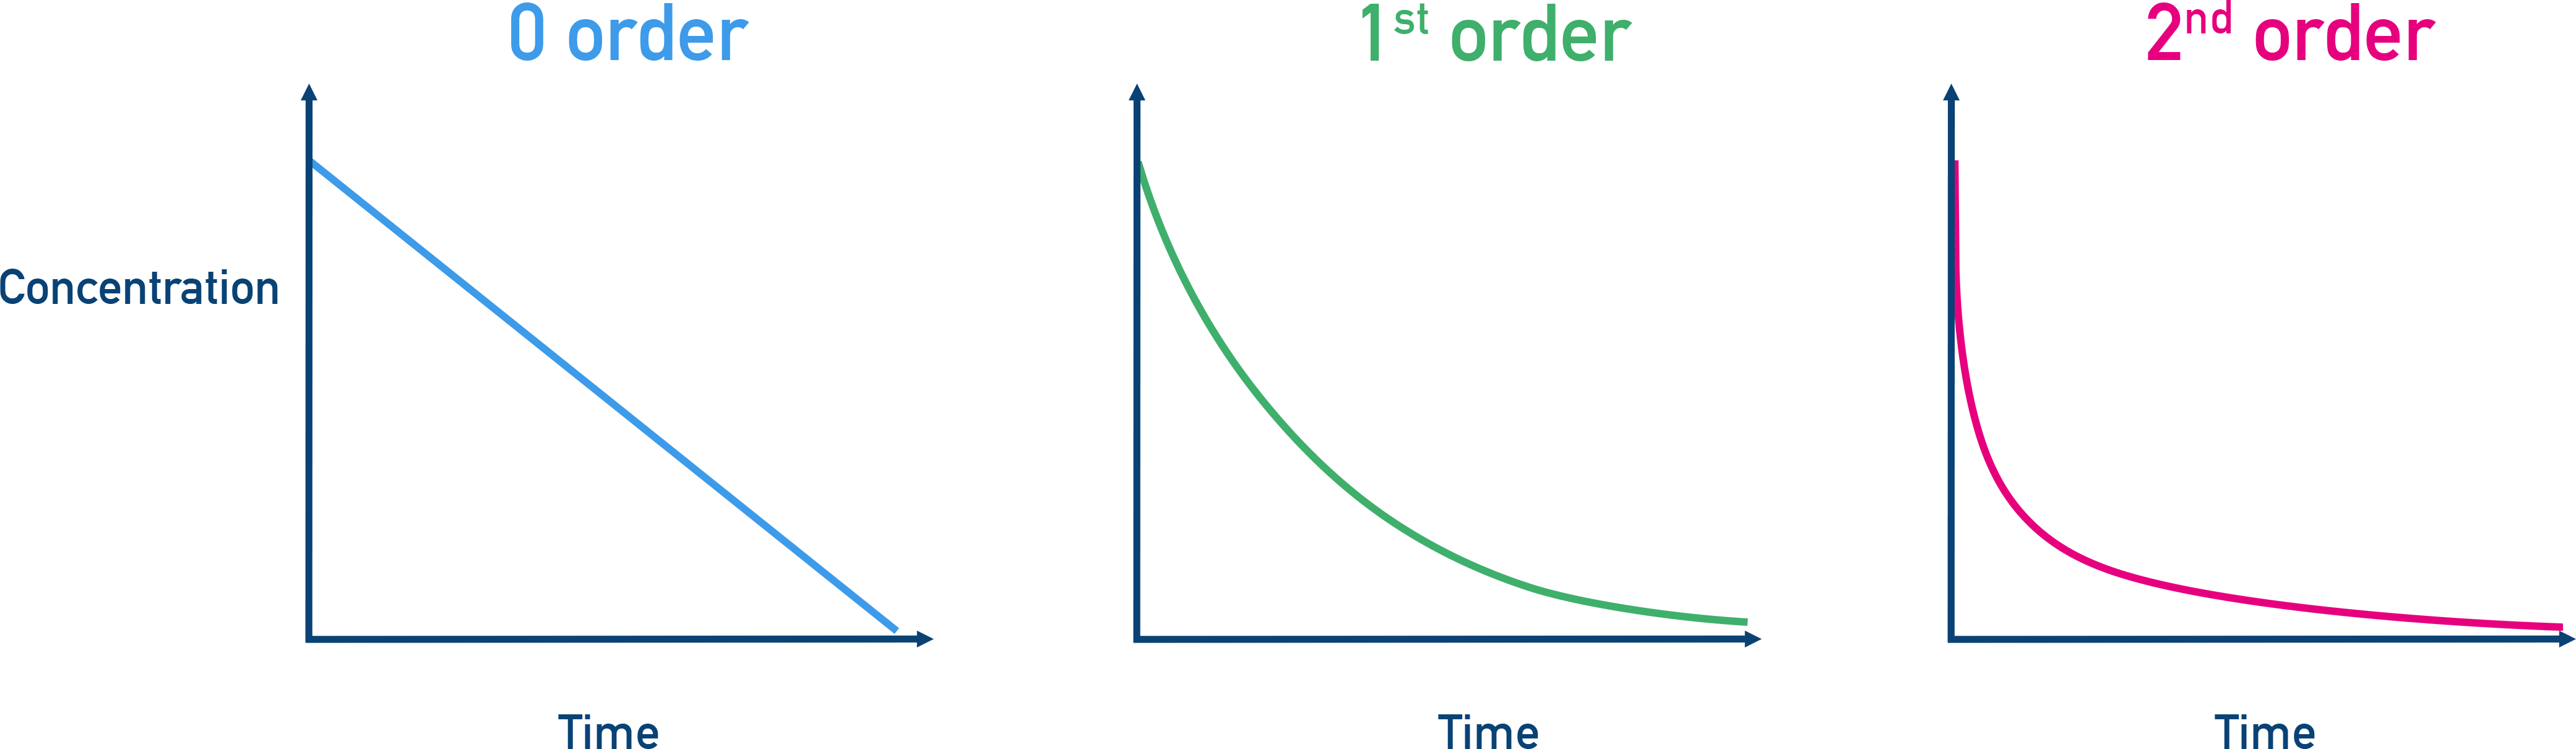
- Zero Order — Concentration vs. time graph is linear (constant rate).
- First Order — Concentration vs. time graph is exponential decay.
- Second Order — Concentration vs. time graph is a steeper exponential decay.
Rate–Concentration Graphs
We can measure concentration at different times during a reaction.
This can be a useful method when it’s difficult to measure initial rates directly. We can use graphs of concentration vs. time to determine the order.
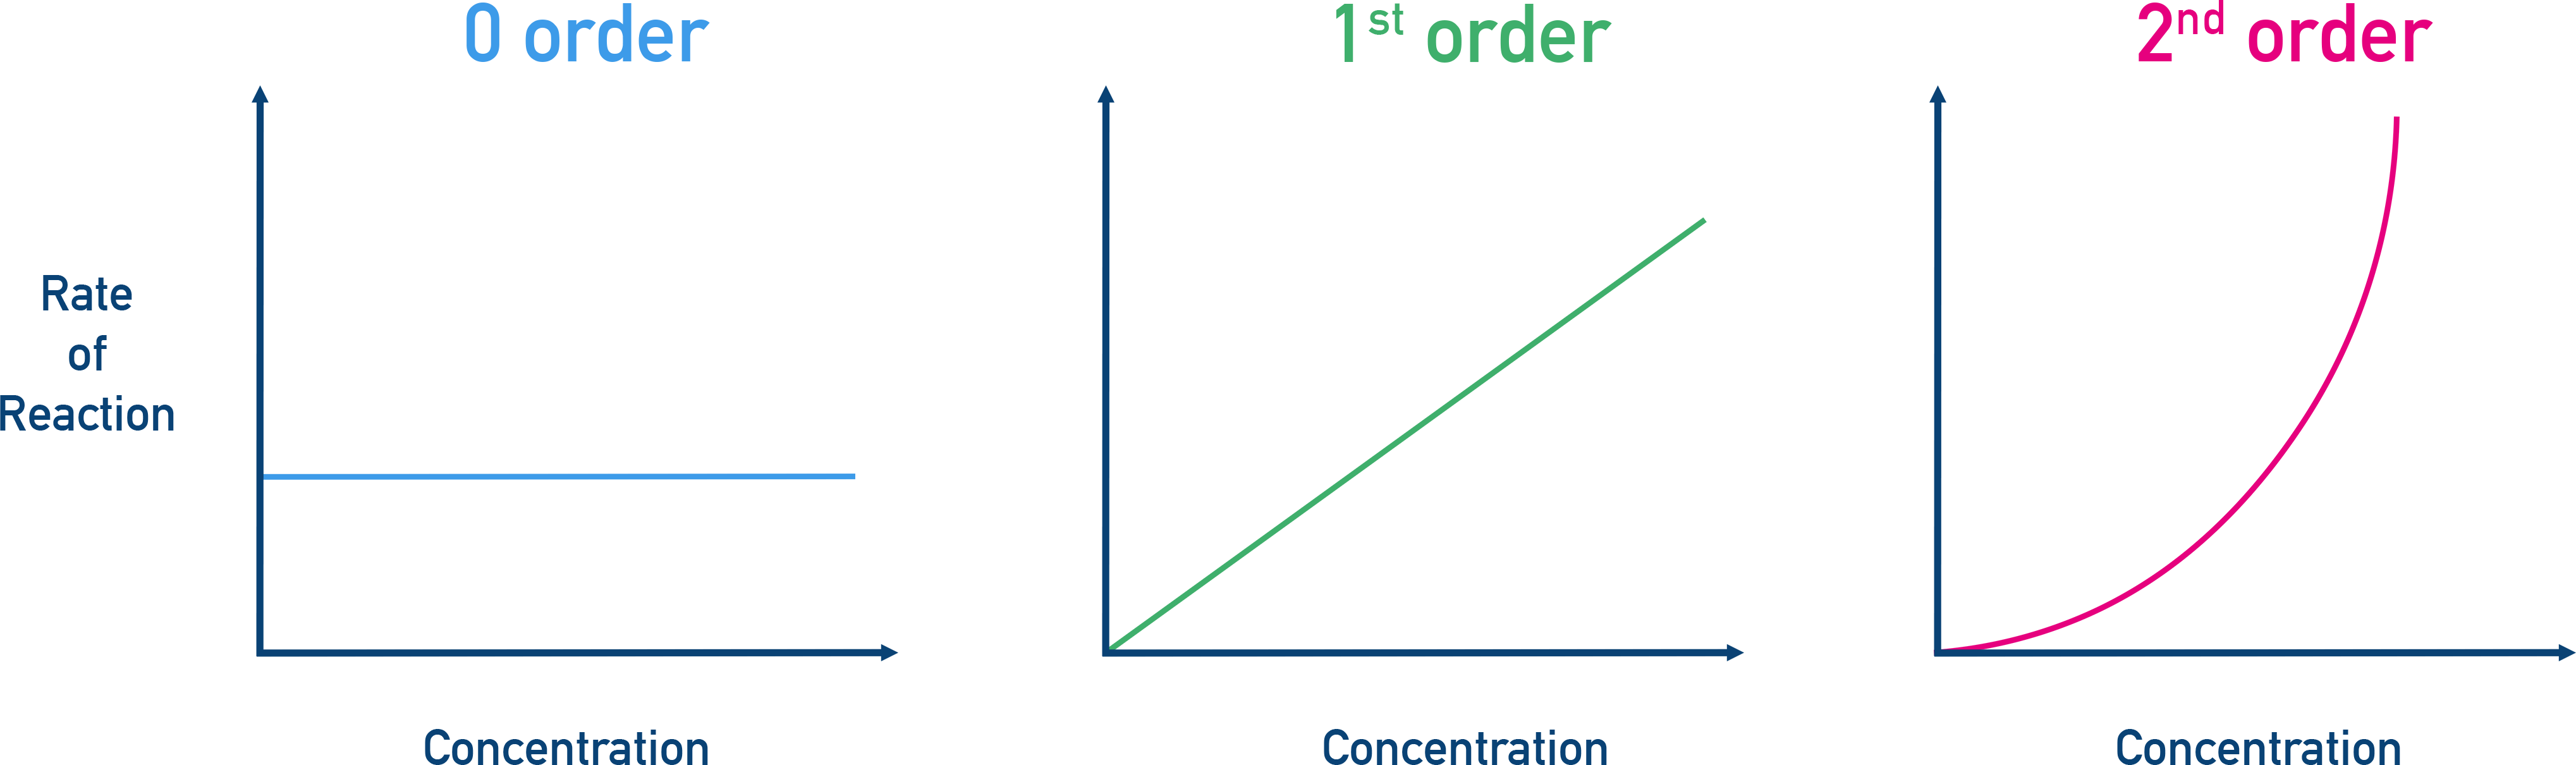
- Zero Order: Rate vs [A] is a horizontal line (rate is constant).
- First Order: Rate vs [A] is a straight line through the origin.
- Second Order: Rate vs [A] is a curve starting from the origin, showing increasing steepness.
Summary
- Reaction order is the exponent of concentration in the rate equation.
- Overall order equals the sum of individual orders.
- Concentration–time and rate–concentration graphs allow orders to be deduced.
- Orders give insight into the particles involved in the rate-determining step.
Linked Course Questions
What measurements are needed to deduce the order of reaction for a specific reactant?
To determine the order of reaction with respect to a reactant, you need to measure: the initial rate of reaction and the concentration of that reactant while keeping other conditions constant (e.g. temperature, concentrations of other reactants). By repeating the experiment with different concentrations of the reactant and comparing how the rate changes, you can deduce the order: If the rate doesn’t change → zero order. If the rate changes proportionally → first order. If the rate changes with the square of concentration → second order.
Why are reaction mechanisms only considered as “possible mechanisms”?
Reaction mechanisms are predictions based on experimental evidence, like rate equations and identification of intermediates – but they cannot be observed directly. Often, more than one mechanism can often explain the same data, meaning we try and propose mechanisms that are most consistent with the evidence, but these remain theoretical predictions. Meaning we can only ever say they are a ‘possibility’ for how a given reaction occurs.