
Rate of Reaction
Quick Notes:
- The rate of reaction is the change in concentration of a reactant or product per unit time.
- Units are usually mol dm⁻³ s⁻¹.
- Can also be measured by changes in mass or volume over time.
- Rate can be determined by:
- Calculating the gradient (slope) of a concentration–time graph.
- Drawing a tangent to a curve at a point to estimate the instantaneous rate.
Full Notes:
Definition of Rate of Reaction
The rate of a chemical reaction is defined as the change in concentration of a reactant or product per unit time.
Rate = change in concentration / time
Units: mol dm⁻³ s⁻¹ (for concentration), g s⁻¹ (for mass), or cm³ s⁻¹ (for gas volume).
Measuring Reaction Rate
Rates can be measured by observing how a property changes with time:
- Concentration (using colorimetry or titration)
- Mass (loss of mass in an open container)
- Volume (gas collected in a syringe or over water)
Concentration–time graph
Concentration–time graphs give useful information about the rate of a reaction and how it changes during the reaction.
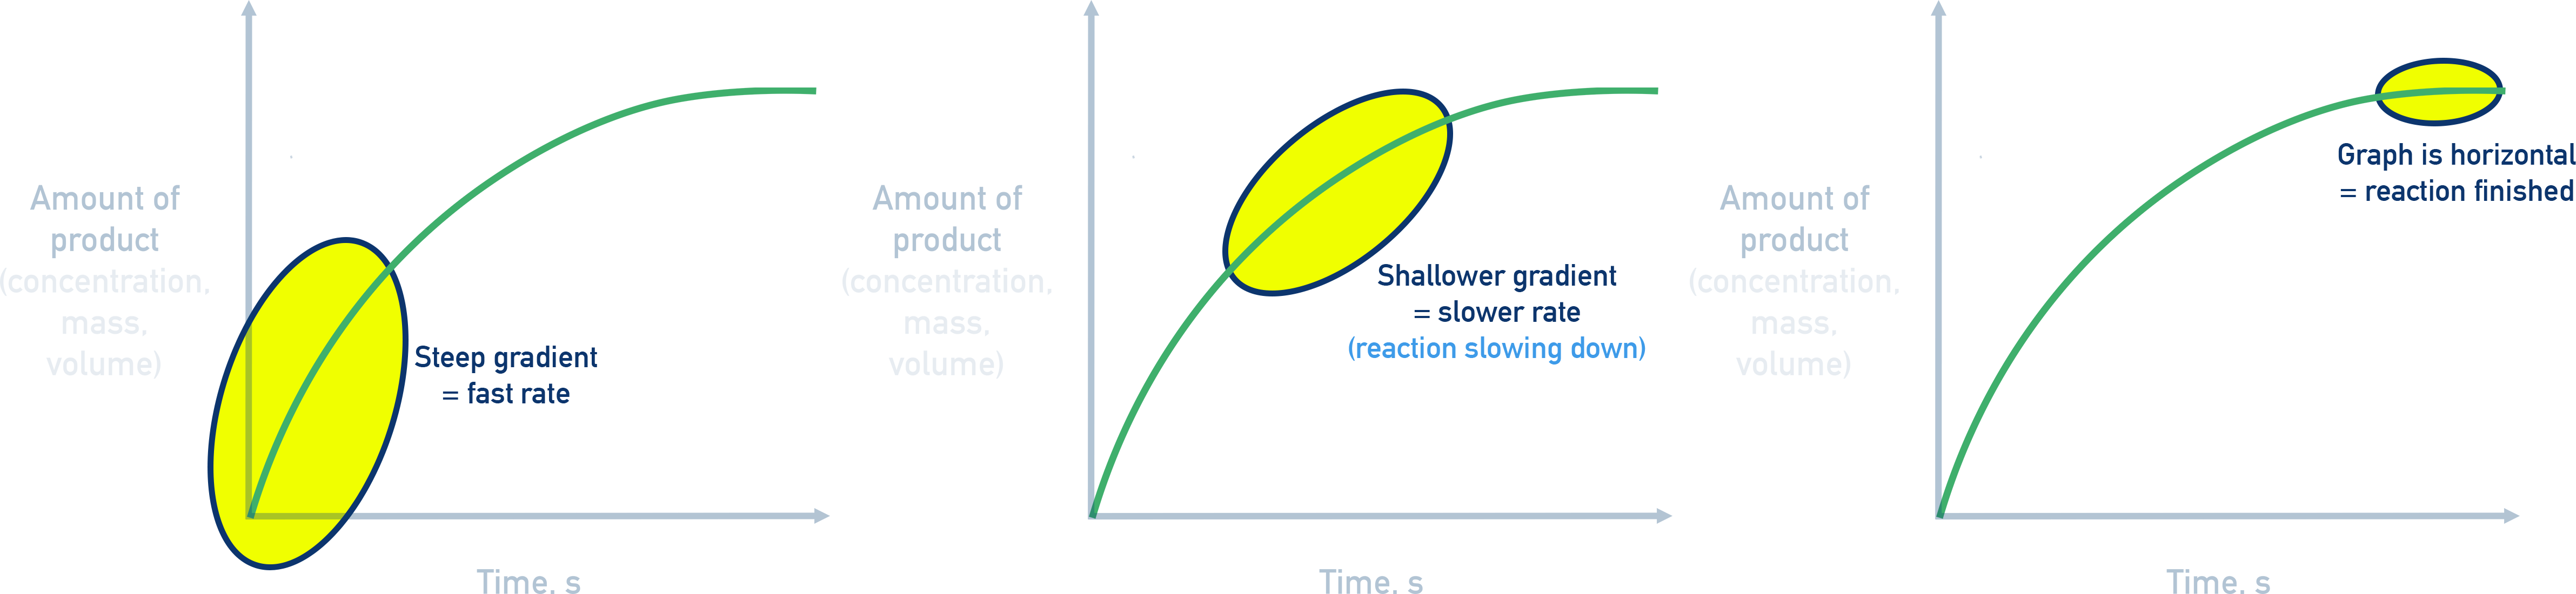
Gradient = rate of reaction
- A steep slope = fast reaction
- A flat slope = reaction is slowing or has stopped
Note - concentration can refer to reactant or product. If reactant concentration change is measured, a steep downward curve represents a fast rate of reaction (as reactant concentration decreases as reaction occurs). The opposite is true if product concentration change is measured (an upward curve is observed).
To calculate instantaneous rate:
An instantaneous rate is a rate at an exact moment in time. We can use a concentration-time graph find an instantaneous rate.
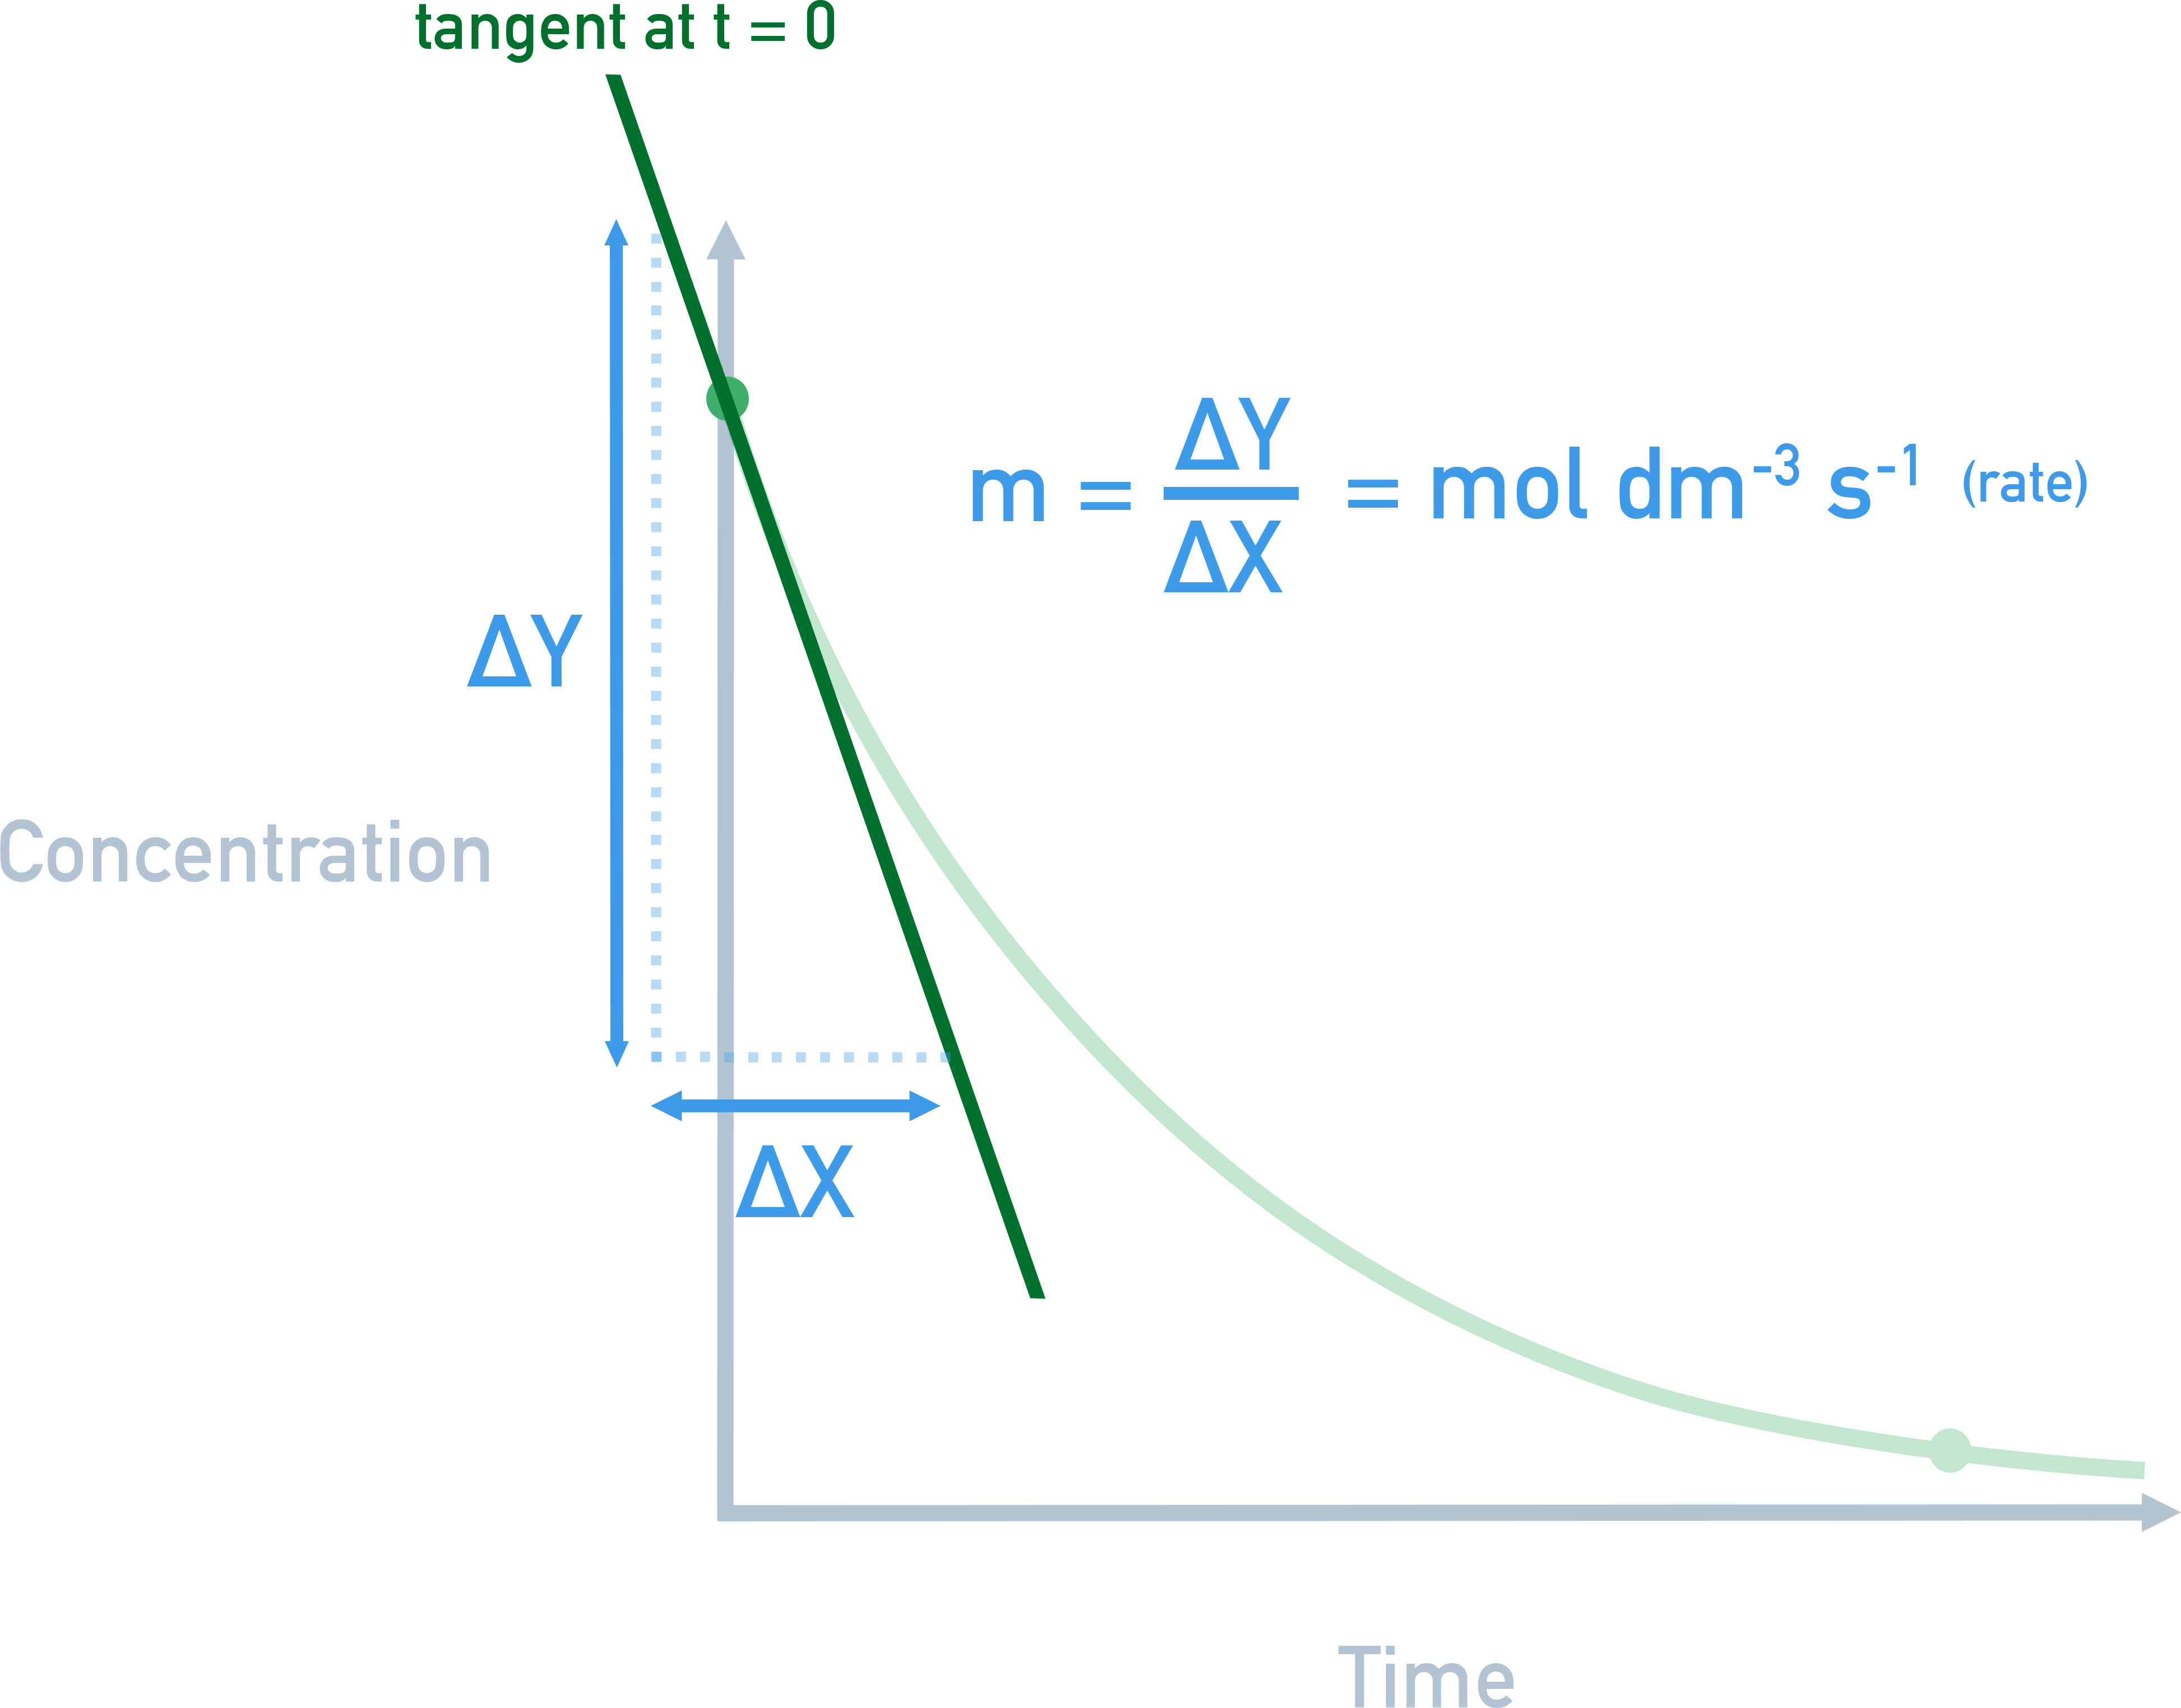
- Draw a tangent at the point of interest on the curve.
- Find the gradient of the tangent (rise/run).
Other graph types:
Volume–time or mass–time graphs can also be used. Tangents and gradients still represent the rate.
Example - Measuring Initial Rate of Reaction
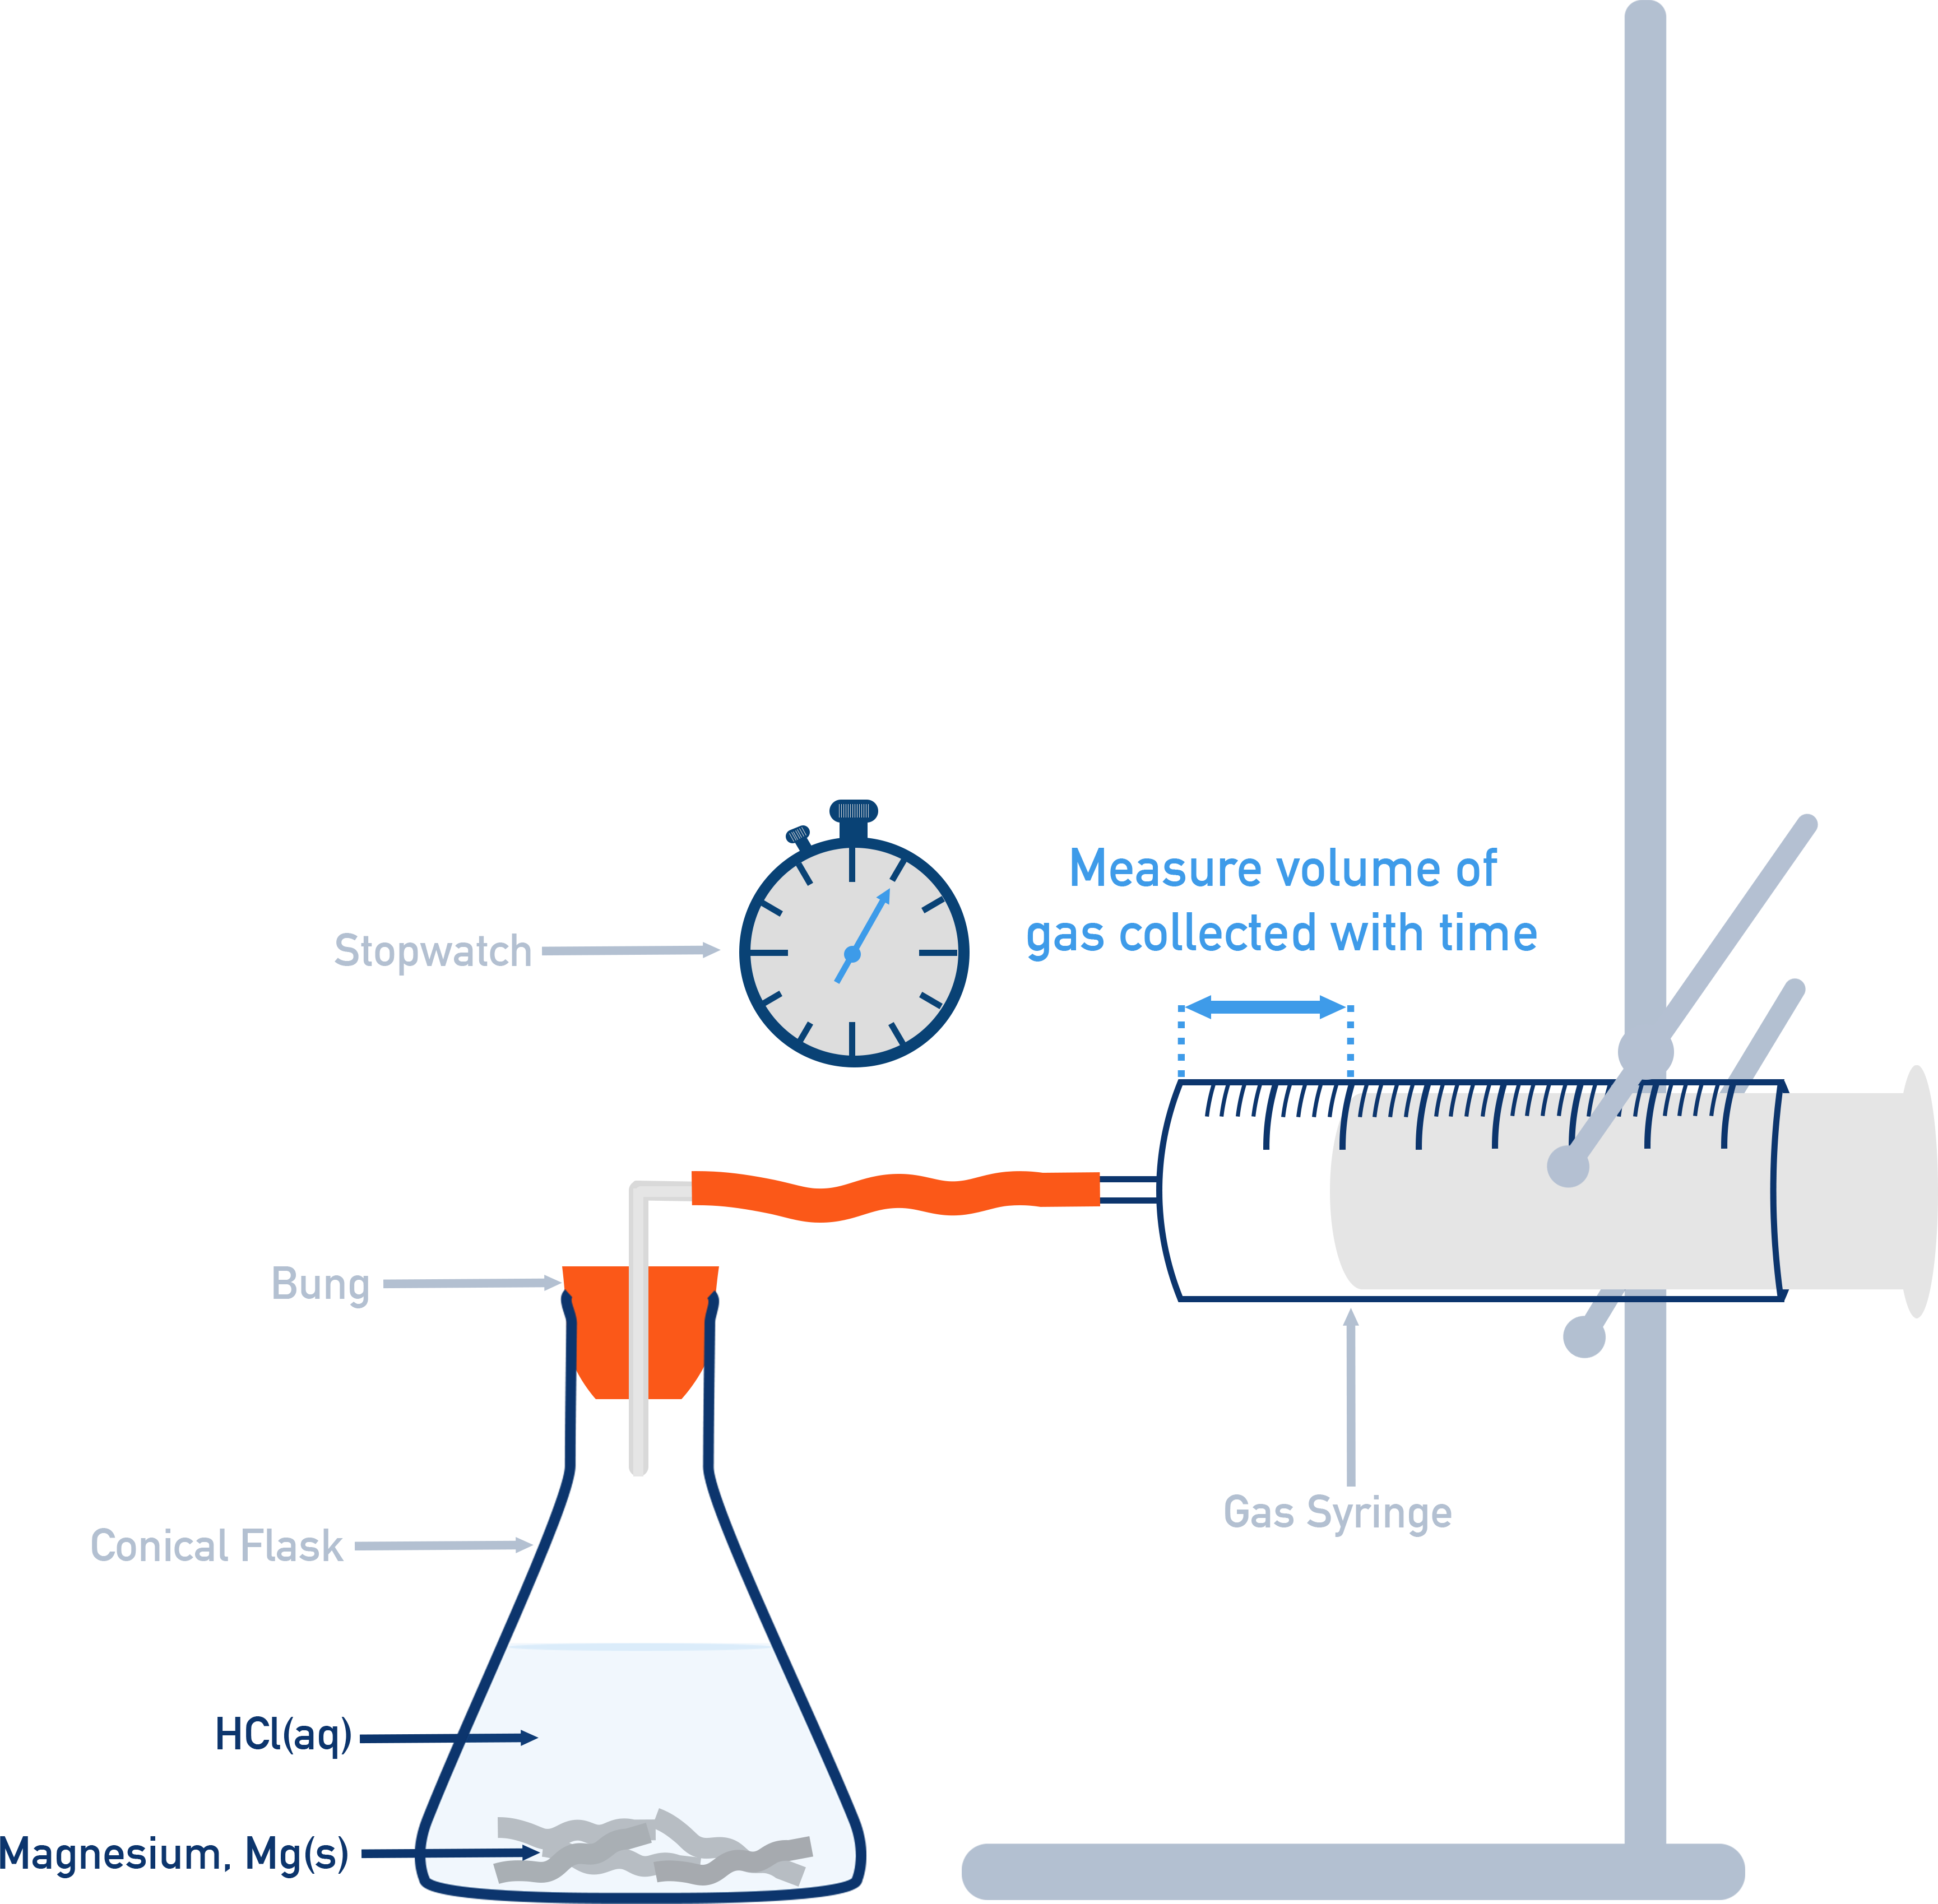
Measure initial rate of hydrogen gas production when magnesium reacts with HCl at different concentrations.
Reaction: Mg(s) + 2HCl(aq) → MgCl2(aq) + H2(g)
Apparatus and Reagents:
- Magnesium ribbon
- 0.8 mol dm⁻³ hydrochloric acid
- Conical flask (100 cm³), gas syringe or water trough setup
- Delivery tube and bung
- Measuring cylinders
- Stopwatch
Method Summary:
- Add 50 cm³ of 0.8 mol dm⁻³ HCl to a conical flask.
- Add 6 cm Mg ribbon, insert bung.
- Record volume of H2 gas every 15 s for 2.5 min.
- Repeat using 0.4 mol dm⁻³ HCl (prepared by diluting with water).
Analysis:
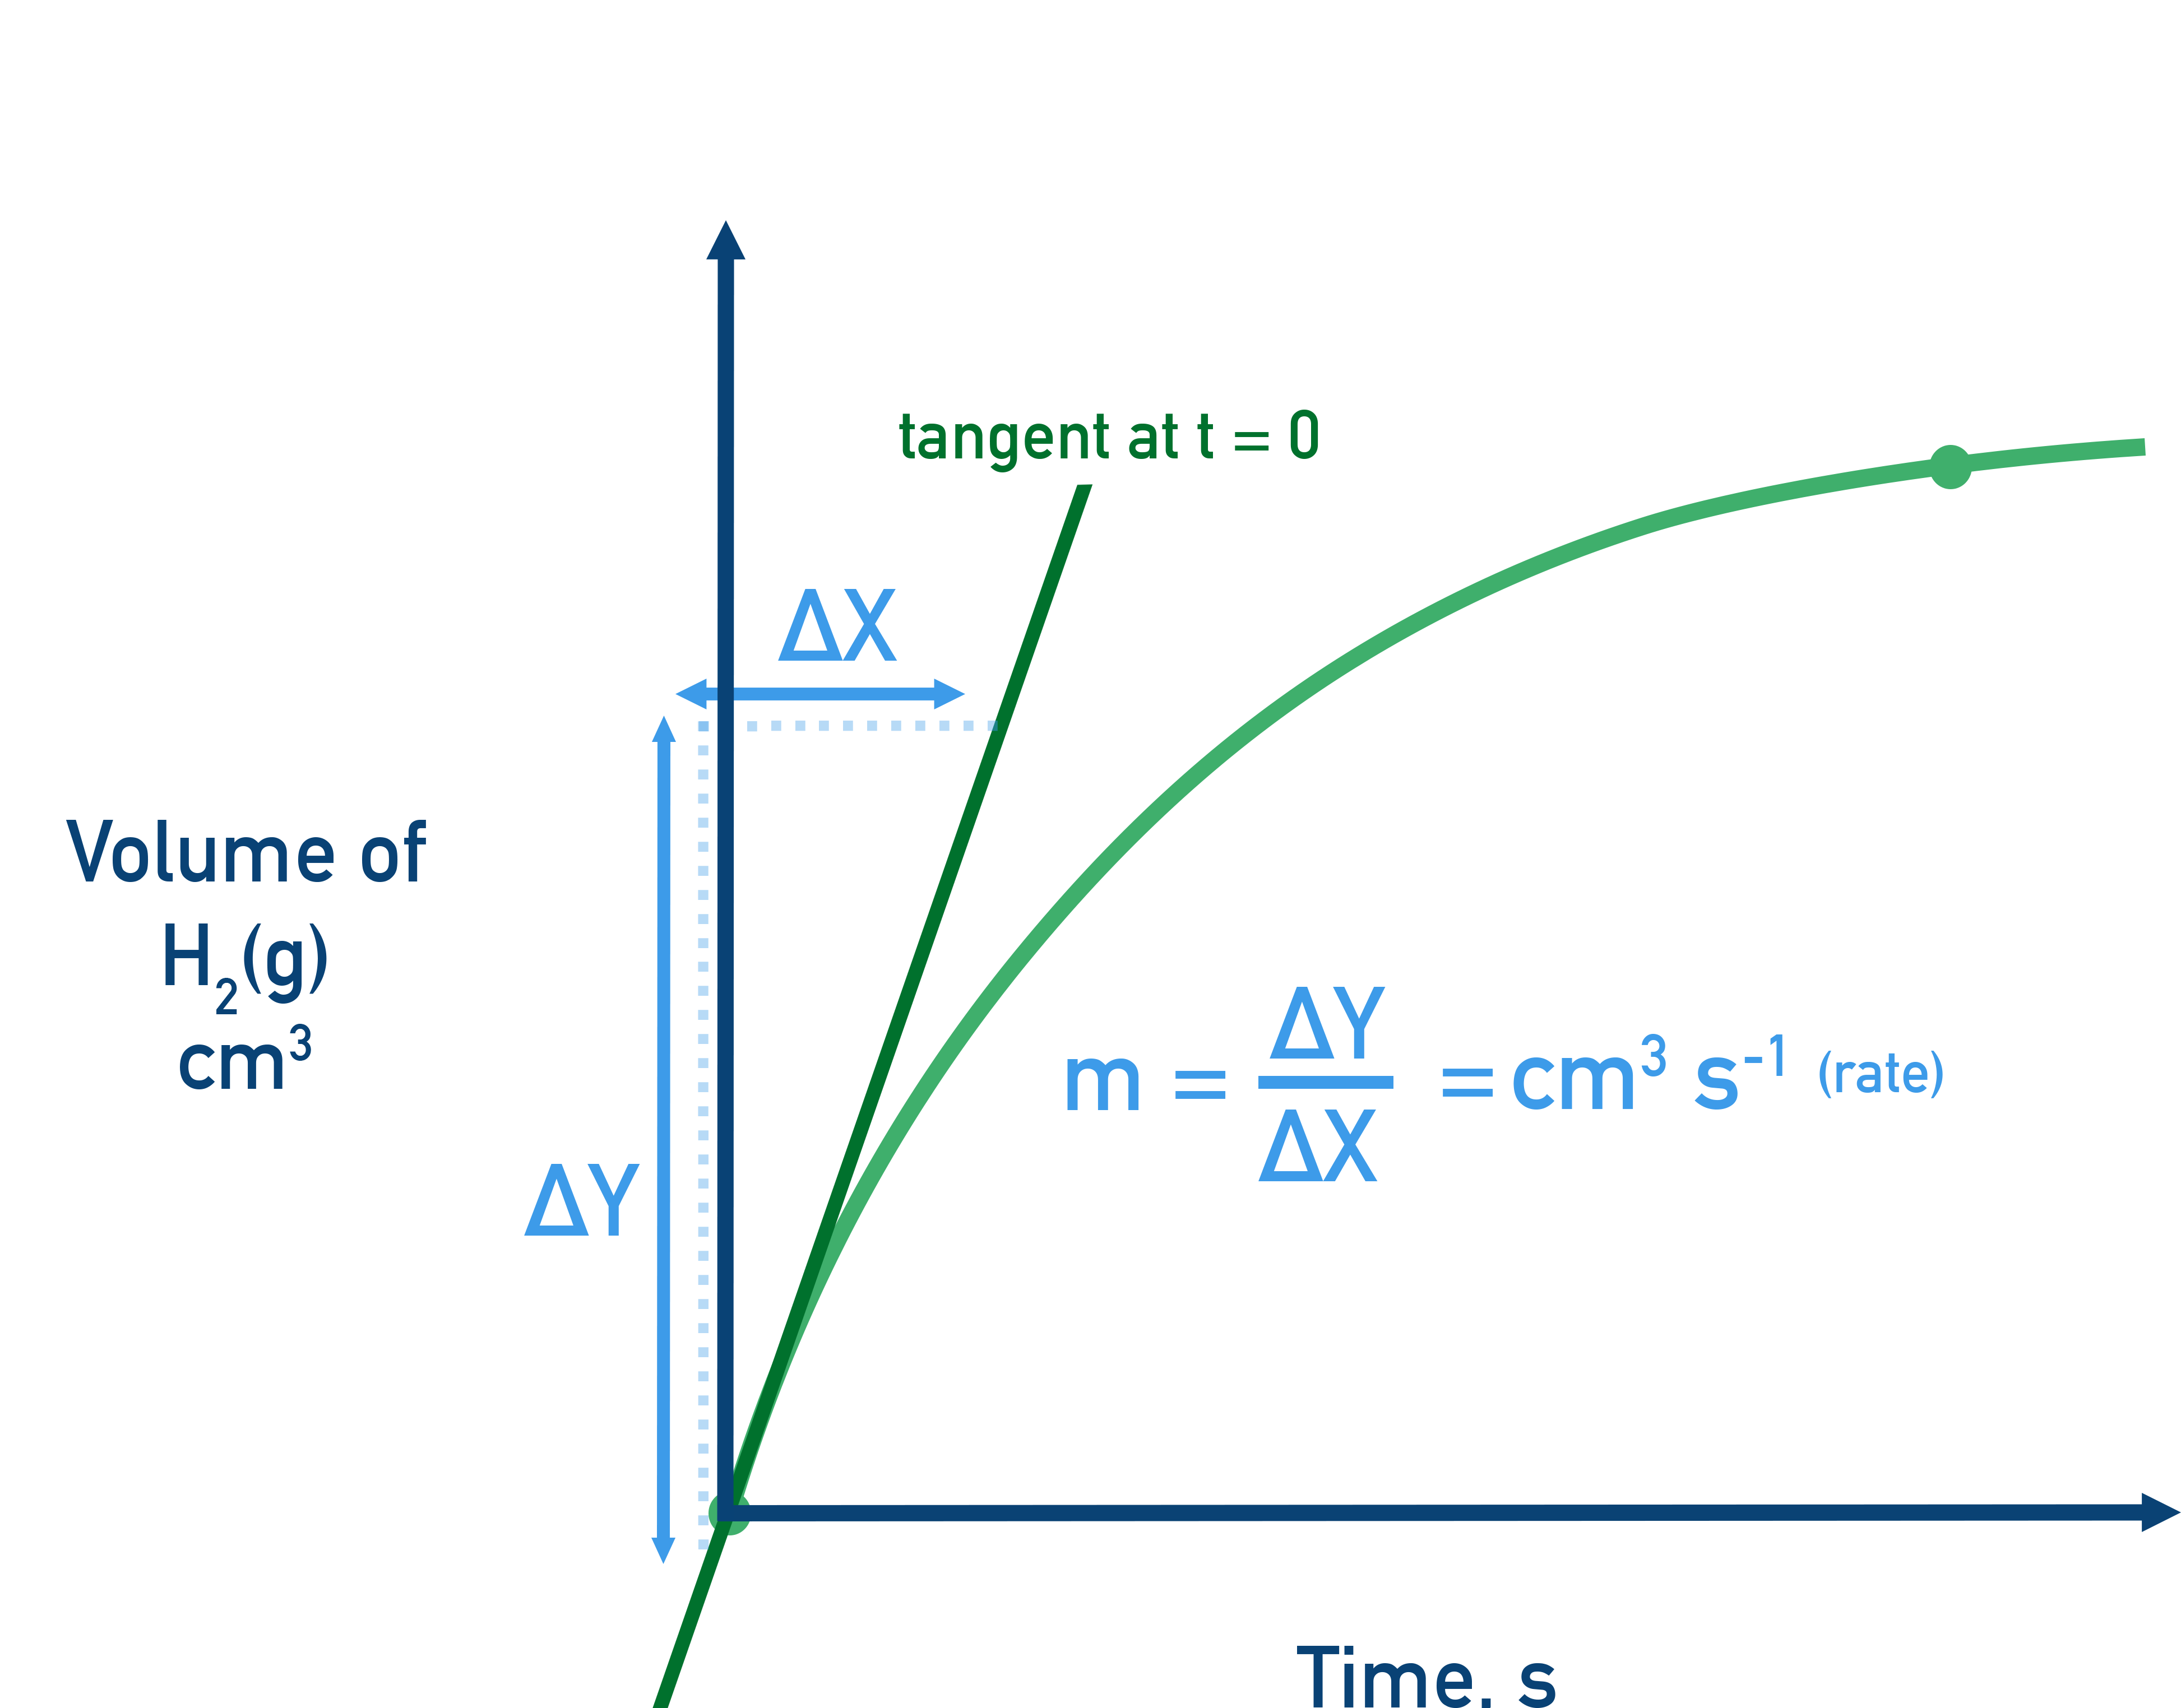
- Plot volume of H2 (y-axis) vs time (x-axis)
- Draw lines of best fit and tangents at t = 0
- Calculate gradients = rate
- Compare rates for both acid concentrations
Summary
- Reaction rate tells us how quickly a chemical change occurs.
- It is calculated from the slope of concentration–time, mass–time, or volume–time graphs.
- Tangents allow estimation of instantaneous rates at specific times.
Linked Course Questions
Concentration changes in reactions are not usually measured directly. What methods are used to provide data to determine the rate of reactions?
Concentration changes are often measured indirectly by tracking a physical property that changes during the reaction. Common methods include:
- Change in mass (e.g. when a gas is released)
- Change in volume of gas produced (using a gas syringe or inverted burette)
- Change in colour or absorbance (using colorimetry or spectrophotometry)
- Change in pH (for reactions involving acids or bases)
- Change in conductivity (if ions are produced or consumed)
These measurements are taken at regular time intervals to calculate the rate of reaction from the change over time.
What experiments measuring reaction rates might use time as i) a dependent variable ii) an independent variable?
In reaction rate experiments, time can be used as:
- i) A dependent variable when you measure how long it takes for a specific event to occur — e.g. the time for a cross to disappear in a reaction producing a precipitate, or the time for a colour change to occur.
- ii) An independent variable when you take measurements at regular time intervals to track how a property (like mass, volume of gas, or absorbance) changes over time. This is the most common approach in rate experiments.