
Gas Laws and the Molar Volume of an Ideal Gas
Quick Notes
- The molar volume of an ideal gas is the volume occupied by 1 mole at a specific temperature and pressure.
- At STP (0 °C and 1 atm): molar volume = 22.7 dm³ mol⁻¹.
- The ideal gas equation: pV = nRT
- p = pressure (Pa)
- V = volume (m³)
- n = moles
- R = 8.31 J mol⁻¹ K⁻¹
- T = temperature (K)
- Relationships for a fixed amount of gas:
- Boyle’s Law: pressure increases → volume decreases (inverse relationship)
- Charles’s Law: temperature increases → volume increases (direct relationship)
- Gay-Lussac’s Law: temperature increases → pressure increases (direct relationship)
- Graphs of these laws show either curves (inverse) or straight lines (direct).
Full Notes
Molar Volume of an Ideal Gas
The molar volume is the volume one mole of gas occupies under a set temperature and pressure.
At standard temperature and pressure (STP):
- Temperature = 273 K (0 °C)
- Pressure = 100 kPa (1 atm)
- Molar volume = 22.7 dm³ mol⁻¹
This value allows easy conversion between moles and gas volumes under standard conditions.
Ideal Gas Equation: pV = nRT
The ideal gas equation connects pressure, volume, temperature, and amount of an ideal gas:

Rearranged forms:
- V = nRT ÷ p
- T = pV ÷ nR
- p = nRT ÷ V

Pay close attention to units. Pressure must be in Pa, volume in m³, and temperature in Kelvin. Forgetting conversions is one of the most common mistakes in gas law questions.
Relationships Between Variables (Fixed Mass of Gas)
These three classic gas laws describe how two variables relate when the third is held constant:
Boyle’s Law (pV = constant)
Pressure and volume are inversely related.
If pressure increases, volume decreases (and vice versa).
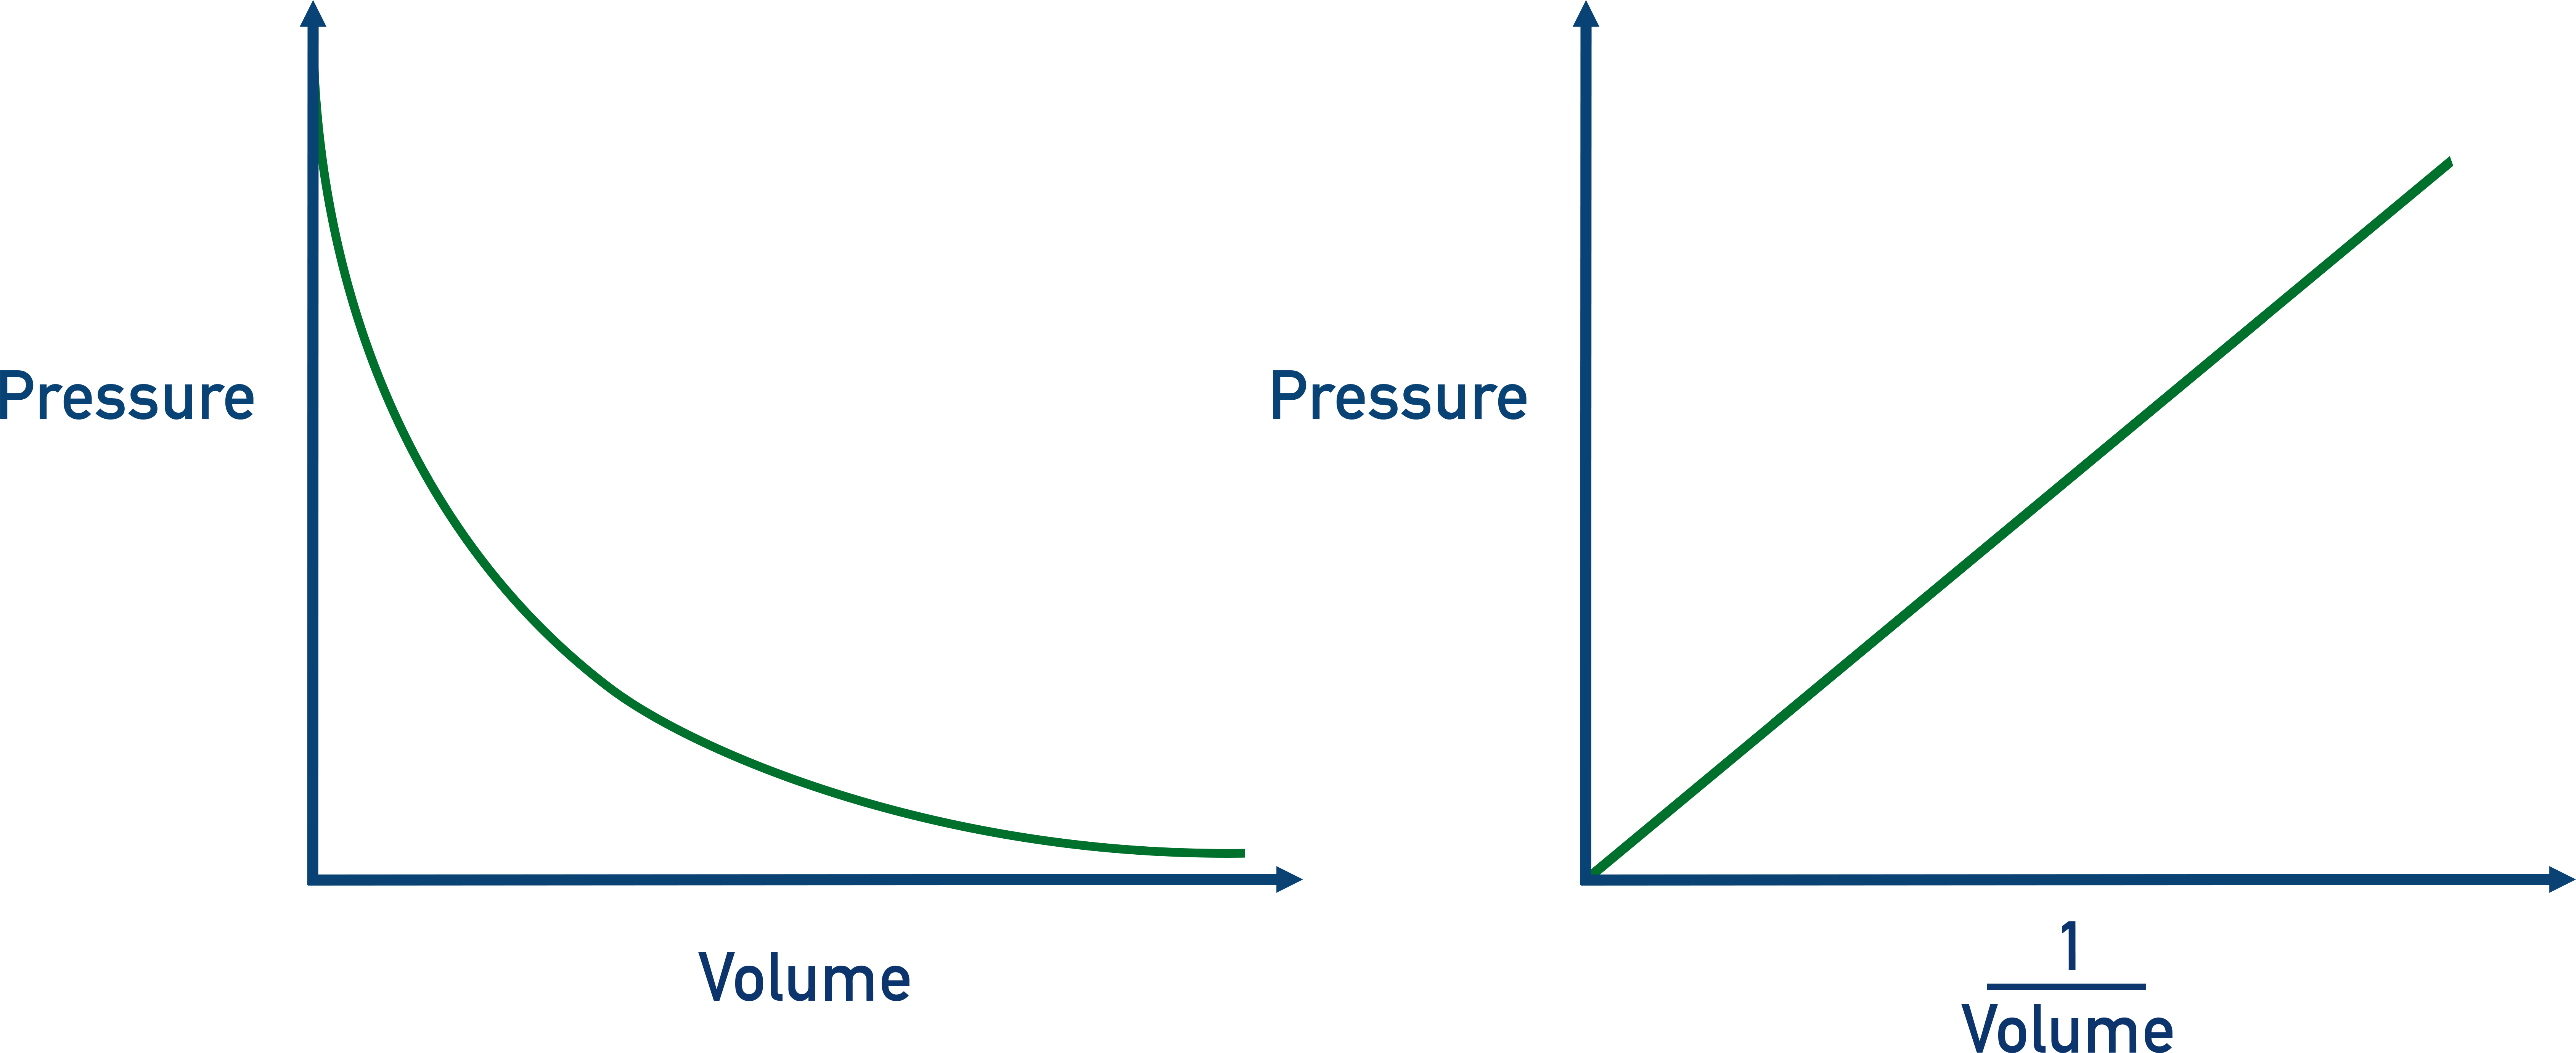
Graph of p vs V gives a downward curve
Graph of p vs 1/V gives a straight line
Charles’s Law (V/T = constant)
Volume and temperature are directly related (T in Kelvin).
As temperature increases, volume increases.
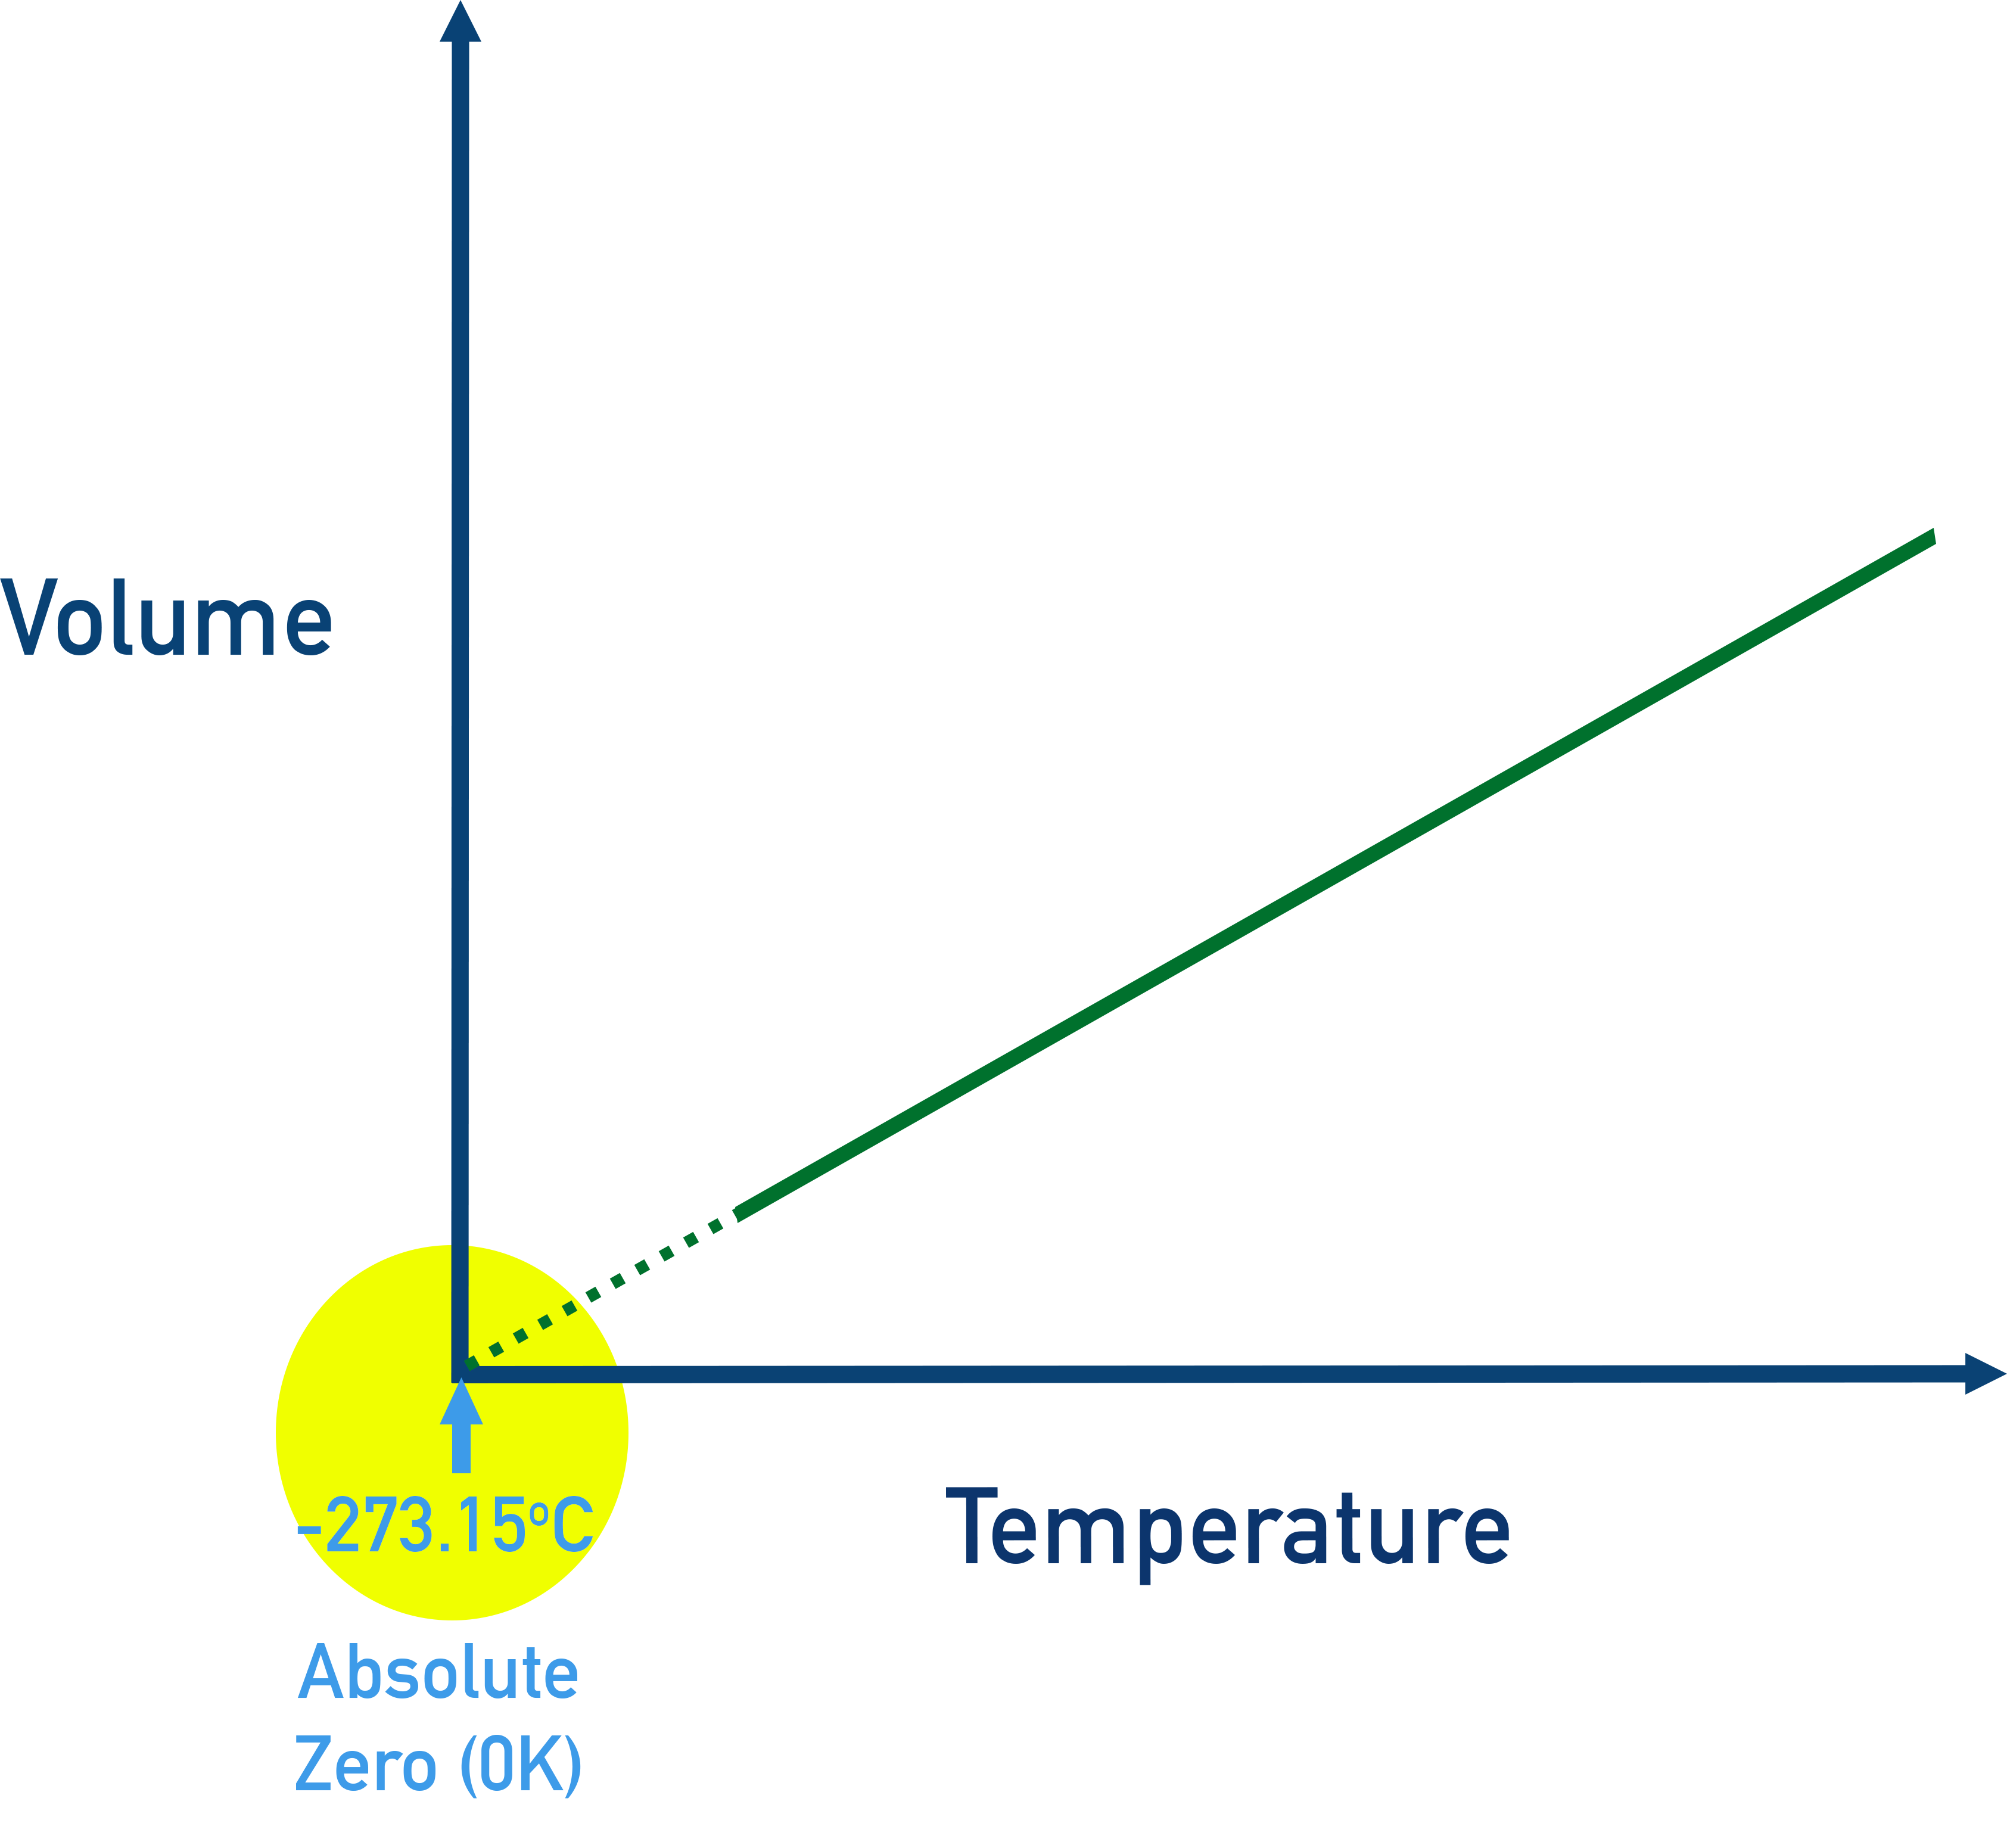
Graph of V vs T gives a straight line
(note this graph can be extrapolated back to find absolute zero)
Gay-Lussac’s Law (p/T = constant)
Pressure and temperature are directly related.
As temperature increases, pressure increases.

Graph of p vs T gives a straight line
Analysing Graphs
We can use the above graphs to identify the type of relationship between variables:
- Curved graph = inverse relationship (Boyle’s Law: p vs V)
- Straight line through origin = direct relationship (Charles’s or Gay-Lussac’s Laws)
Always check that temperature is in Kelvin, not Celsius, before interpreting graphs.
Summary
- The molar volume of an ideal gas is 22.7 dm³ mol⁻¹ at STP.
- The ideal gas law links pressure, volume, temperature, and moles.
- Boyle’s, Charles’s, and Gay-Lussac’s laws describe relationships when one variable is fixed.
- Graphs show whether the relationship is direct or inverse.