
Emission Spectra and Electromagnetic Radiation
Quick Notes
- Emission spectra are produced when electrons fall from higher to lower energy levels, releasing energy as photons.
- Each photon corresponds to a specific wavelength (or frequency) of light.
- The electromagnetic spectrum includes all types of light, from radio waves to gamma rays.
- Energy, frequency, and wavelength are all related:
- Higher frequency = shorter wavelength = higher energy
- Lower frequency = longer wavelength = lower energy
- Visible light ranges from:
- Red: longest wavelength, lowest energy
- Violet: shortest wavelength, highest energy
- A continuous spectrum shows all wavelengths (e.g., white light through a prism).
- A line spectrum shows only specific wavelengths emitted by excited atoms.
Full Notes:
What Is an Emission Spectrum?
When an atom absorbs energy (e.g., from heat or electricity), its electrons jump to higher energy levels – this is called the excited state.
But electrons don’t stay excited forever. They soon fall back to lower energy levels, and when they do, they release energy in the form of light (photons).
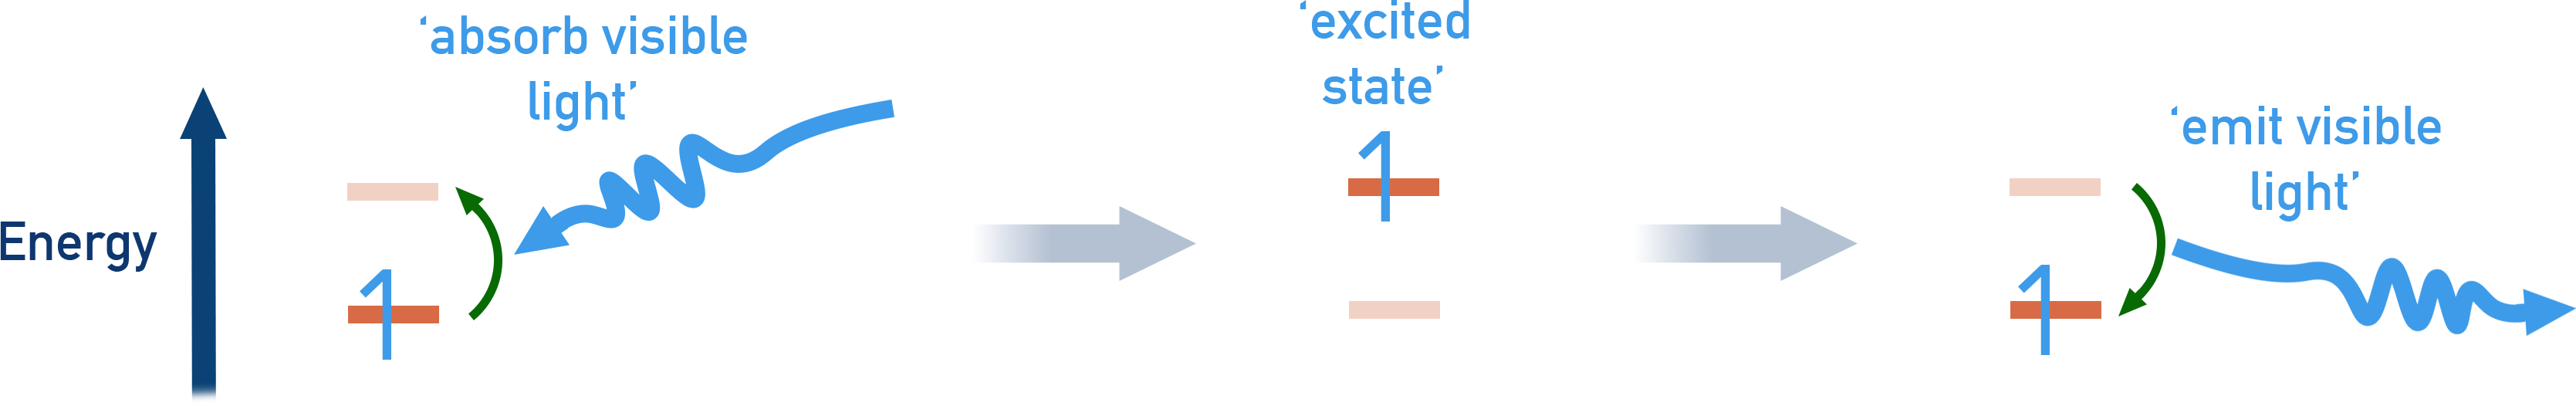
Each jump from one energy level to another releases a photon of a specific energy, which corresponds to a specific wavelength and colour of light.
This can be observed in an emission spectrum — a set of bright lines against a dark background, each one representing a specific transition.
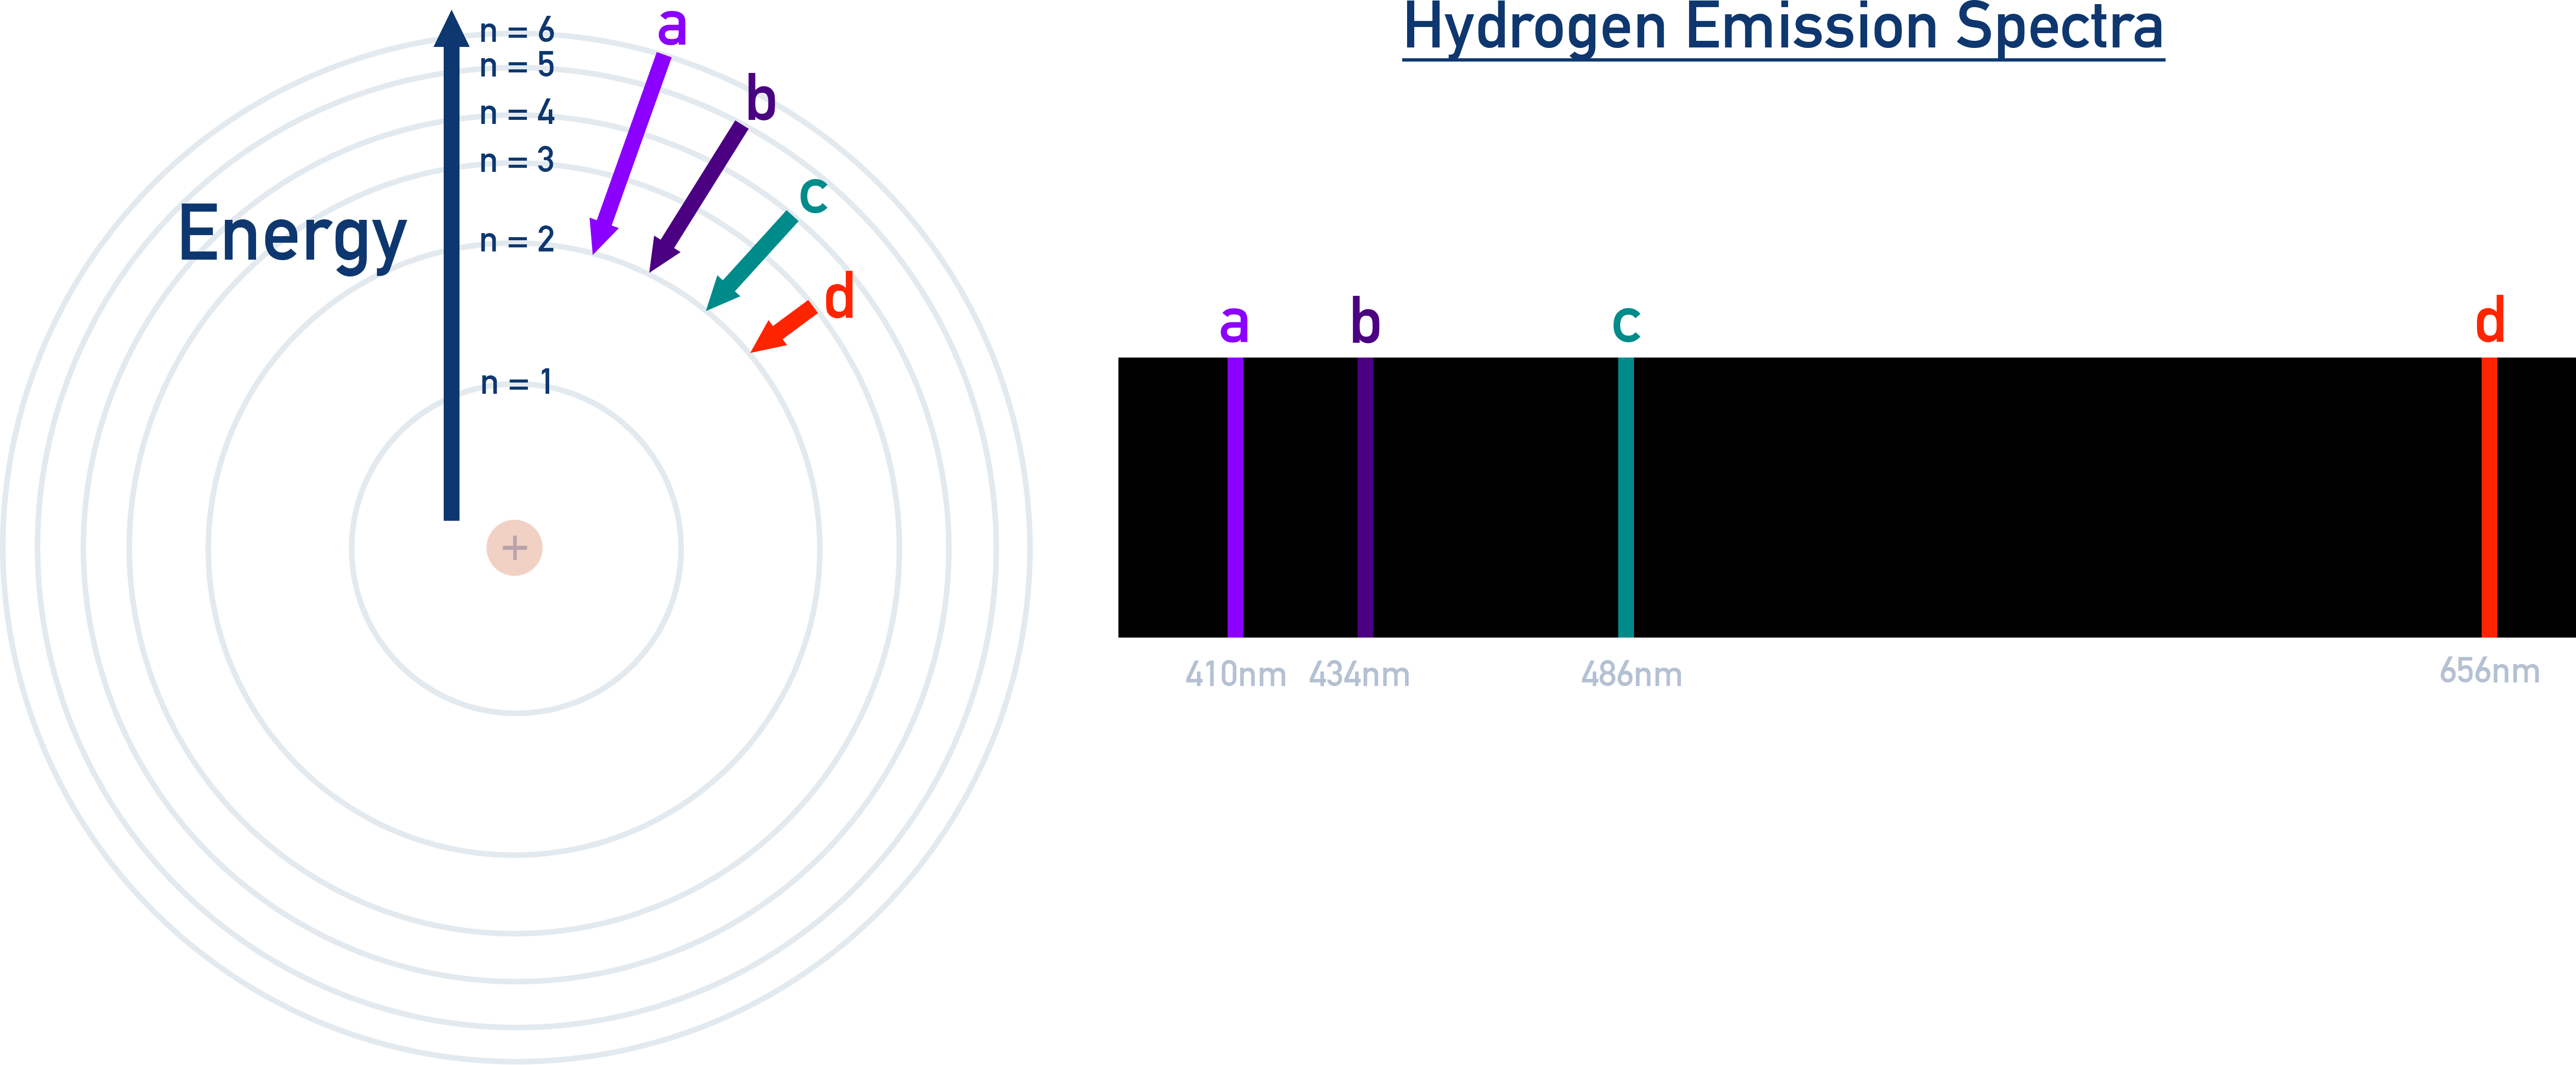
Example – Hydrogen Emission Spectrum
The hydrogen emission spectra shows the specific energies emitted by electrons as they fall to the n = 2 energy level from higher energy levels in an atom of hydrogen.
Continuous vs Line Spectra
A continuous spectrum (like sunlight passed through a prism) contains all visible wavelengths without gaps – it looks like a rainbow.
A line spectrum (like that from hydrogen gas) shows only specific wavelengths. Each line corresponds to an electron transition.
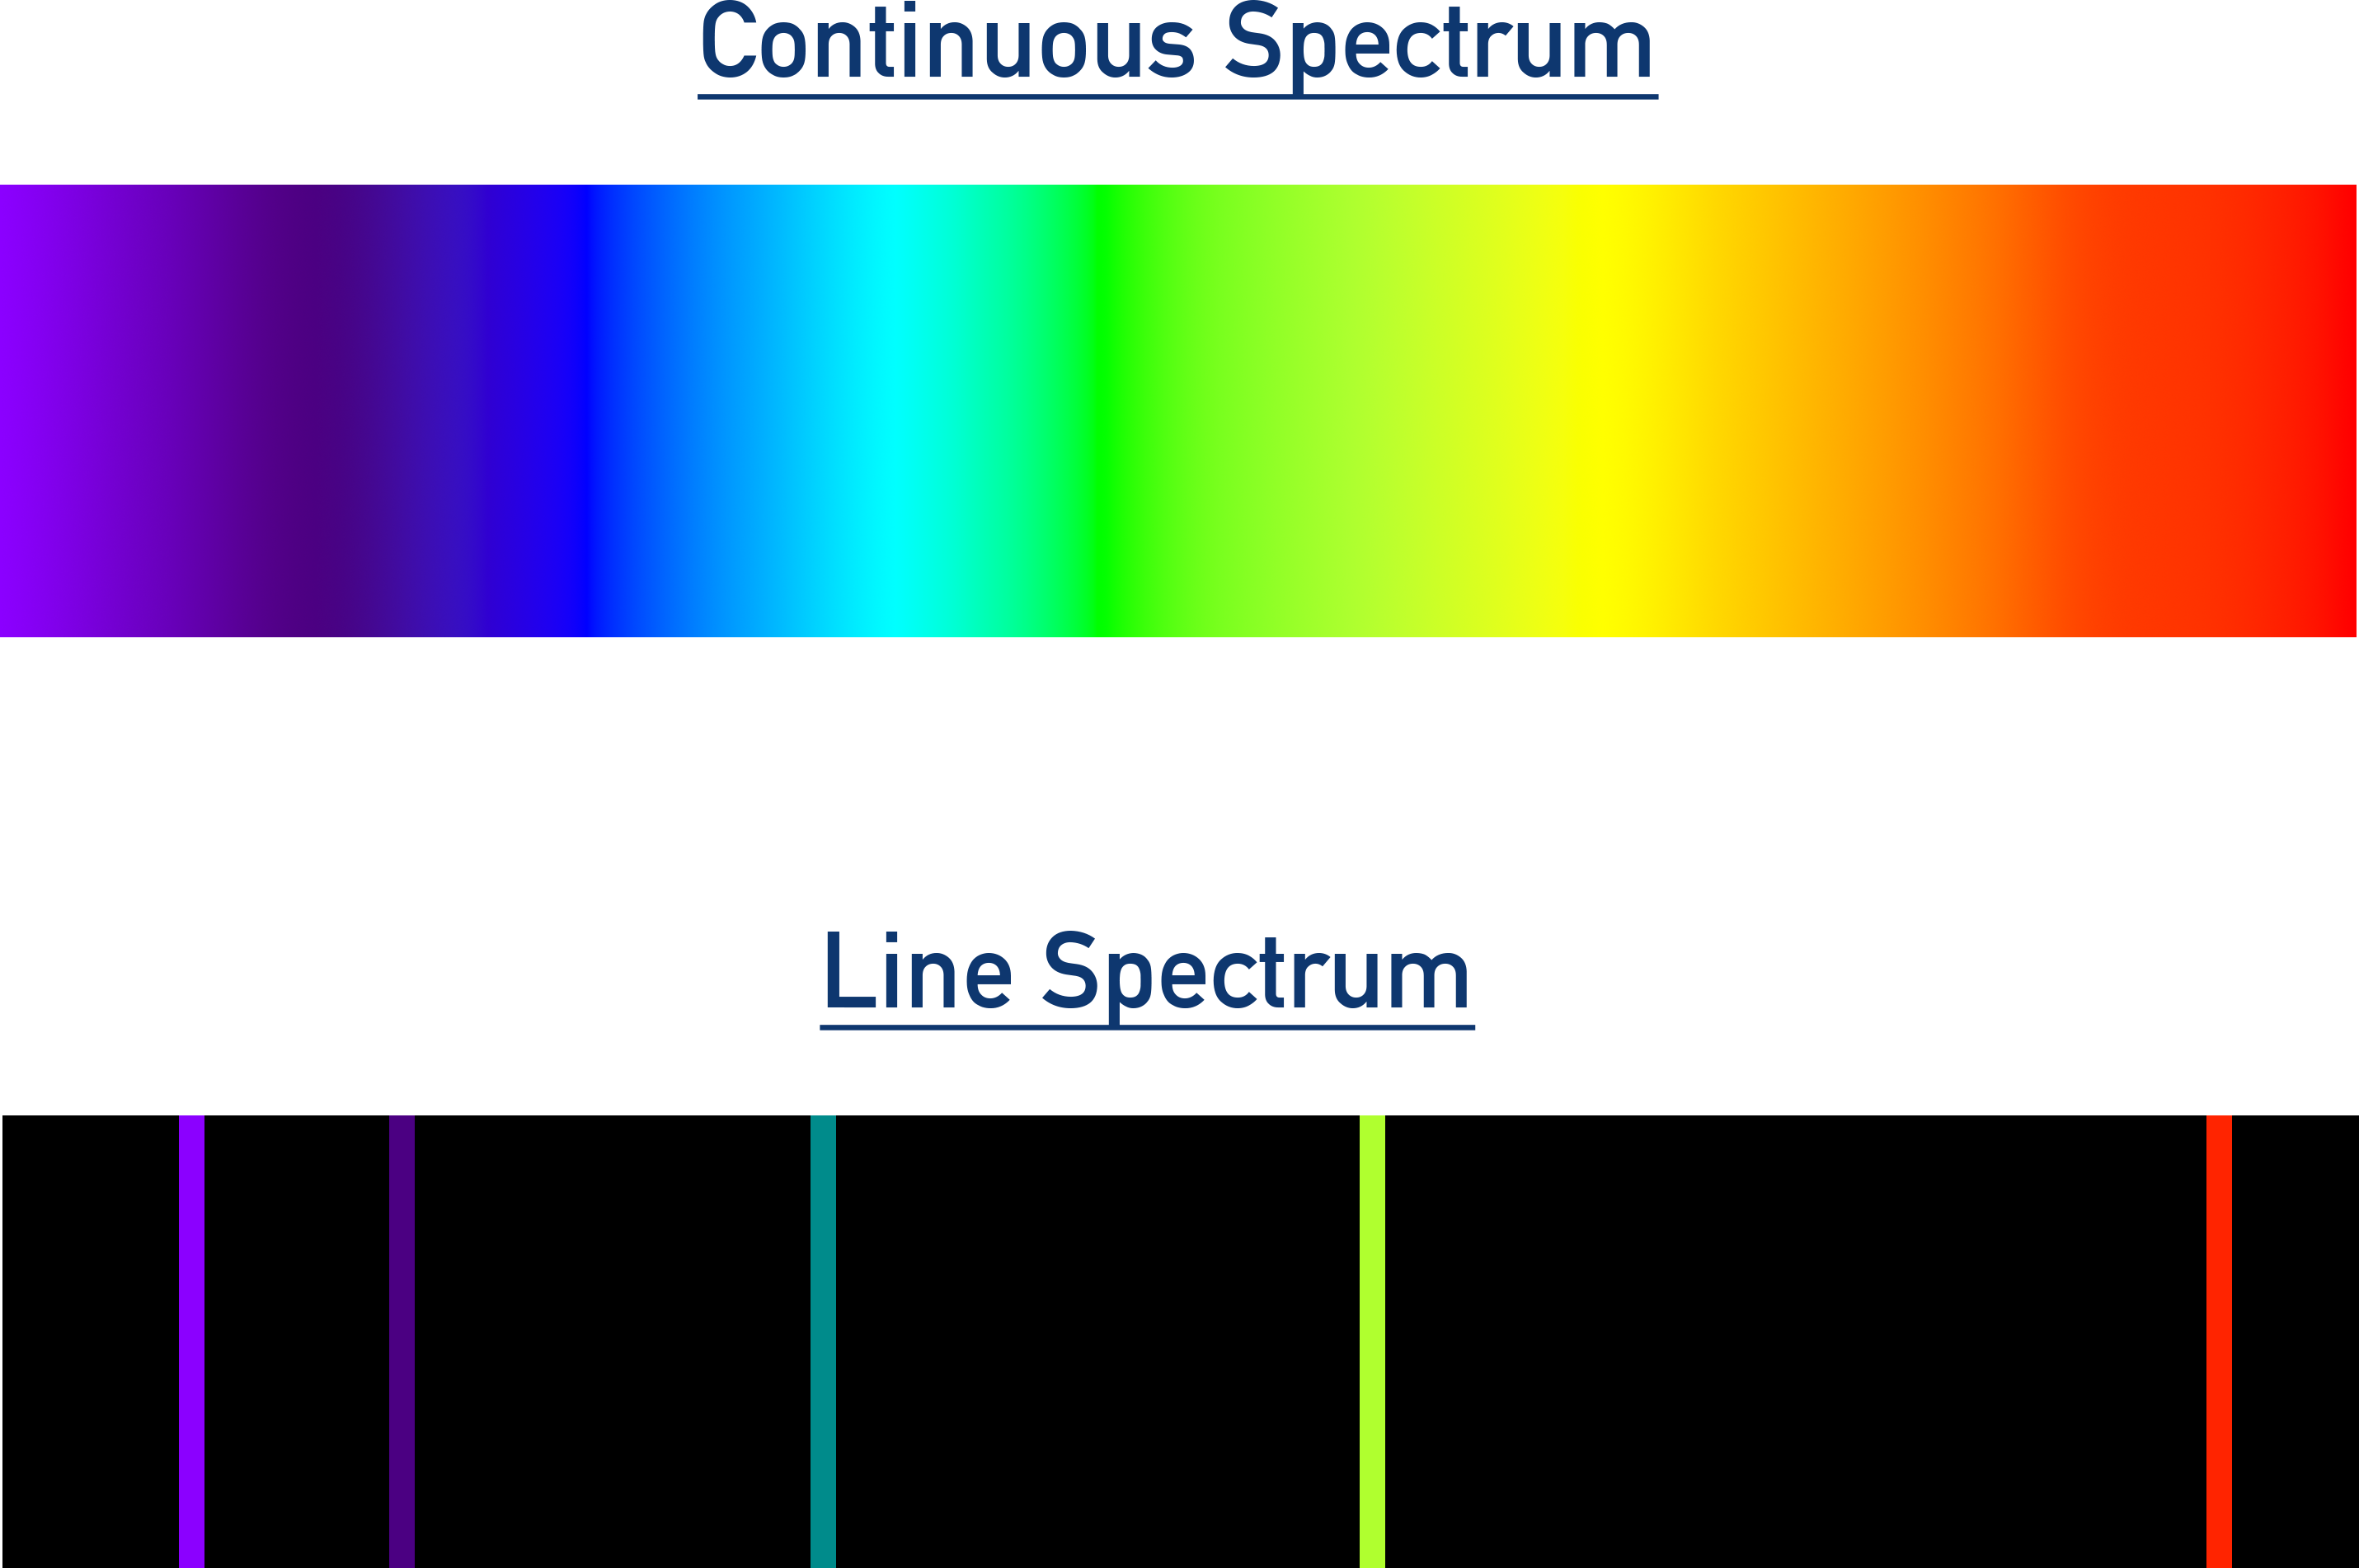
Line spectra are like fingerprints – unique to each element.
The Electromagnetic Spectrum: Key Relationships
The electromagnetic spectrum includes many types of radiation, from radio waves to gamma rays. These differ in their:
- Wavelength (distance between wave peaks)
- Frequency (number of waves per second)
- Energy (how much energy each photon carries)
General relationships:
- Shorter wavelength = Higher frequency → Higher energy
- Longer wavelength = Lower frequency → Lower energy
The section of the electromagnetic spectrum we can see is the visible light range (approx. 400–700 nm):
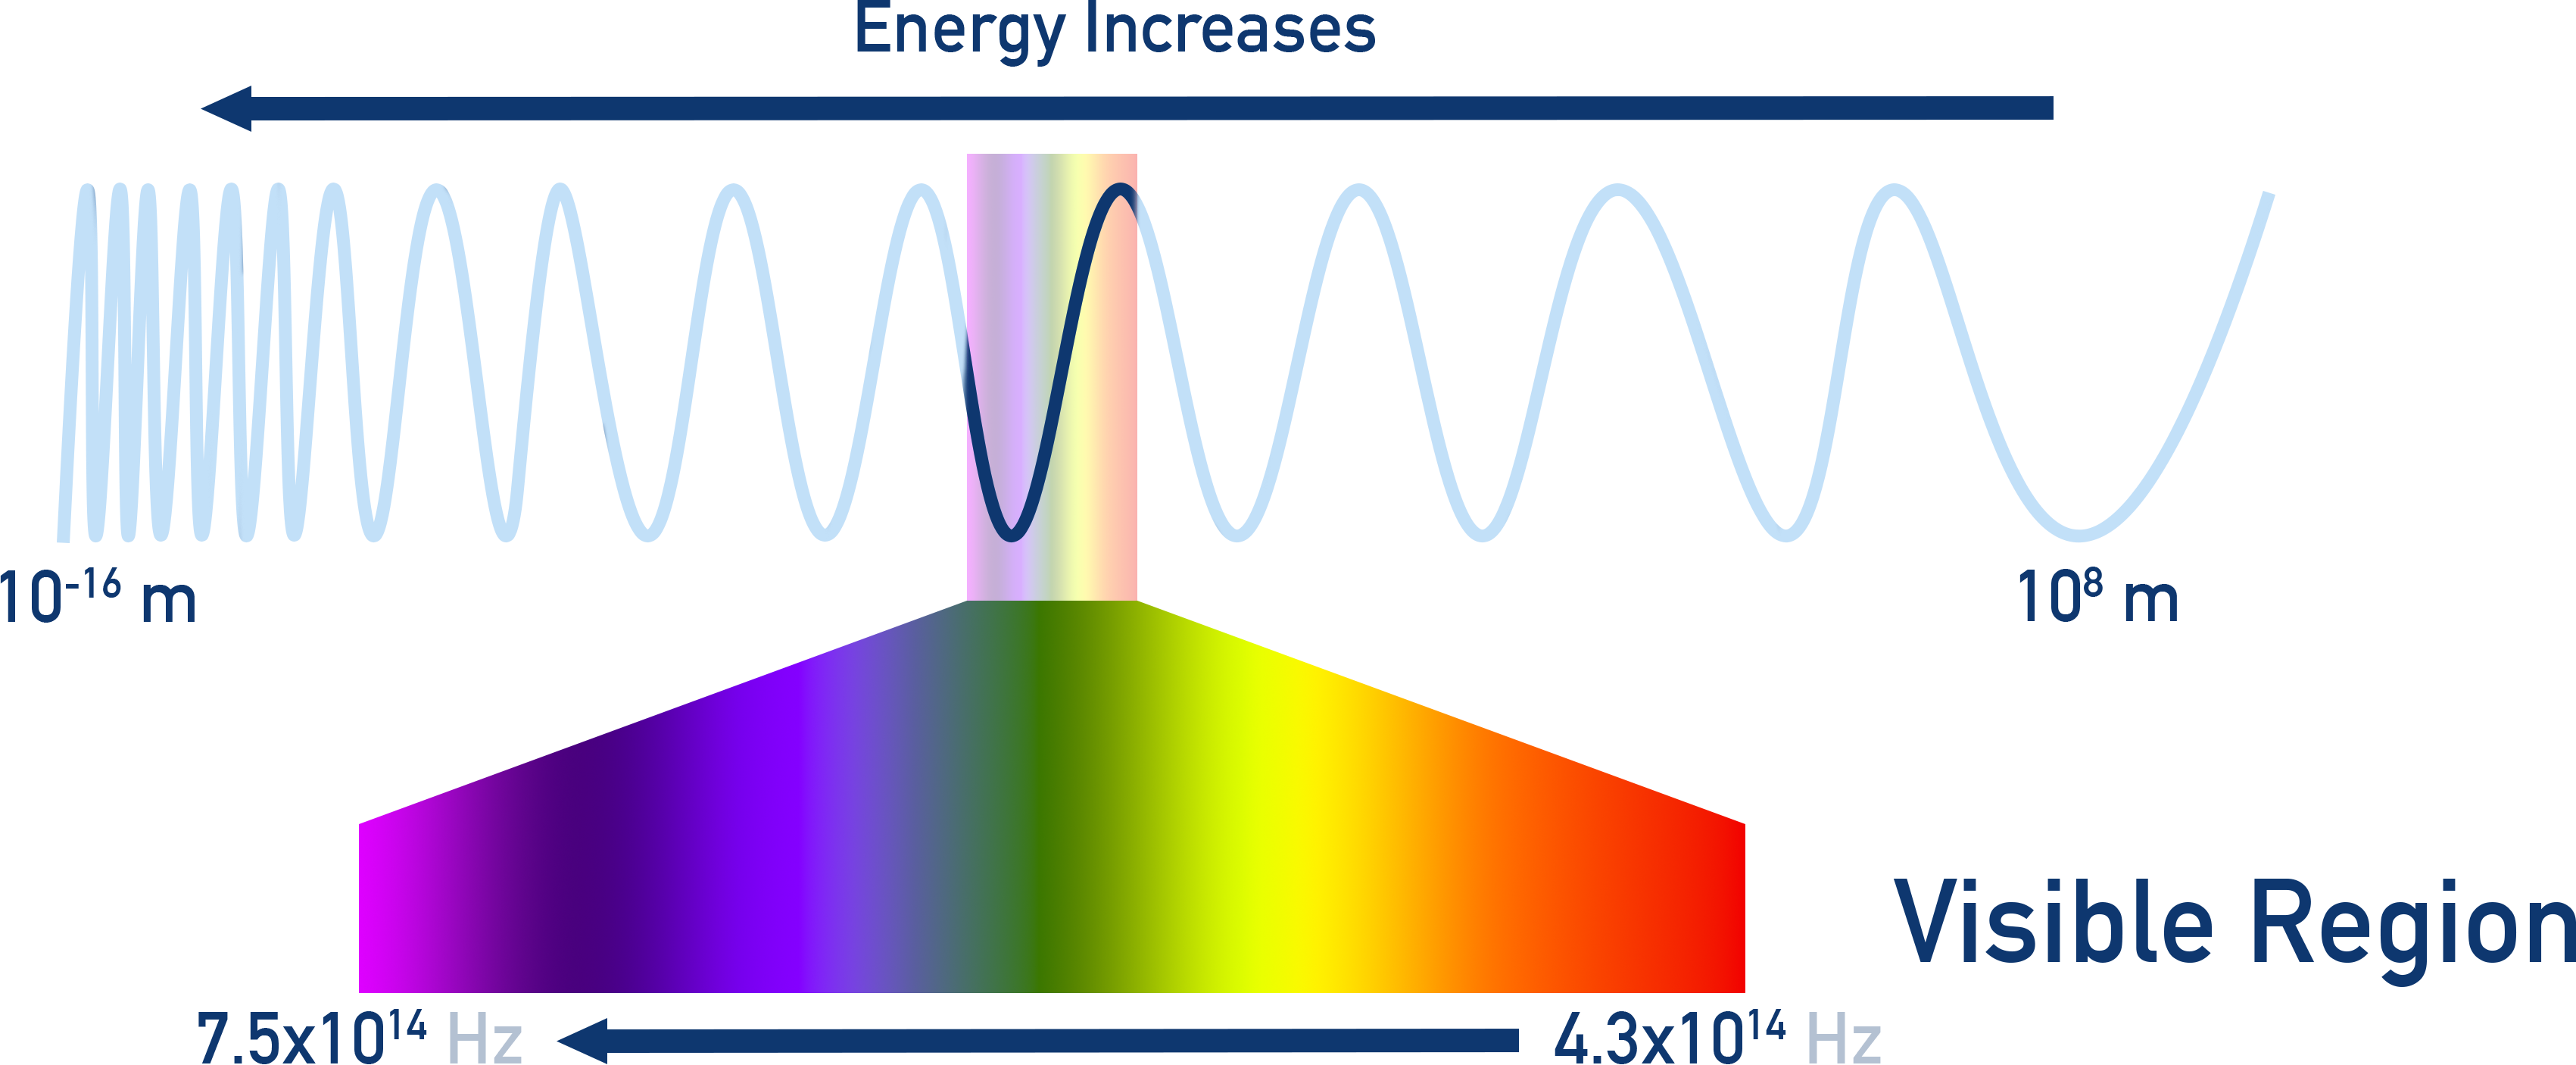
- Red: longest wavelength (~700 nm), lowest energy
- Violet: shortest wavelength (~400 nm), highest energy
So, in visible light:
- Red = low energy
- Violet = high energy
Summary
- Emission spectra are created when excited electrons fall to lower levels, releasing photons of specific energy.
- A line spectrum shows discrete wavelengths unique to each element.
- Energy, frequency, and wavelength are linked: higher frequency means shorter wavelength and higher energy.
- Visible light runs from red (low energy) to violet (high energy).