
pH Curves for Neutralization Reactions
Quick Notes
- A pH curve shows how pH changes during the titration of an acid with a base (or vice versa).
- Strong acid + strong base: steep rise in pH around equivalence point (pH ≈ 7).
- The equivalence point is when the acid and base have perfectly reacted together (there is only the salt and water present).
- The curve begins at the pH of the acid, rises slowly at first, then sharply increases at the equivalence point.
- After equivalence, the pH levels off near the base’s pH.
- Only monoprotic acid–base reactions are assessed.
Full Notes
A pH curve is a graph of pH versus volume of titrant added in a neutralization reaction during a titration.
It helps visualize how the pH changes as an acid and a base react.
General Shape of the Curve: Strong Acid + Strong Base
Example HCl titrated with NaOH
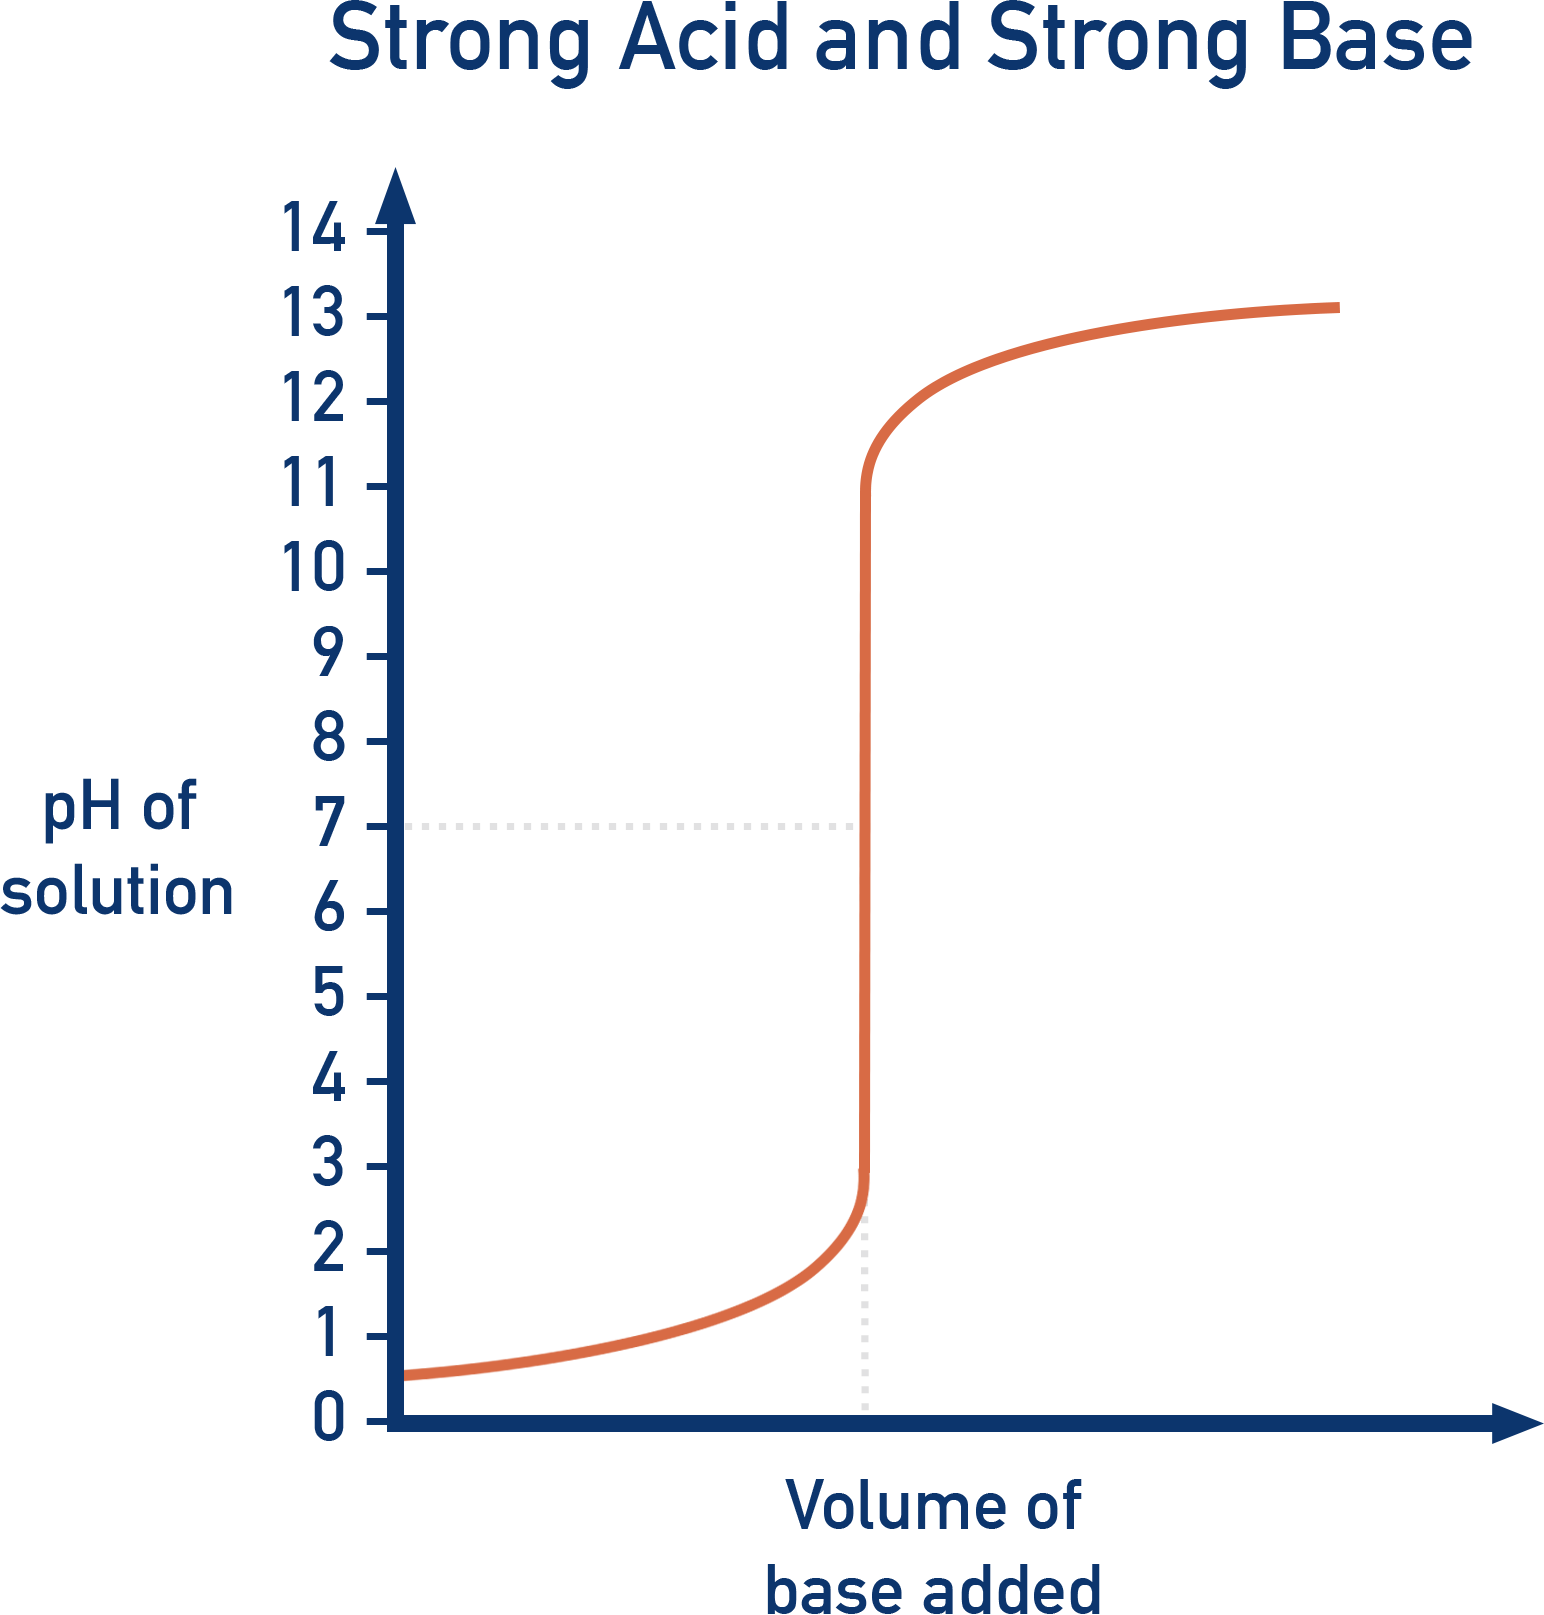
Key Features of a pH Curve
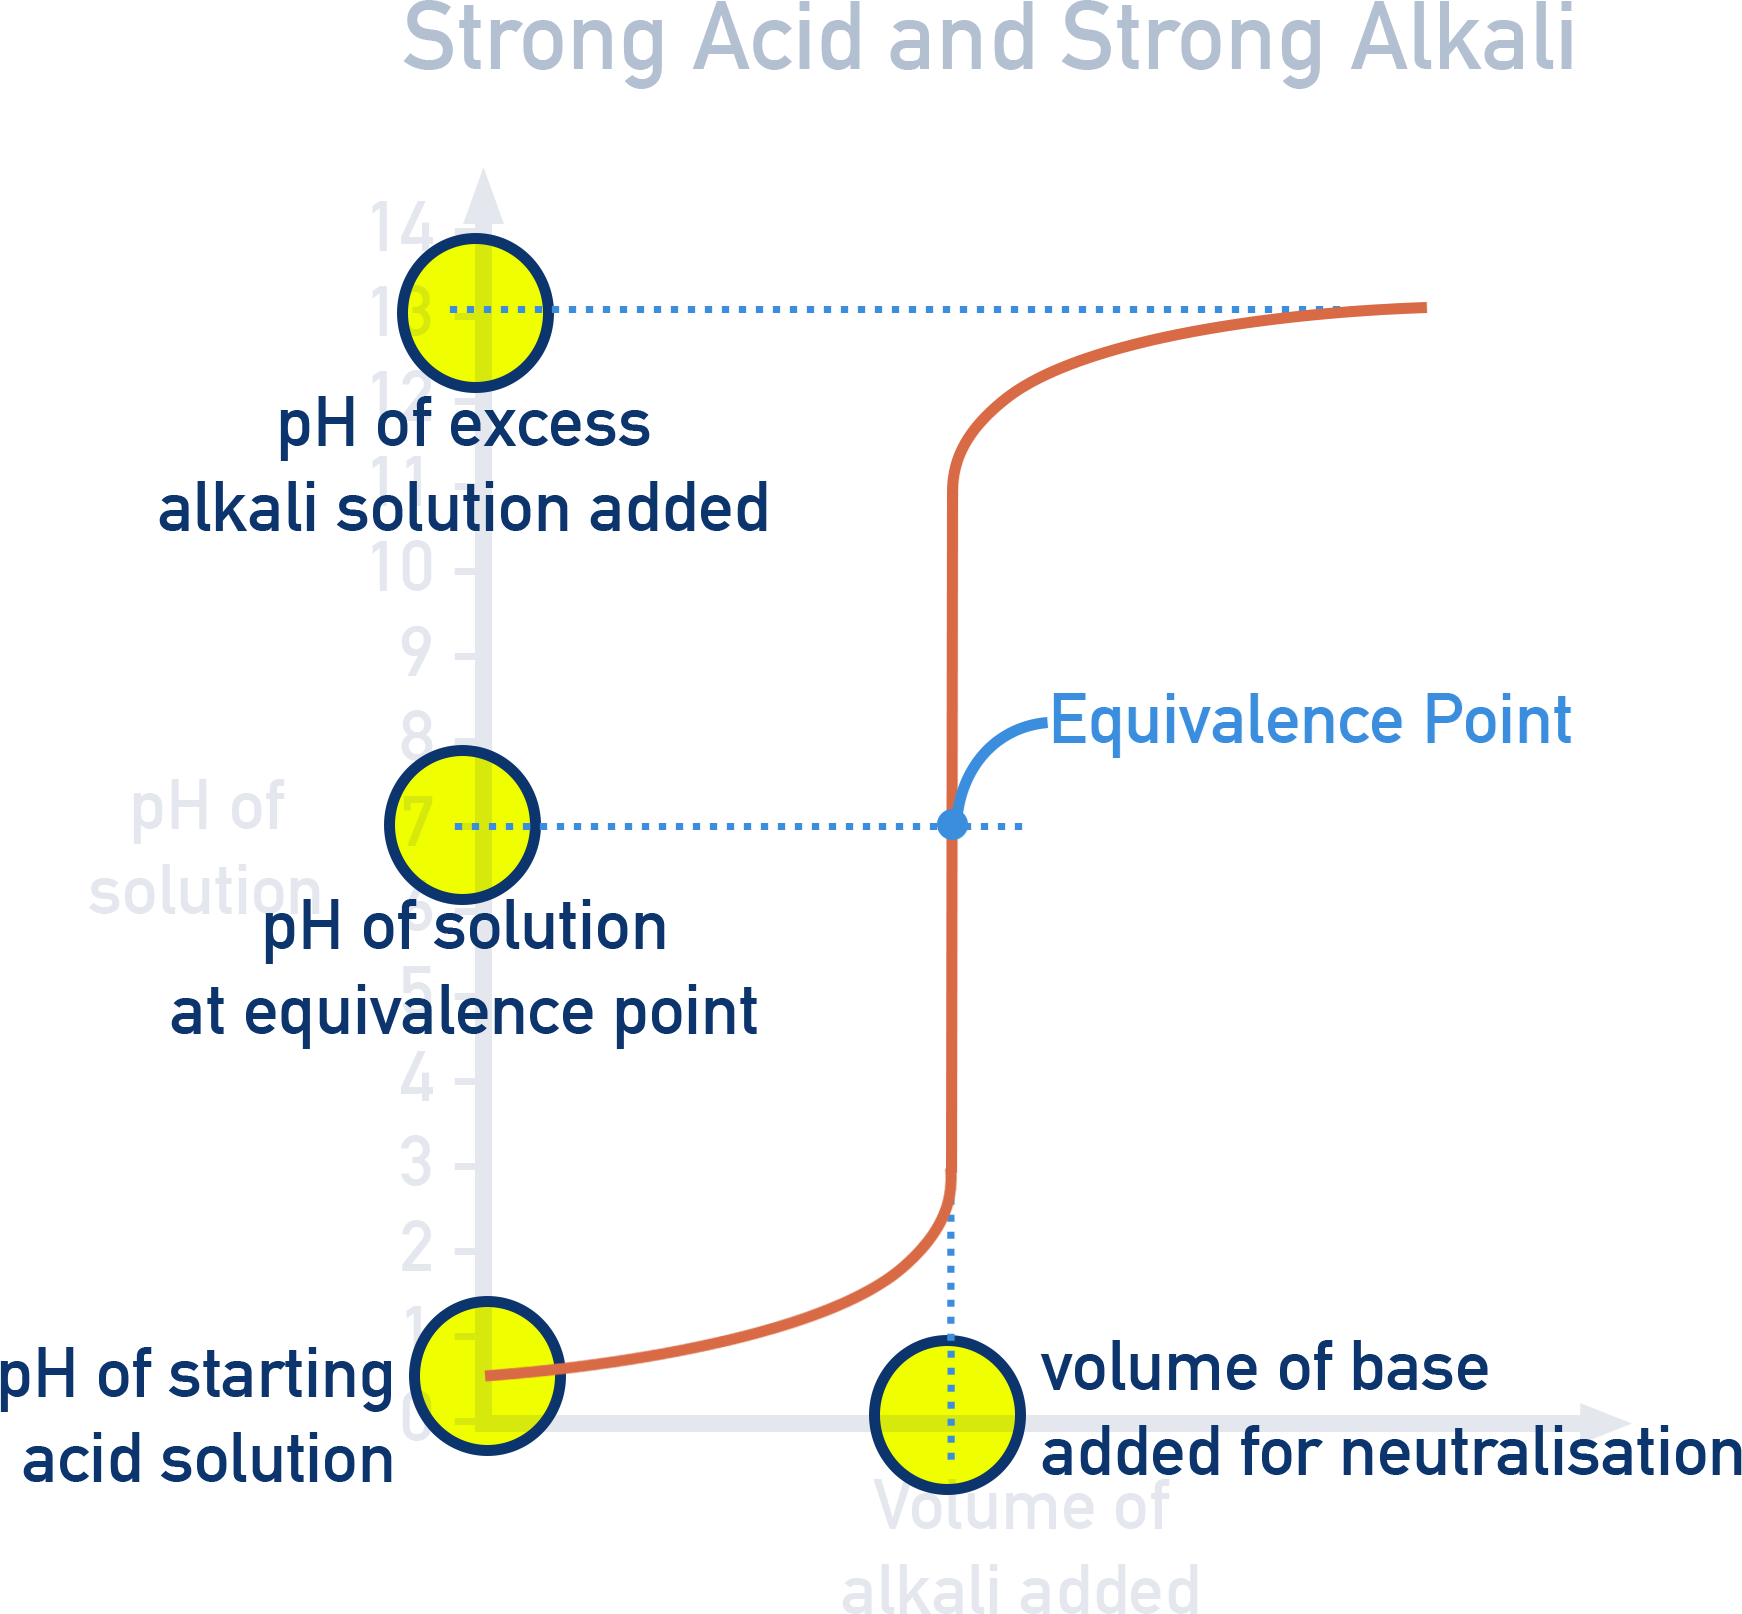
- Initial pH: shown by the intercept with y-axis.
- Steep region: indicates rapid change in pH near the equivalence point.
- Equivalence point: center of the steep region; where neutralization is complete.
- Final pH: reflects strength and excess of the base.
Summary
- pH curves show pH changes during neutralization.
- Strong acid and strong base curves have a steep change at equivalence.
- Equivalence point is when acid and base have reacted completely - there is only salt and water present.
- Stoichiometric point means exact reacting ratios are met.
- Titrations allow calculation of unknown concentrations.
Linked Course Questions
Why is the equivalence point sometimes referred to as the stoichiometric point?
The equivalence point is the moment in a titration when chemically equivalent amounts of acid and base have reacted — meaning the mole ratio matches the stoichiometric ratio in the balanced chemical equation. Because it reflects the exact proportions required by stoichiometry, it is also called the stoichiometric point. No excess reactant remains, and the neutralization is complete at this stage.
How can titration be used to calculate the concentration of an acid or base in solution?
Titration allows you to determine the unknown concentration of an acid or base by reacting it with a base or acid of known concentration.
- A measured volume of one solution (the analyte) is placed in a flask.
- The other solution (the titrant) is added from a burette until the equivalence point is reached — often shown by a colour change from an indicator.
- Using the balanced equation, you apply the mole ratio to calculate the number of moles of the unknown.
- Then, use the formula: concentration = moles / volume.