Factors Affecting Reaction Rate
Quick Notes
- The rate of a reaction is determined by the frequency of successful collisions between reactant particles (collision theory).
- Factors that influence rate include:
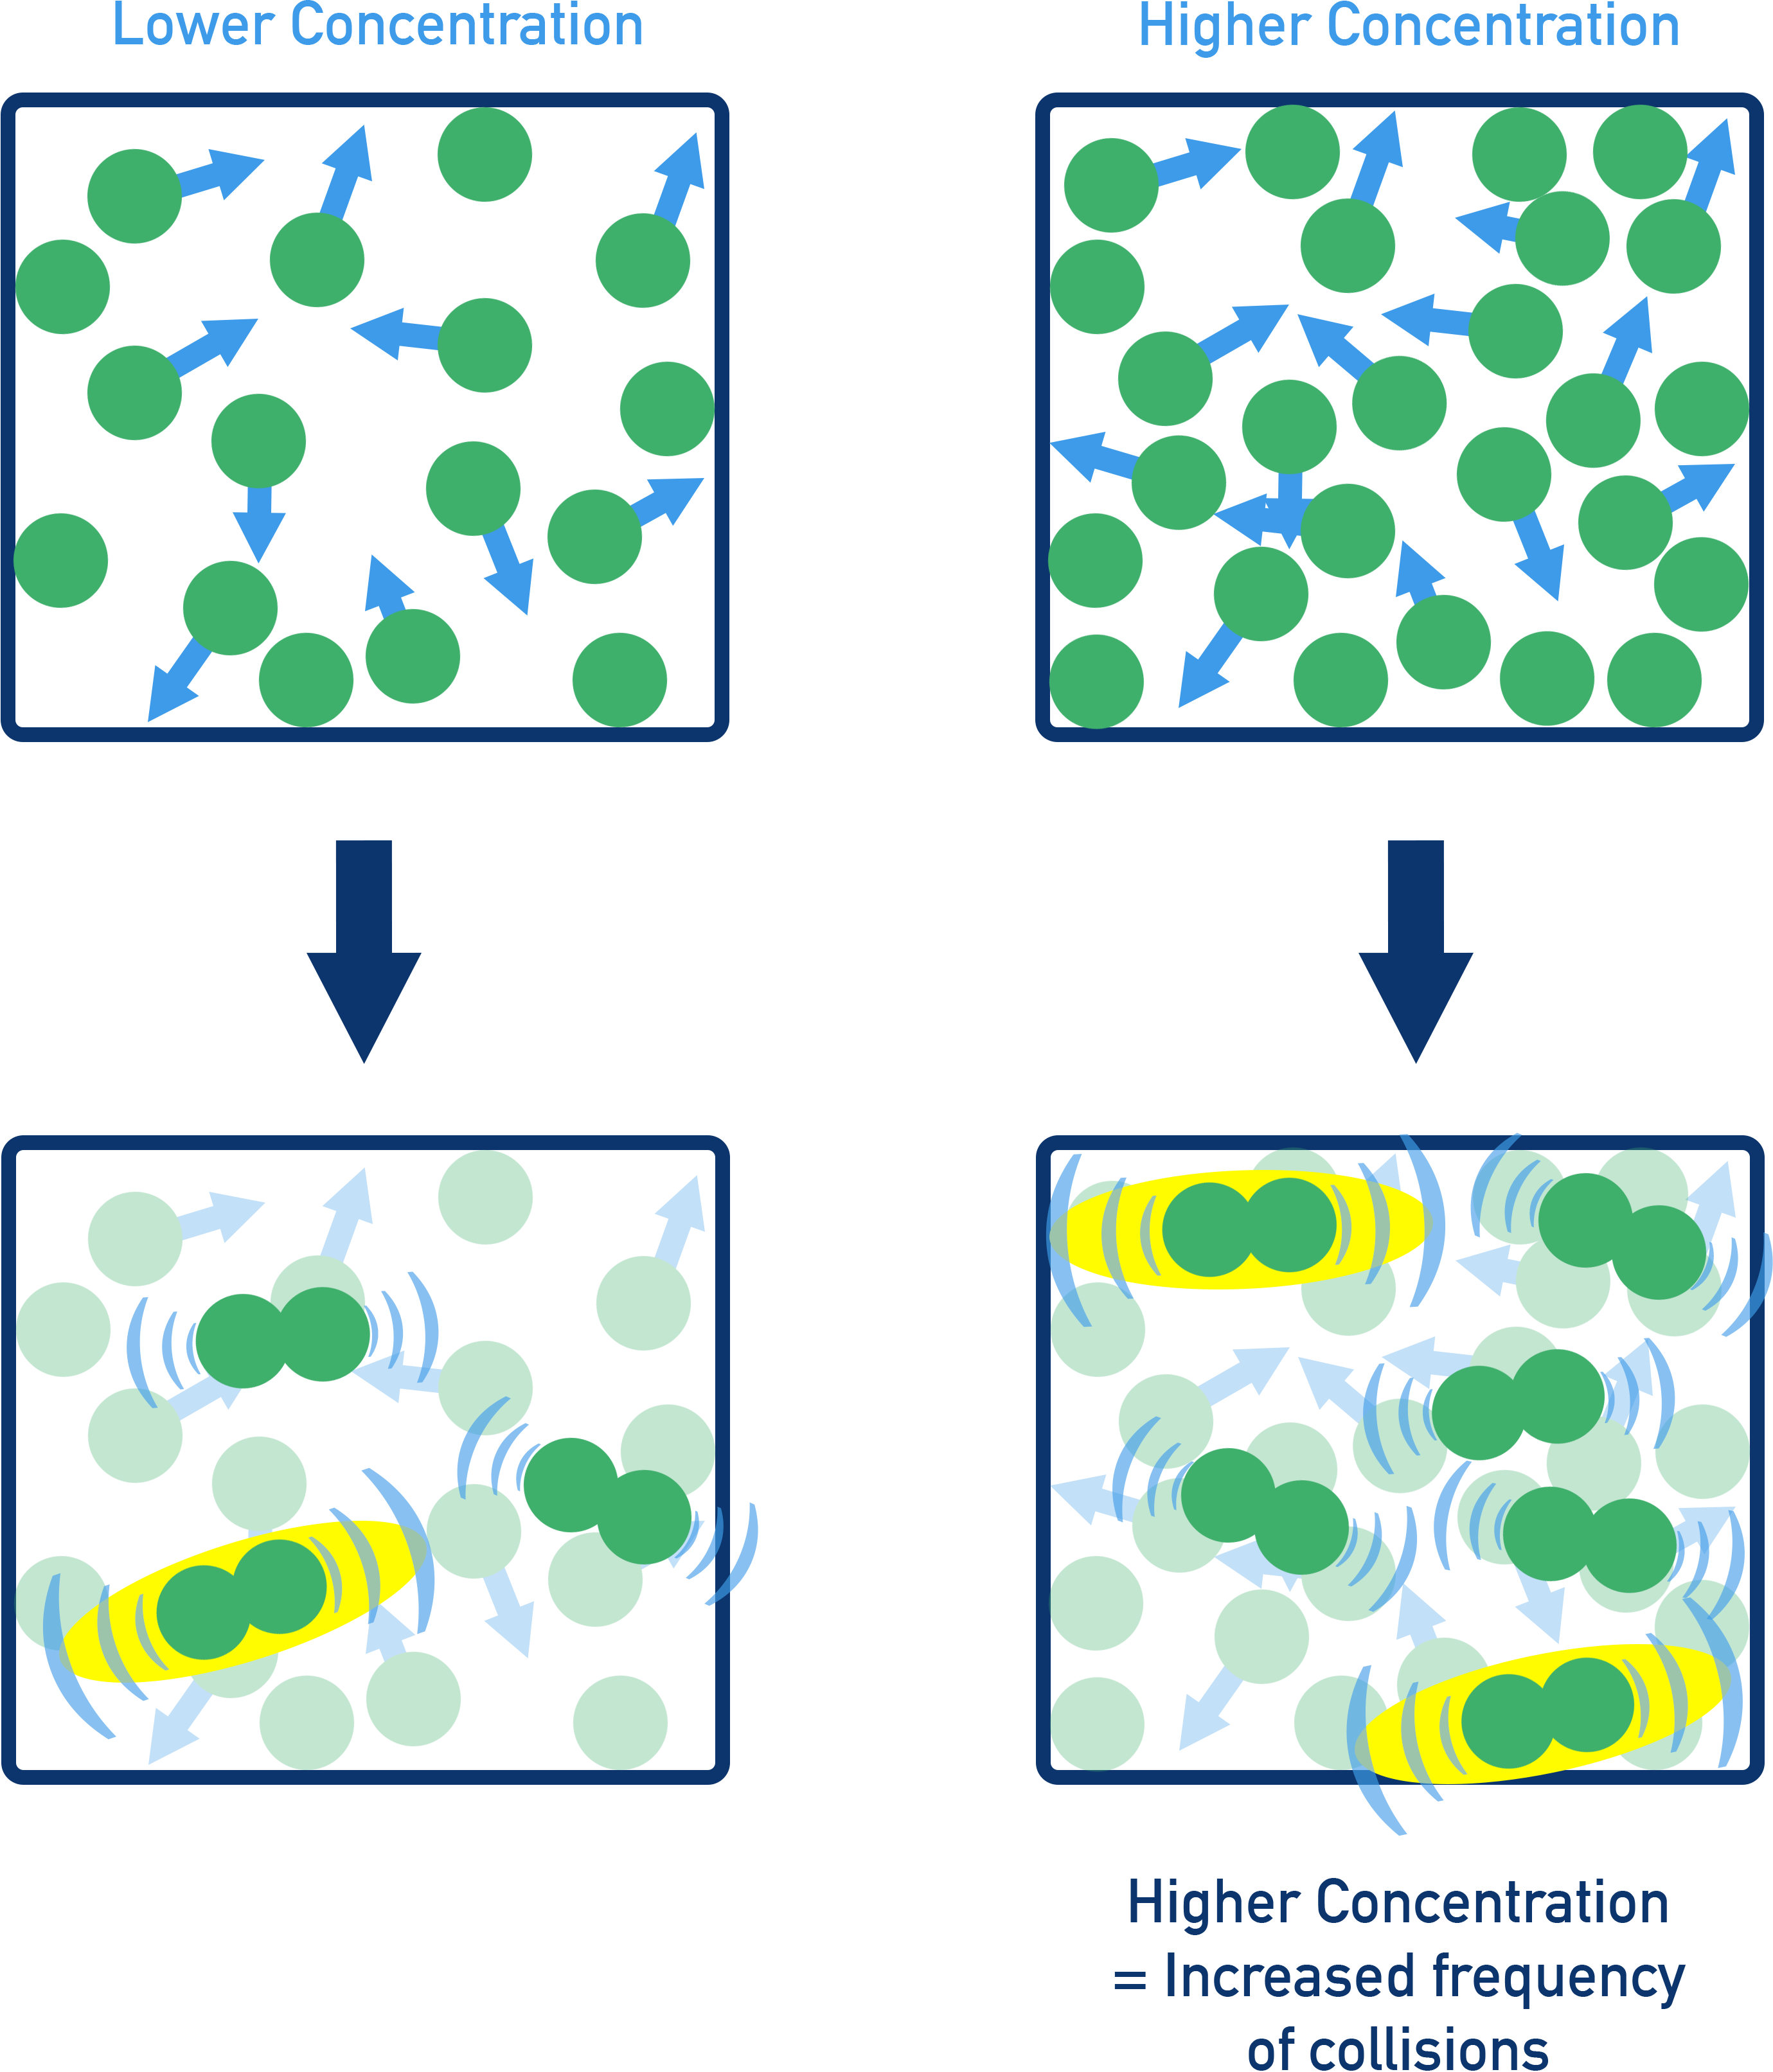
- Concentration: Higher concentration = more frequent collisions = faster reaction.
- Pressure (gases): Higher pressure = particles closer together = more collisions.
- Surface area: Greater surface area (e.g. powders) = more contact points for collisions = faster reaction.
- Temperature: Increased temperature = increased kinetic energy = more frequent and more energetic collisions.
- Catalyst: Lowers activation energy = increases number of successful collisions.
Full Notes
Reaction rate depends on how often particles collide with enough energy.
Increasing temperature, concentration, surface area, or adding a catalyst increases the number of successful collisions per second, speeding up the reaction.
Effect of Concentration and Pressure
Concentration effect on rate
Increased concentration means more particles in a given volume, resulting in more frequent collisions, giving a faster reaction.
Note that the proportion of total collisions that are successful remain the same – it is just that a greater number of collisions overall means also a greater number of successful collisions.
Pressure effect on rate
Increased pressure (in gases) means particles are pushed closer together, resulting in an increased frequency of collisions, giving a faster reaction.
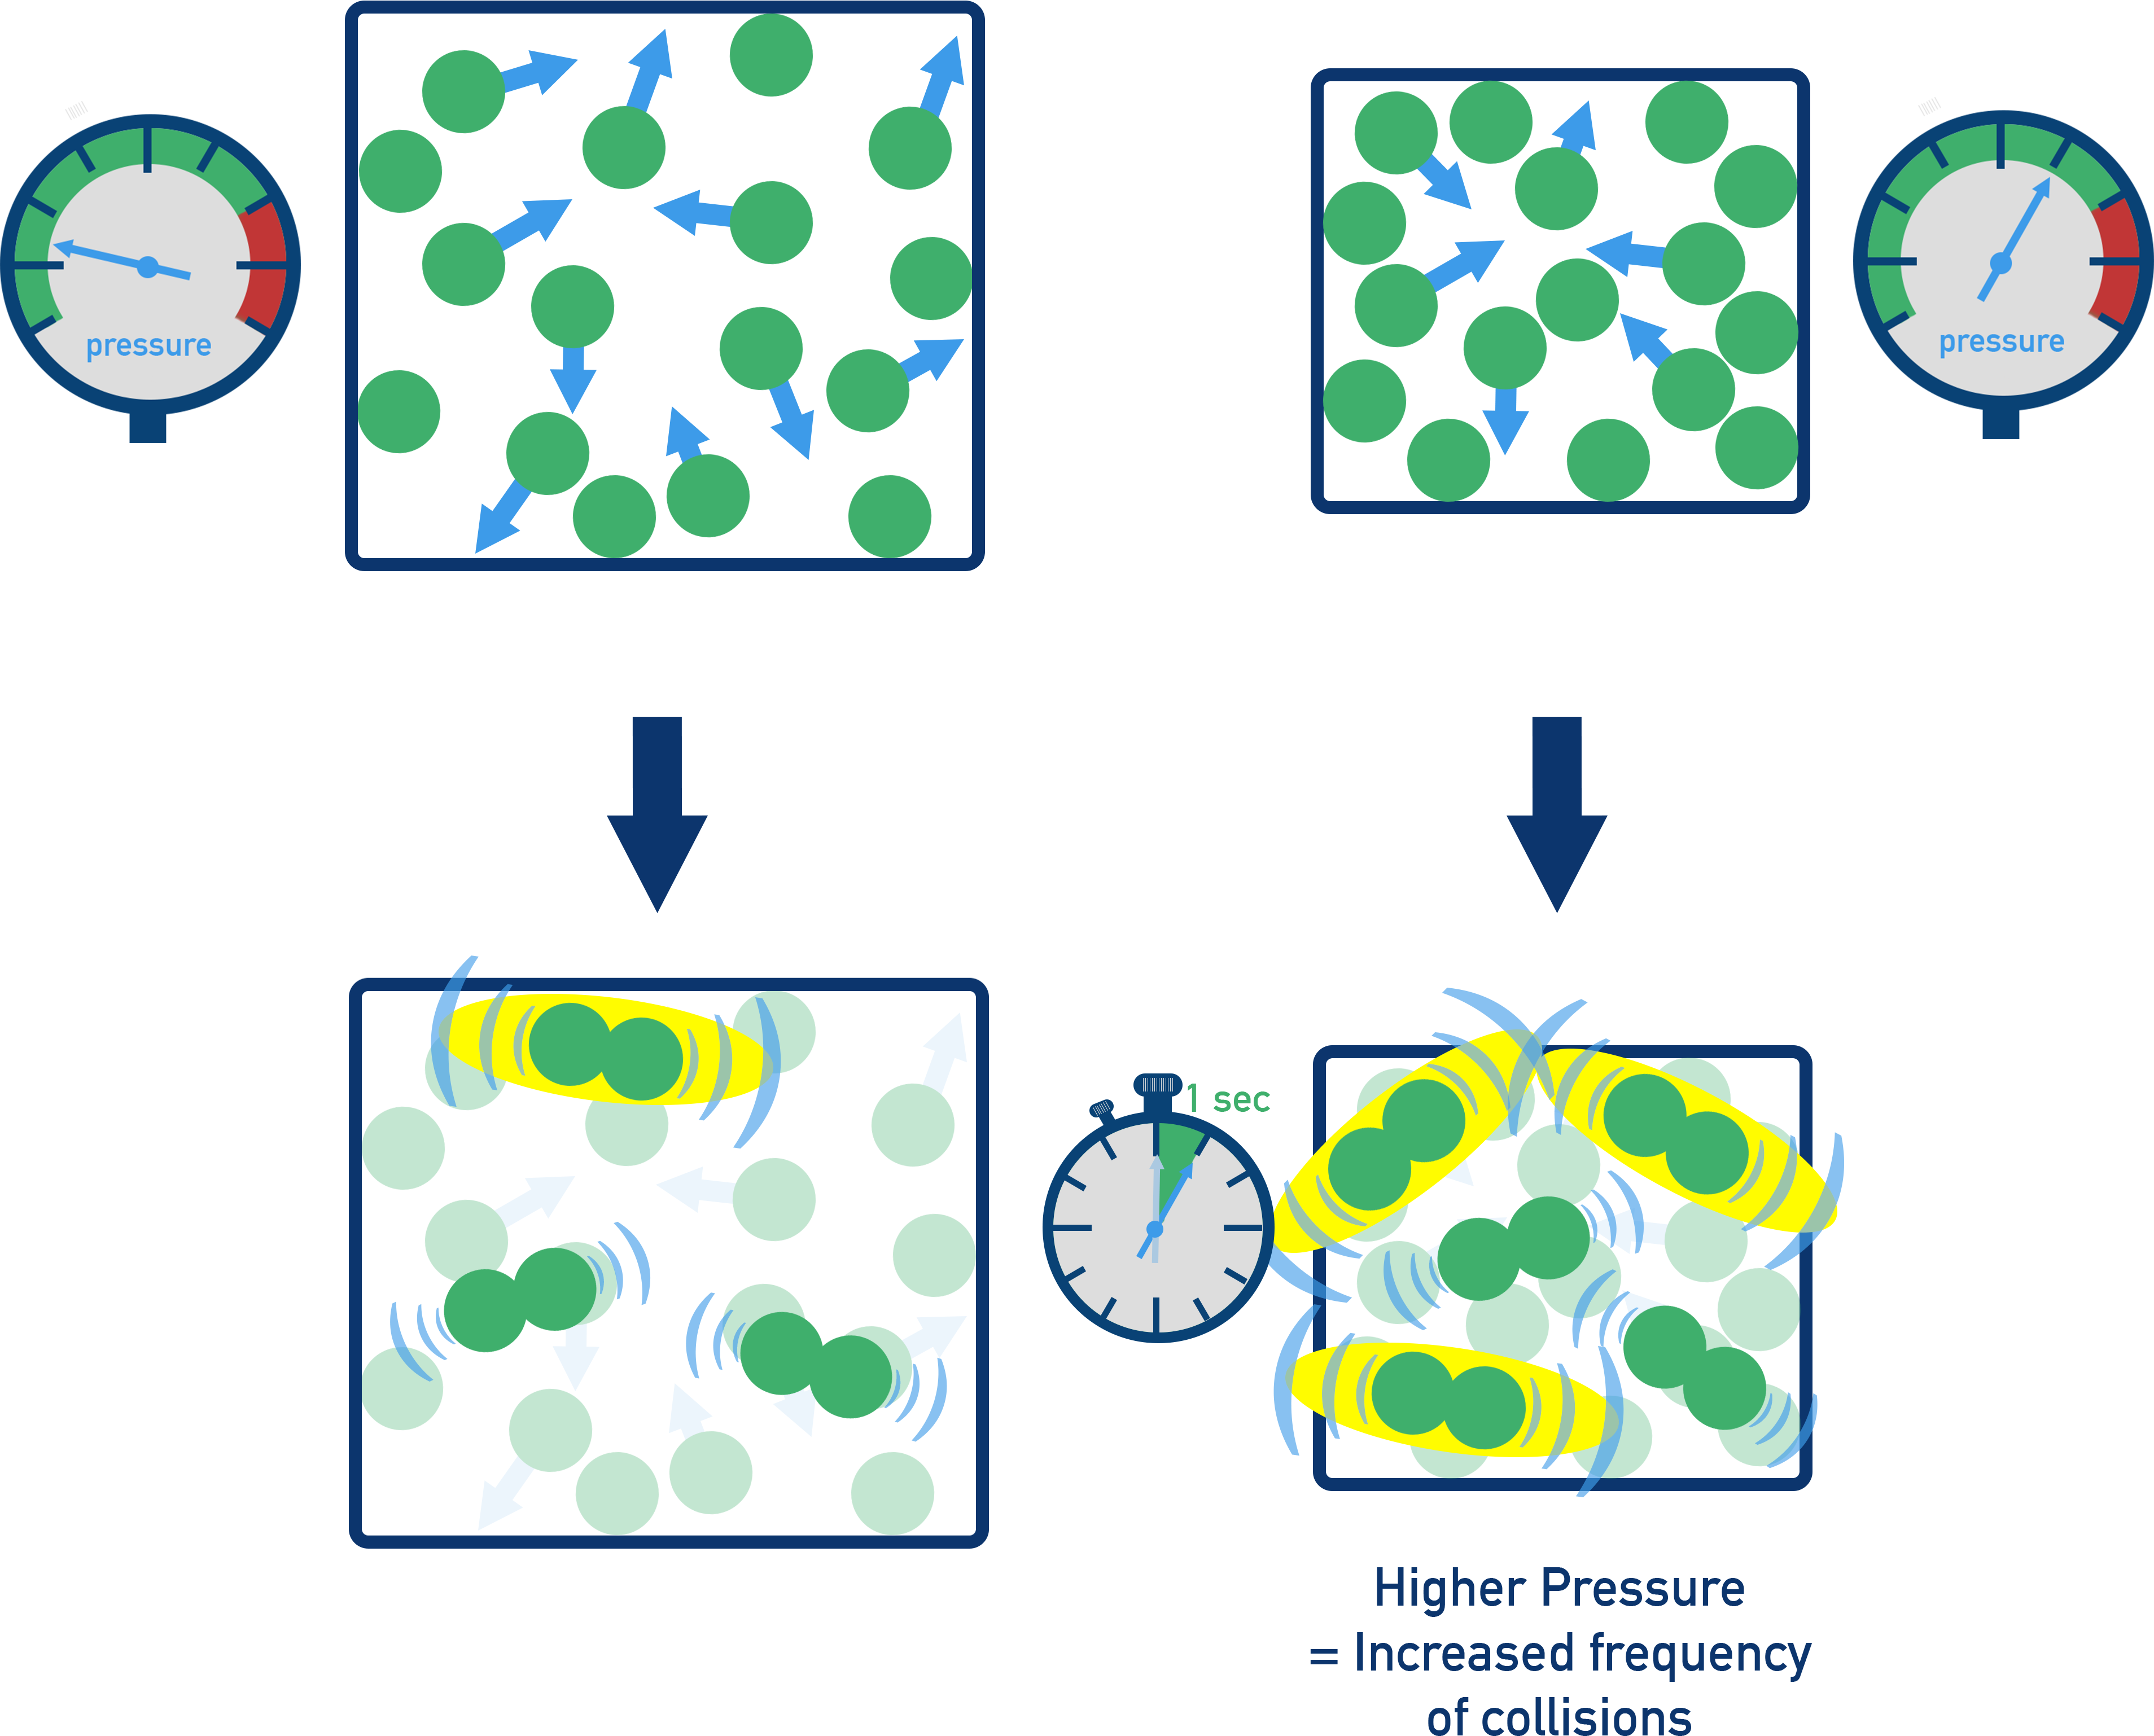
This is all about increasing collision frequency. However, only successful collisions (with sufficient energy and correct orientation) cause reactions.
Effect of Surface Area (Solids)
Breaking a solid into smaller pieces or using a powder increases surface area.
More surface area allows more reactant particles to collide with the solid at the same time, increasing the reaction rate.
Effect of Temperature
Raising temperature increases the kinetic energy of particles. As a result, particles move faster meaning more frequent collisions occuring at a higher energy.
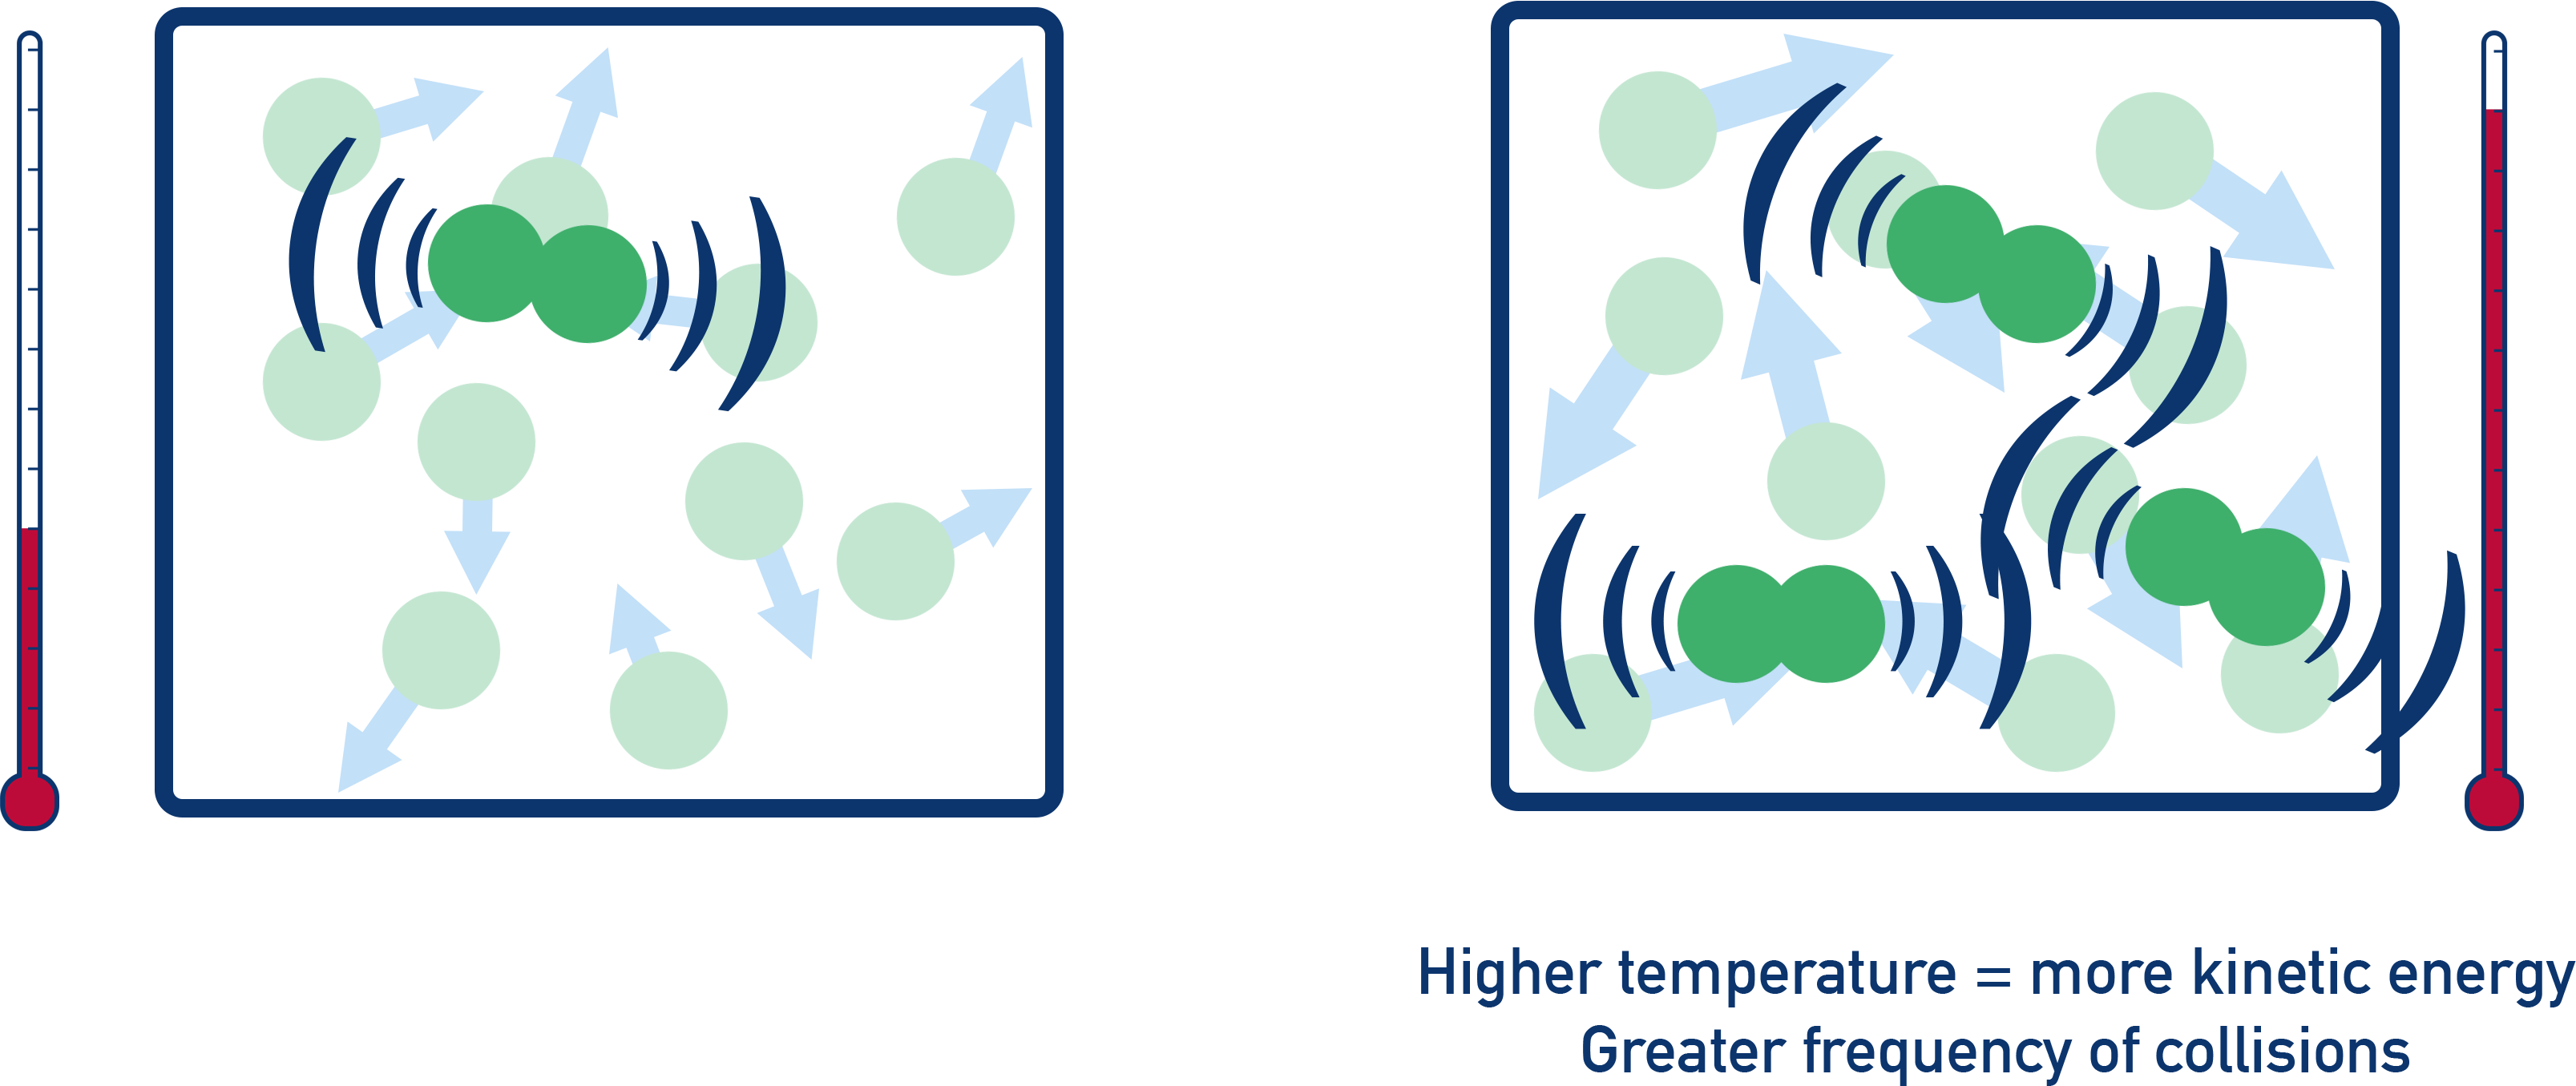
As more energy is involved in collisions, the fraction of particles with the required activation energy increases.
This greatly increases reaction rate and small increases in temperature can lead to a large increase in rate (see Arrhenius Equation for more detail).
Catalyst
A catalyst provides an alternative reaction pathway with a lower activation energy. This means more particles have enough energy to react, increasing frequency of successful collisions.
Summary Table
| Factor | Effect on Rate | Explanation |
|---|---|---|
| Increased Concentration | Increases | More particles in same volume → more frequent collisions |
| Increased Pressure (gases) | Increases | Particles closer together → more frequent collisions |
| Increased Surface Area | Increases | More contact points → more collisions per second |
| Increased Temperature | Increases | Particles move faster and more have ≥ Ea → more successful collisions |
| Use of a Catalyst | Increases | Lowers activation energy → more collisions successful |
Summary
- Reaction rate depends on frequency of successful collisions.
- Concentration and pressure increase collision frequency.
- Surface area increases available collision sites.
- Temperature increases energy and frequency of collisions.
- Catalysts lower activation energy and increase success rate of collisions.
Linked Course Questions
What variables must be controlled in studying the effect of a factor on the rate of a reaction?
When investigating how one factor (like temperature or concentration) affects reaction rate, all other variables must be kept constant to ensure valid results. These typically include:
- Concentration of other reactants
- Temperature
- Surface area (if solids are involved)
- Catalyst presence and amount
- Volume and pressure (for gases)
- Stirring or mixing
Controlling these ensures that only the chosen factor is influencing the rate.
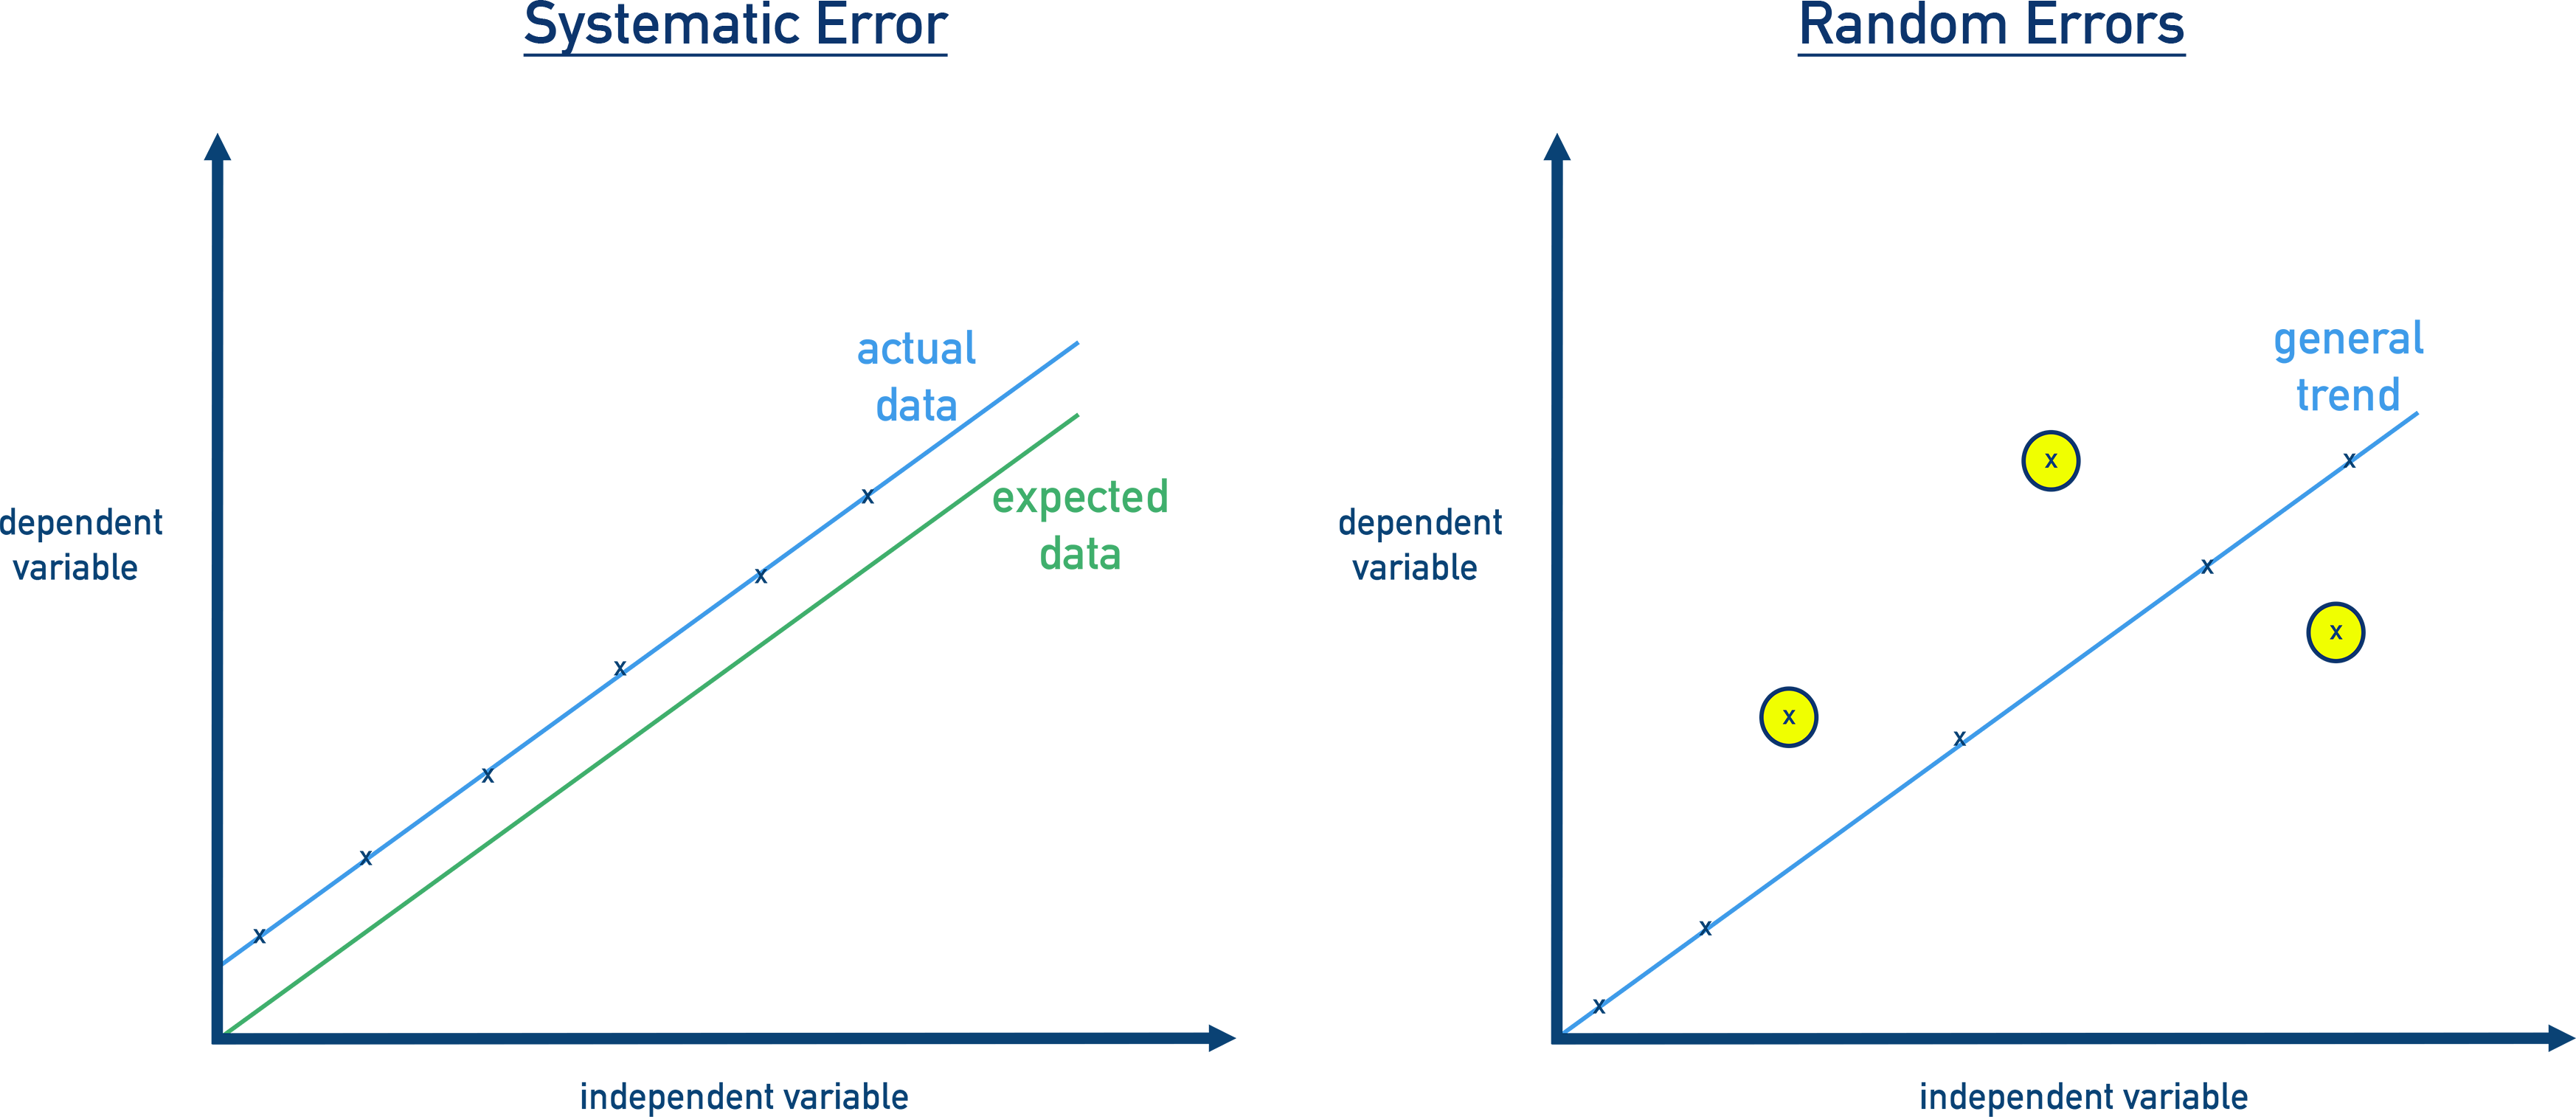
How can graphs provide evidence of systematic and random error?
Graphs can reveal systematic errors when all data points consistently deviate from the expected trend (e.g. always above or below a line of best fit), suggesting a consistent bias in measurement. Random errors are shown by scattered data points that vary unpredictably around the trend line, indicating variability in measurement or uncontrolled conditions. Clear patterns or inconsistent spread in the data help distinguish between the two.