
Ionization Energy and Spectral Interpretation HL Only
Quick Notes
- First ionization energy (IE) is the energy needed to remove one mole of electrons from one mole of gaseous atoms.
- In an emission spectrum, the limit of convergence at high frequency corresponds to first ionization energy.
- Trends in first IE:
- Across a period: IE increases (greater nuclear charge, smaller radius).
- Down a group: IE decreases (larger radius, more shielding).
- Discontinuities arise from:
- New sublevels (s → p)
- Electron pairing (repulsion)
- You can calculate IE from spectral data using:
- E = h × f
- c = λ × f.
Full Notes:
Ionization and the Emission Spectrum
When an atom’s electron gains enough energy to escape completely, the atom becomes ionized.
In a hydrogen emission spectrum, this is seen at the limit of convergence – the point where lines merge into a continuum.
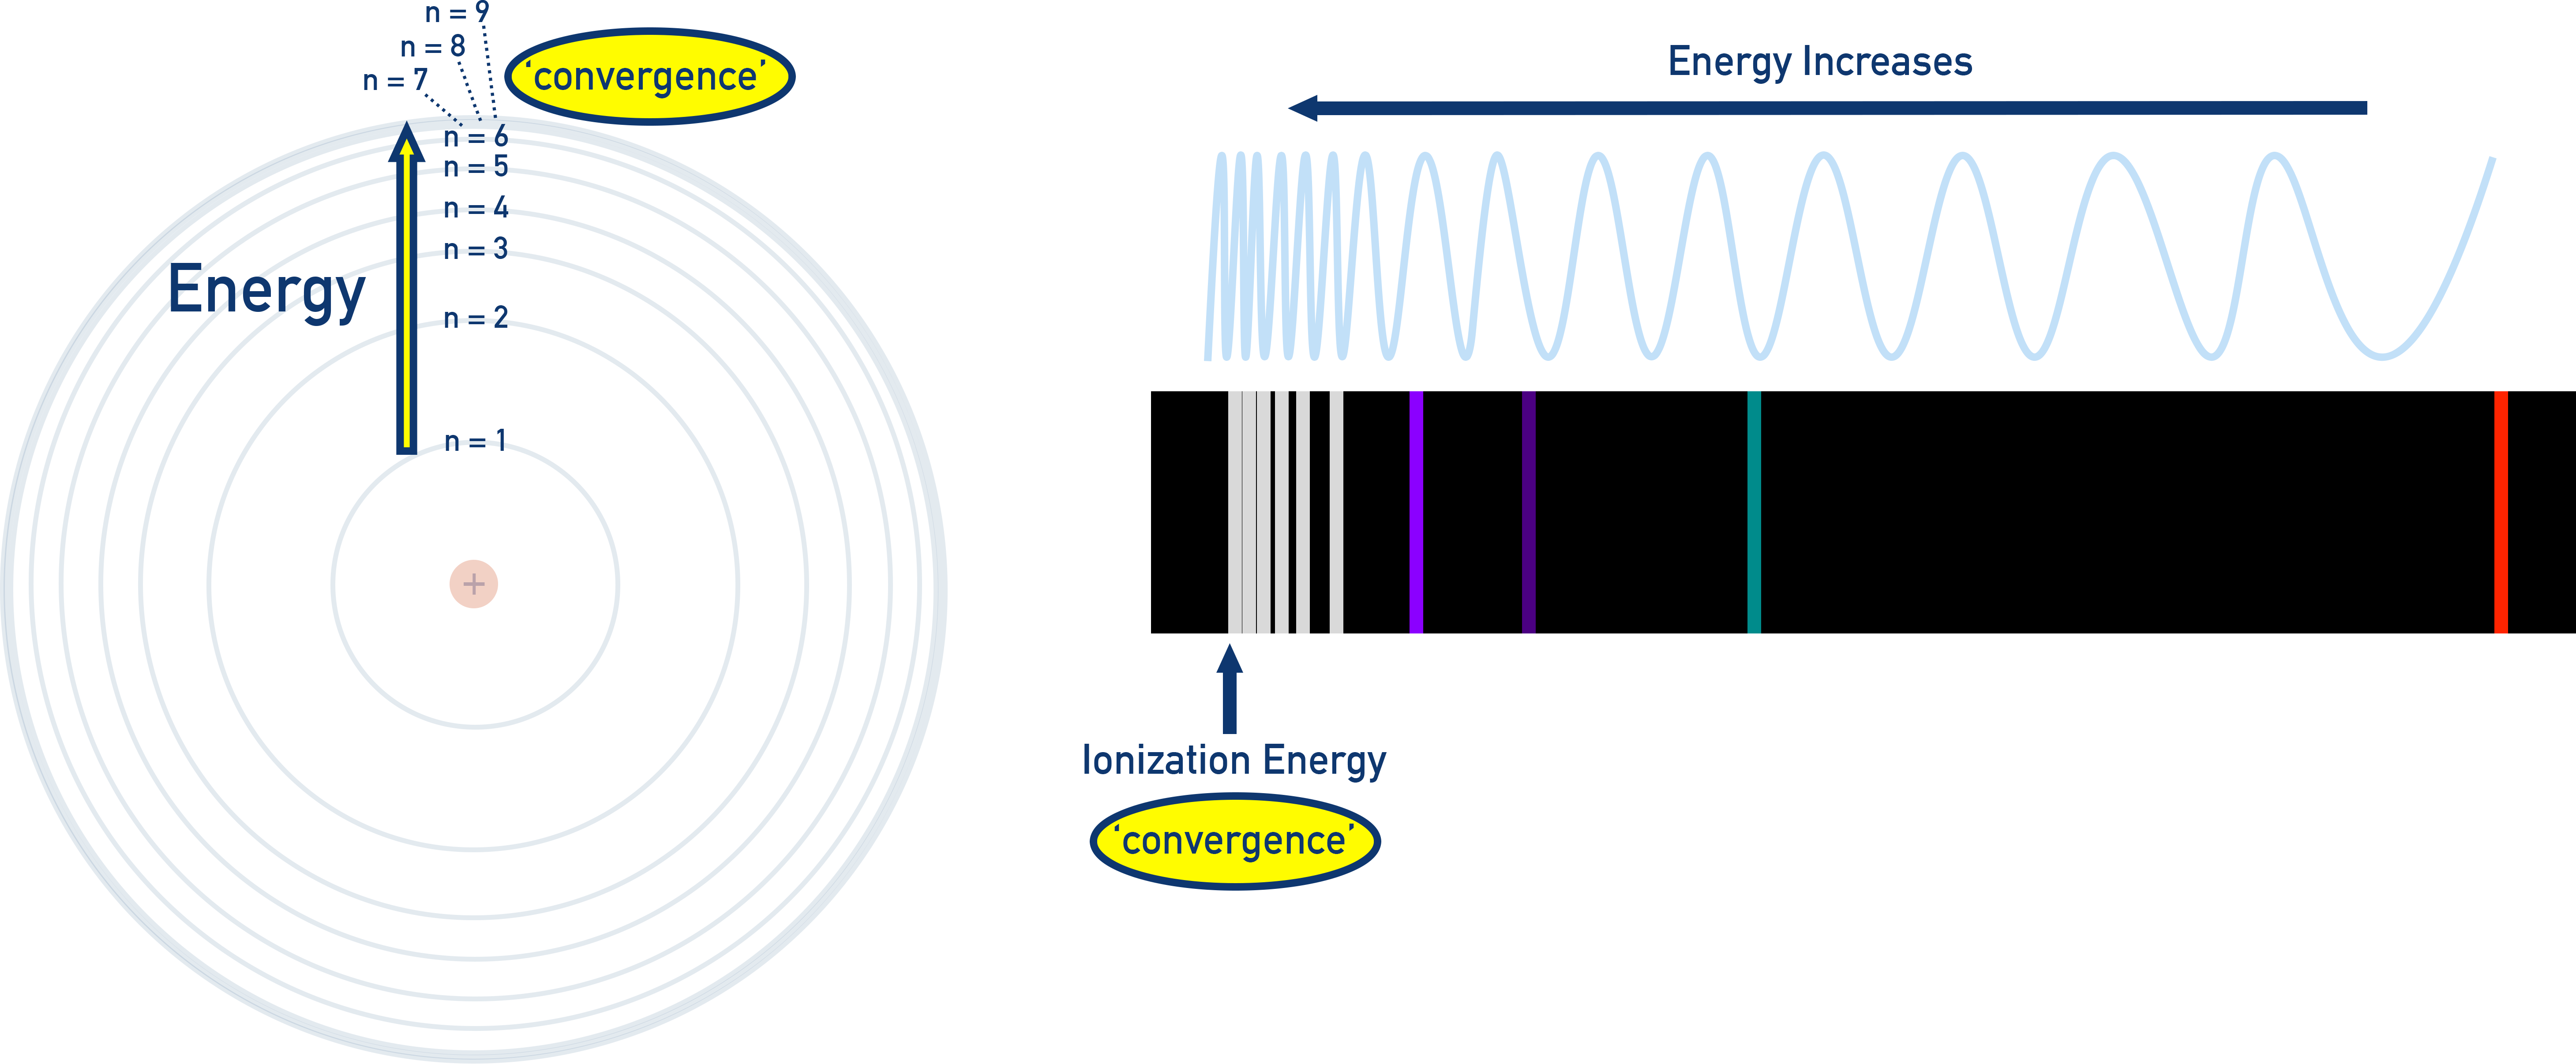
- This high-frequency end of the spectrum represents the energy required to remove an electron from the ground state – the first ionization energy.
- The closer the lines are, the higher the energy level the electron is falling from.
First Ionization Energy (IE)
First Ionisation Energy (I.E1) is the energy required to remove one mole of electrons from one mole of gaseous atoms.
ExampleNa(g) → Na⁺(g) + e⁻
Ionisation Energies are measured in kJ mol⁻¹ and depend on:
- Nuclear charge
- Atomic radius
- Electron shielding
Trends in First Ionization Energy
Across a Period:(1st) Ionisation Energy increases.
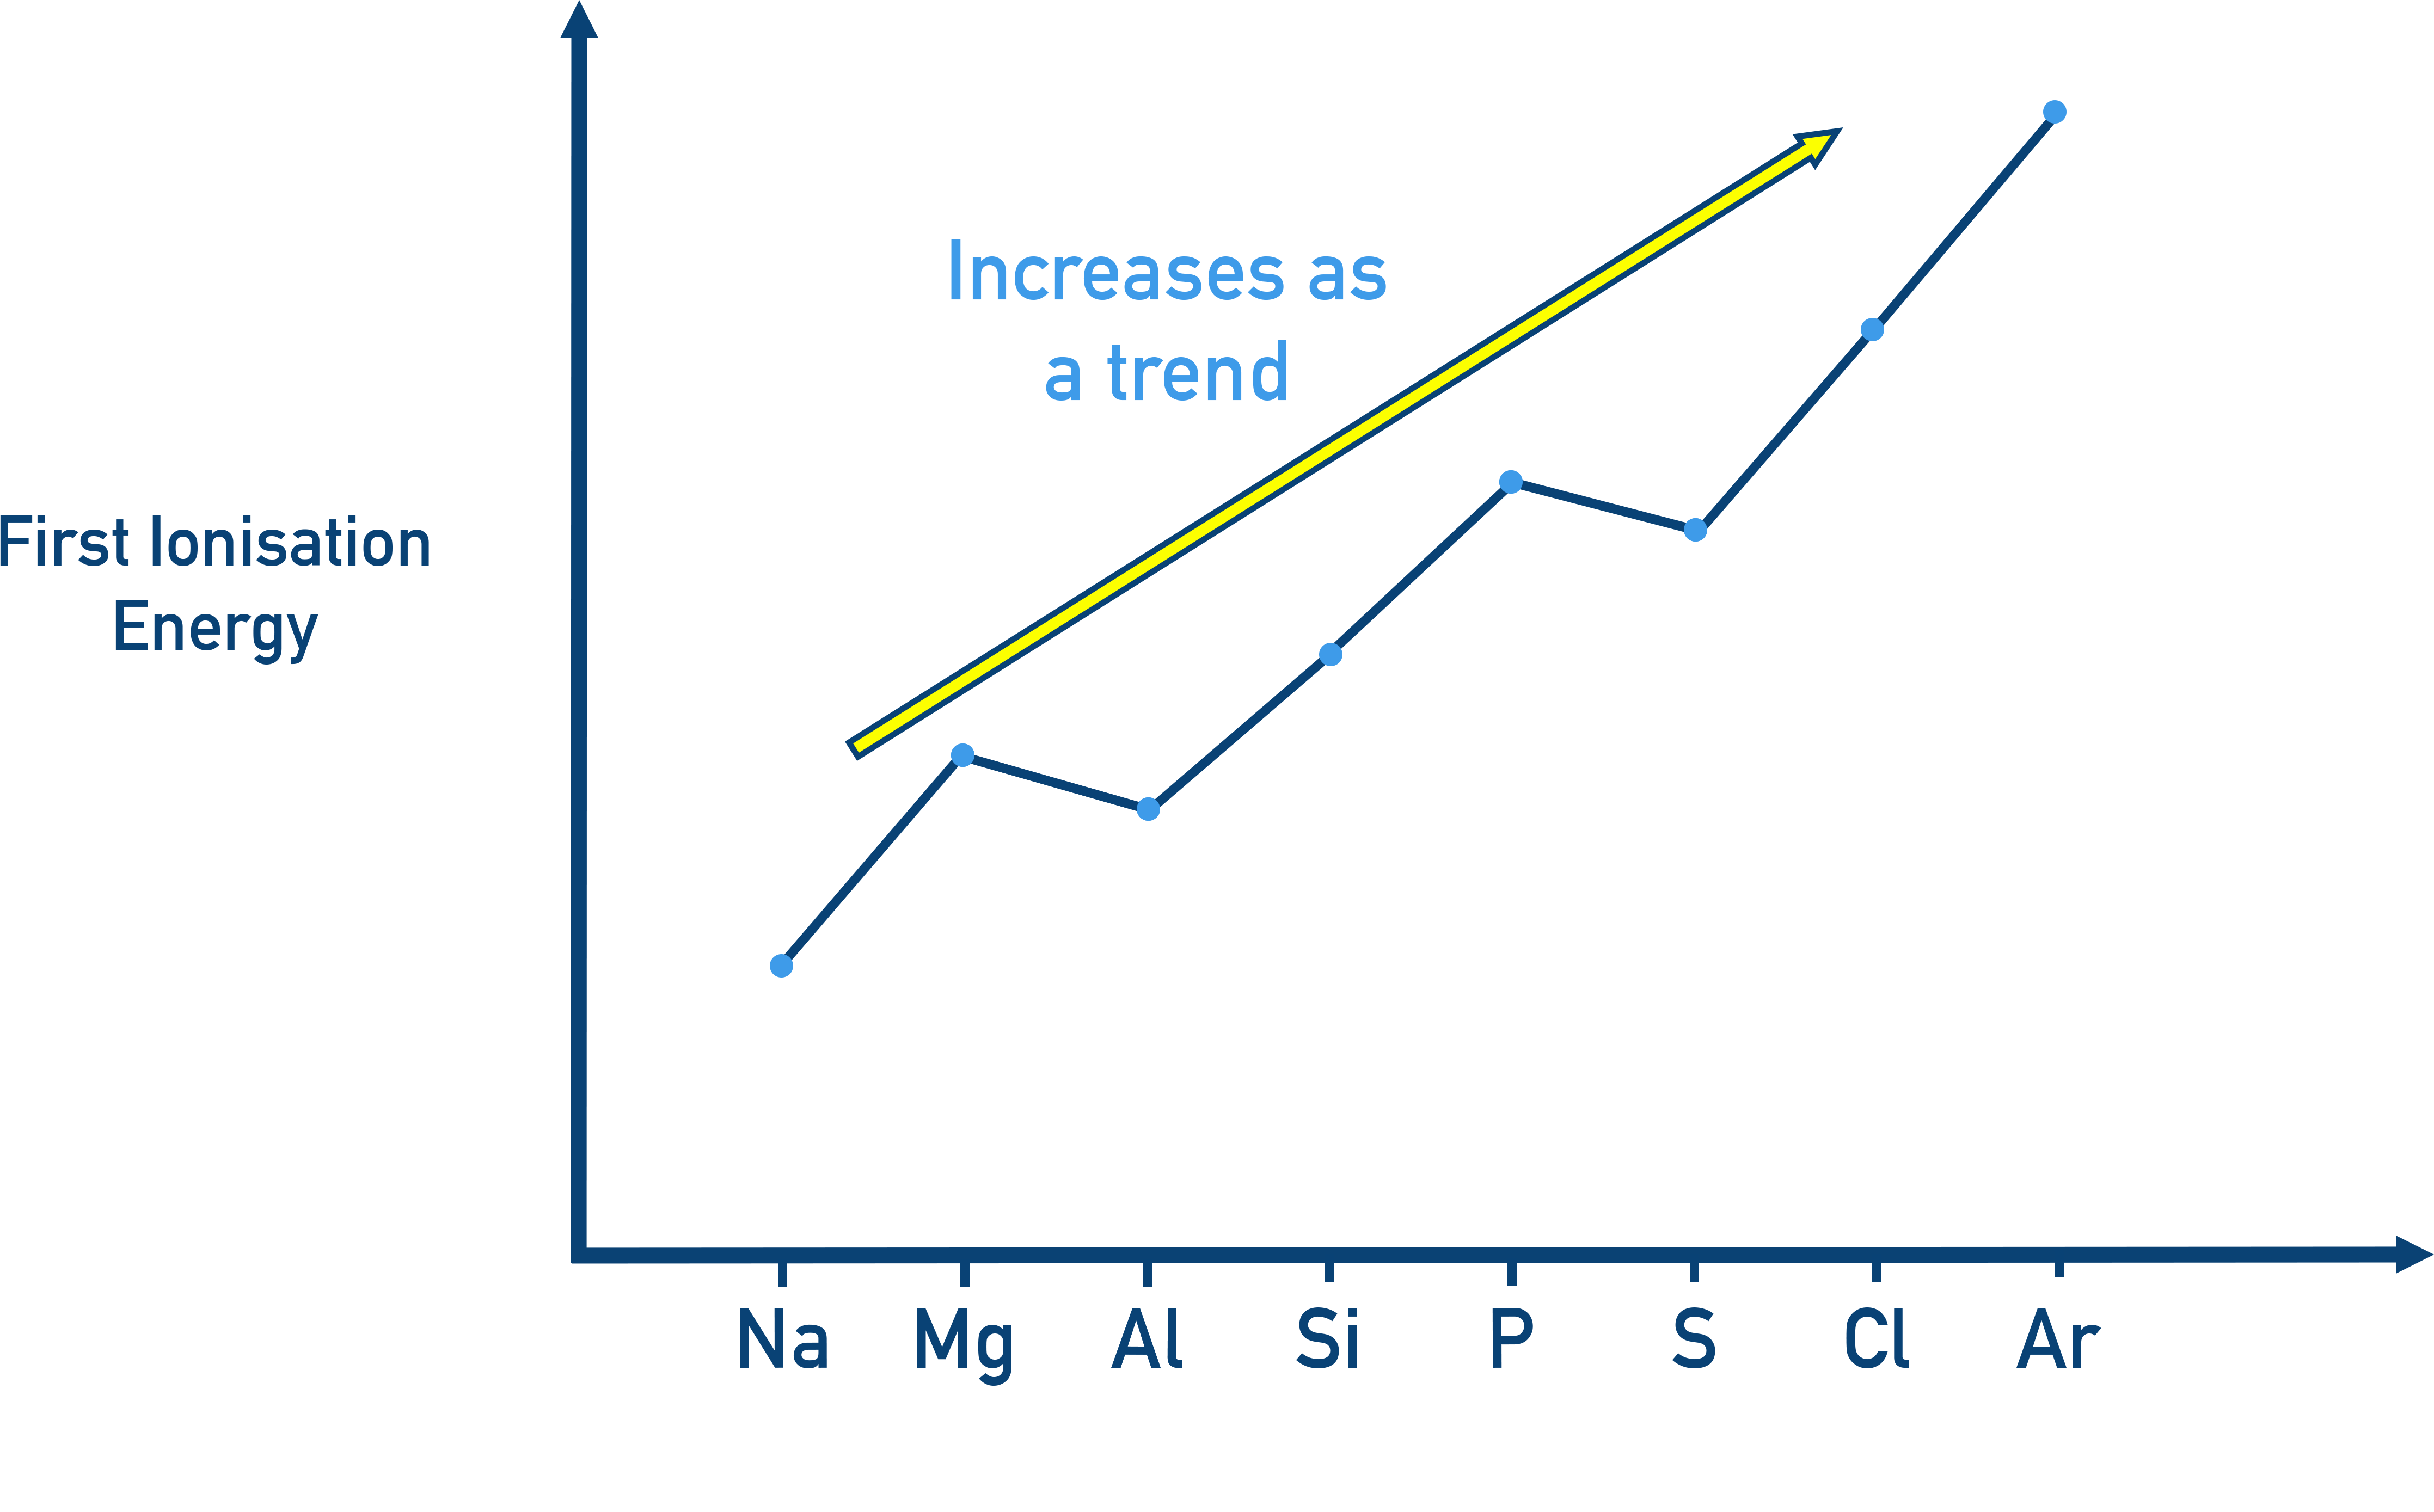
- Greater nuclear charge pulls electrons closer.
- Atomic radius decreases.
- Shielding remains similar.
Down a Group:(1st) Ionisation Energy decreases.
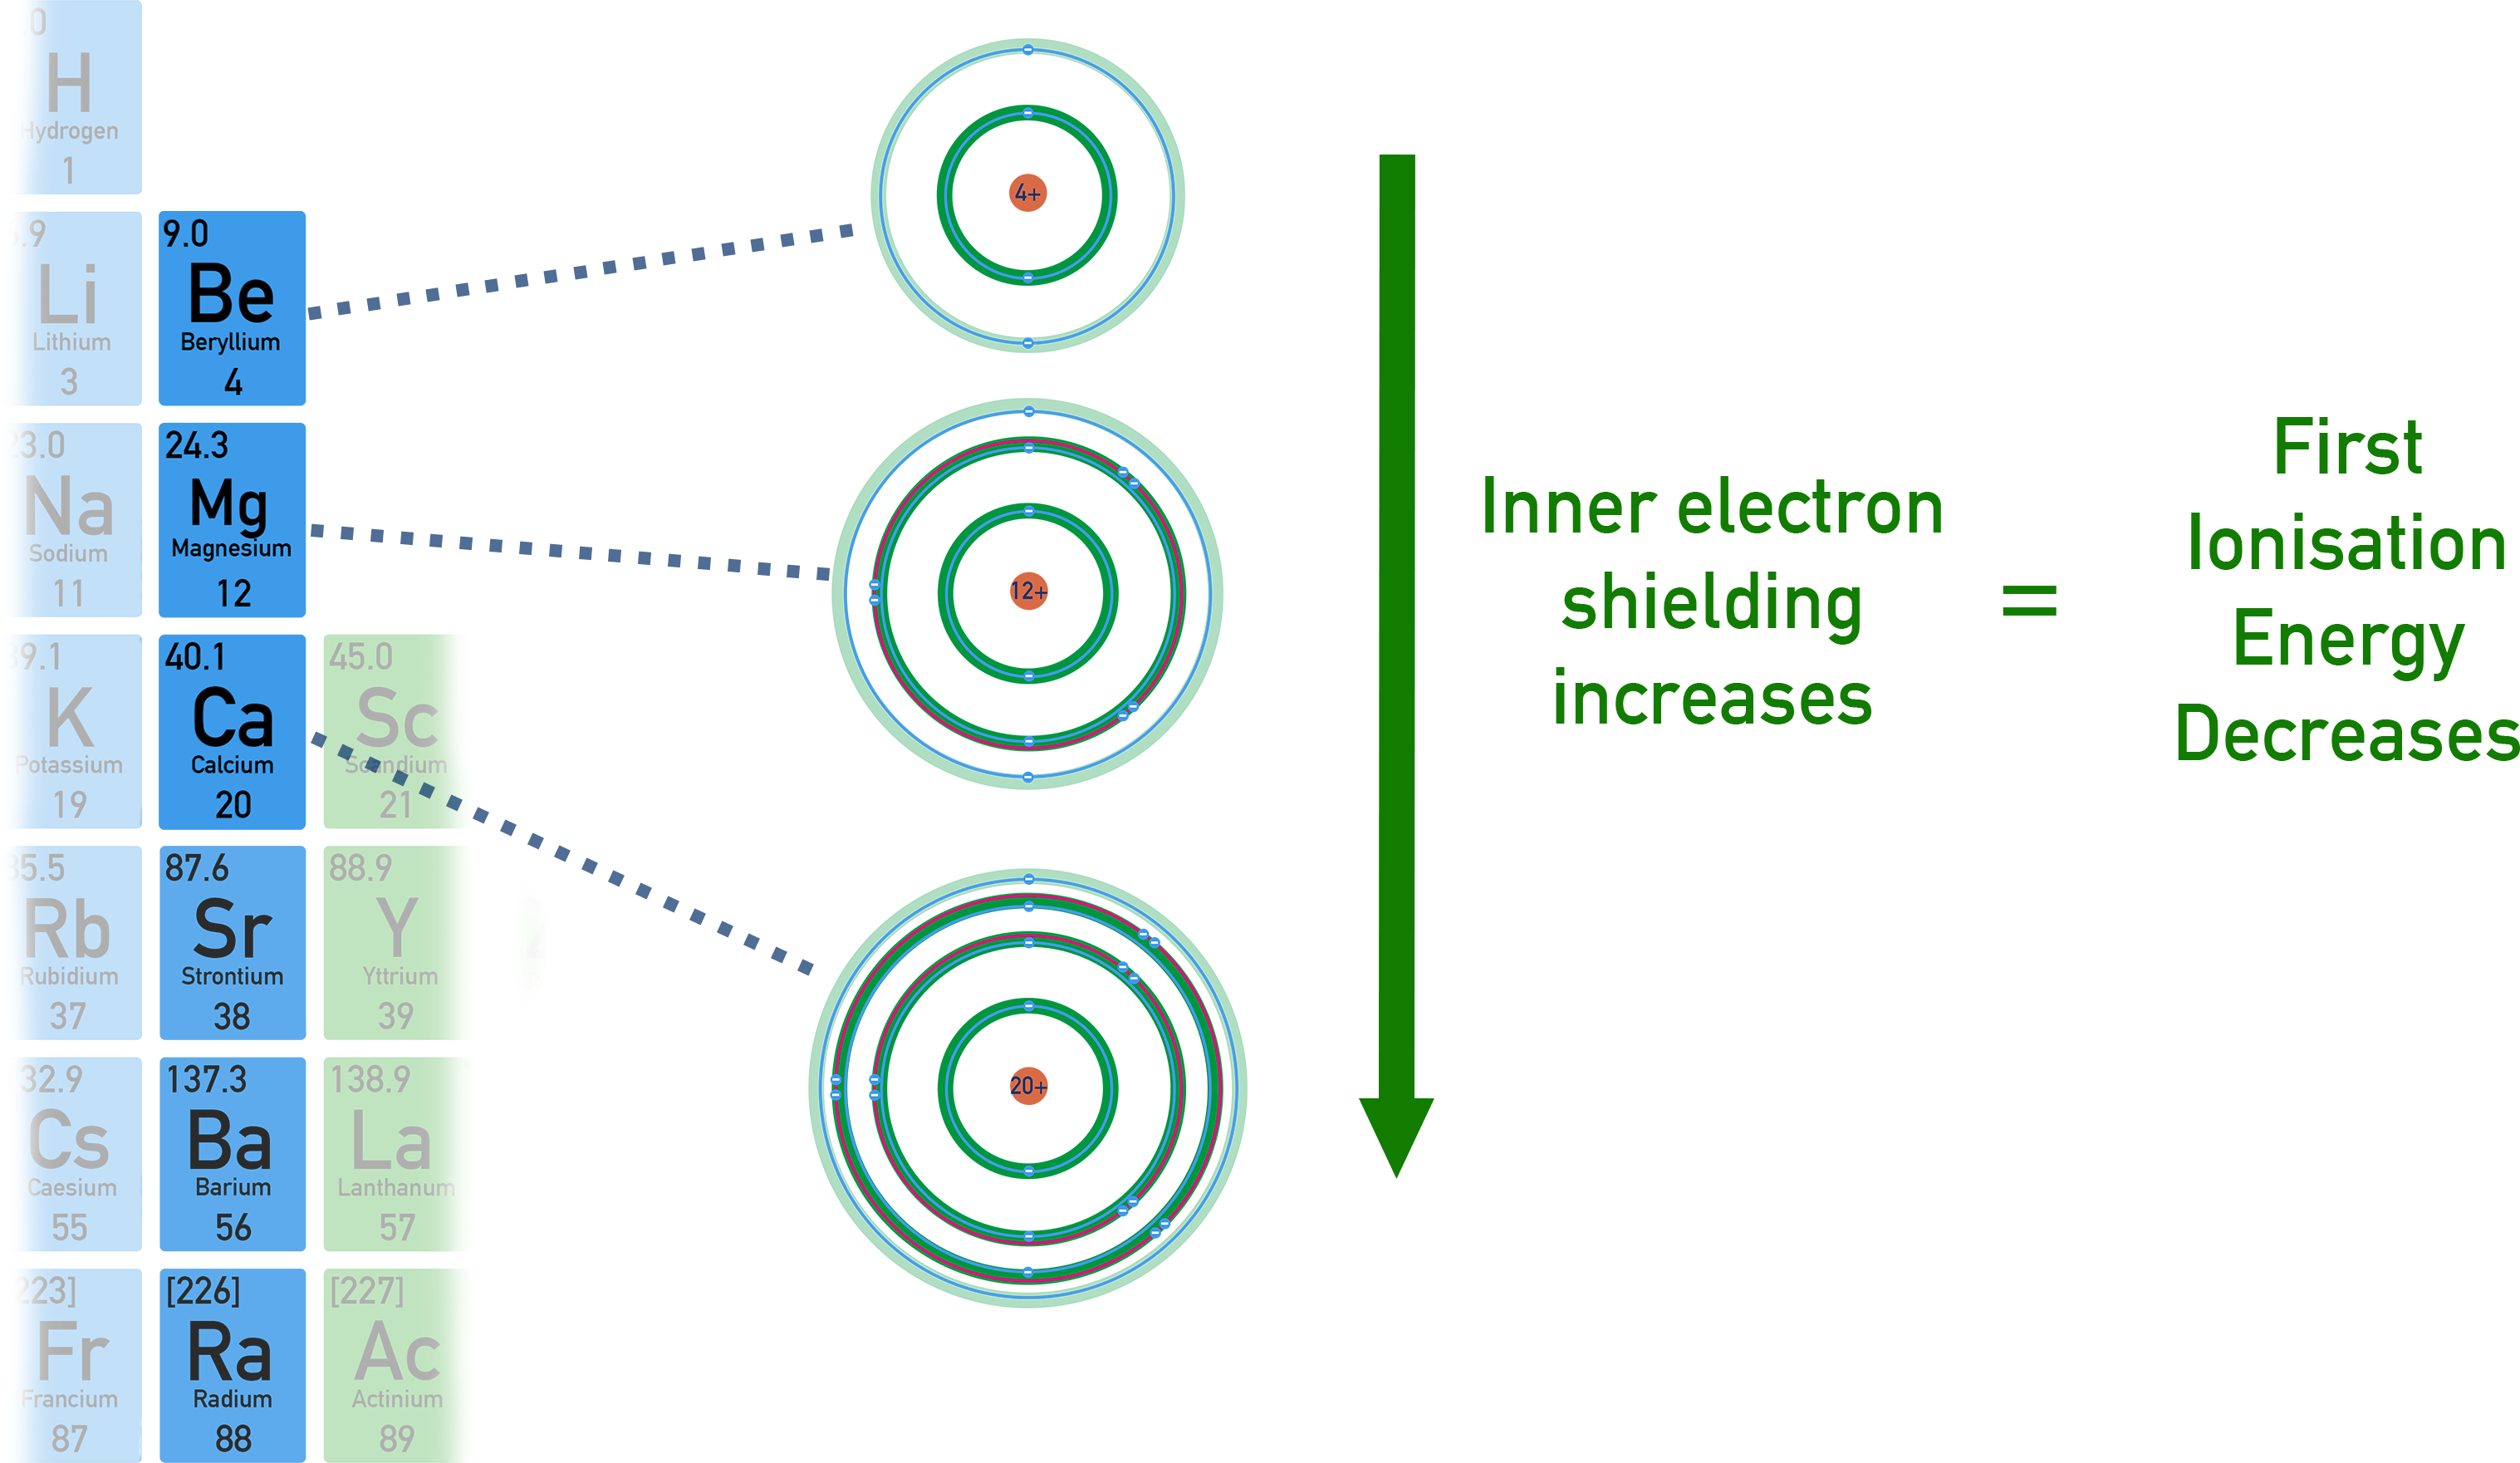
- Atomic radius increases.
- More shielding from inner shells.
- Outer electrons further from nucleus, easier to remove.
Discontinuities Across a Period
There are two main exceptions to the smooth increase across a period:
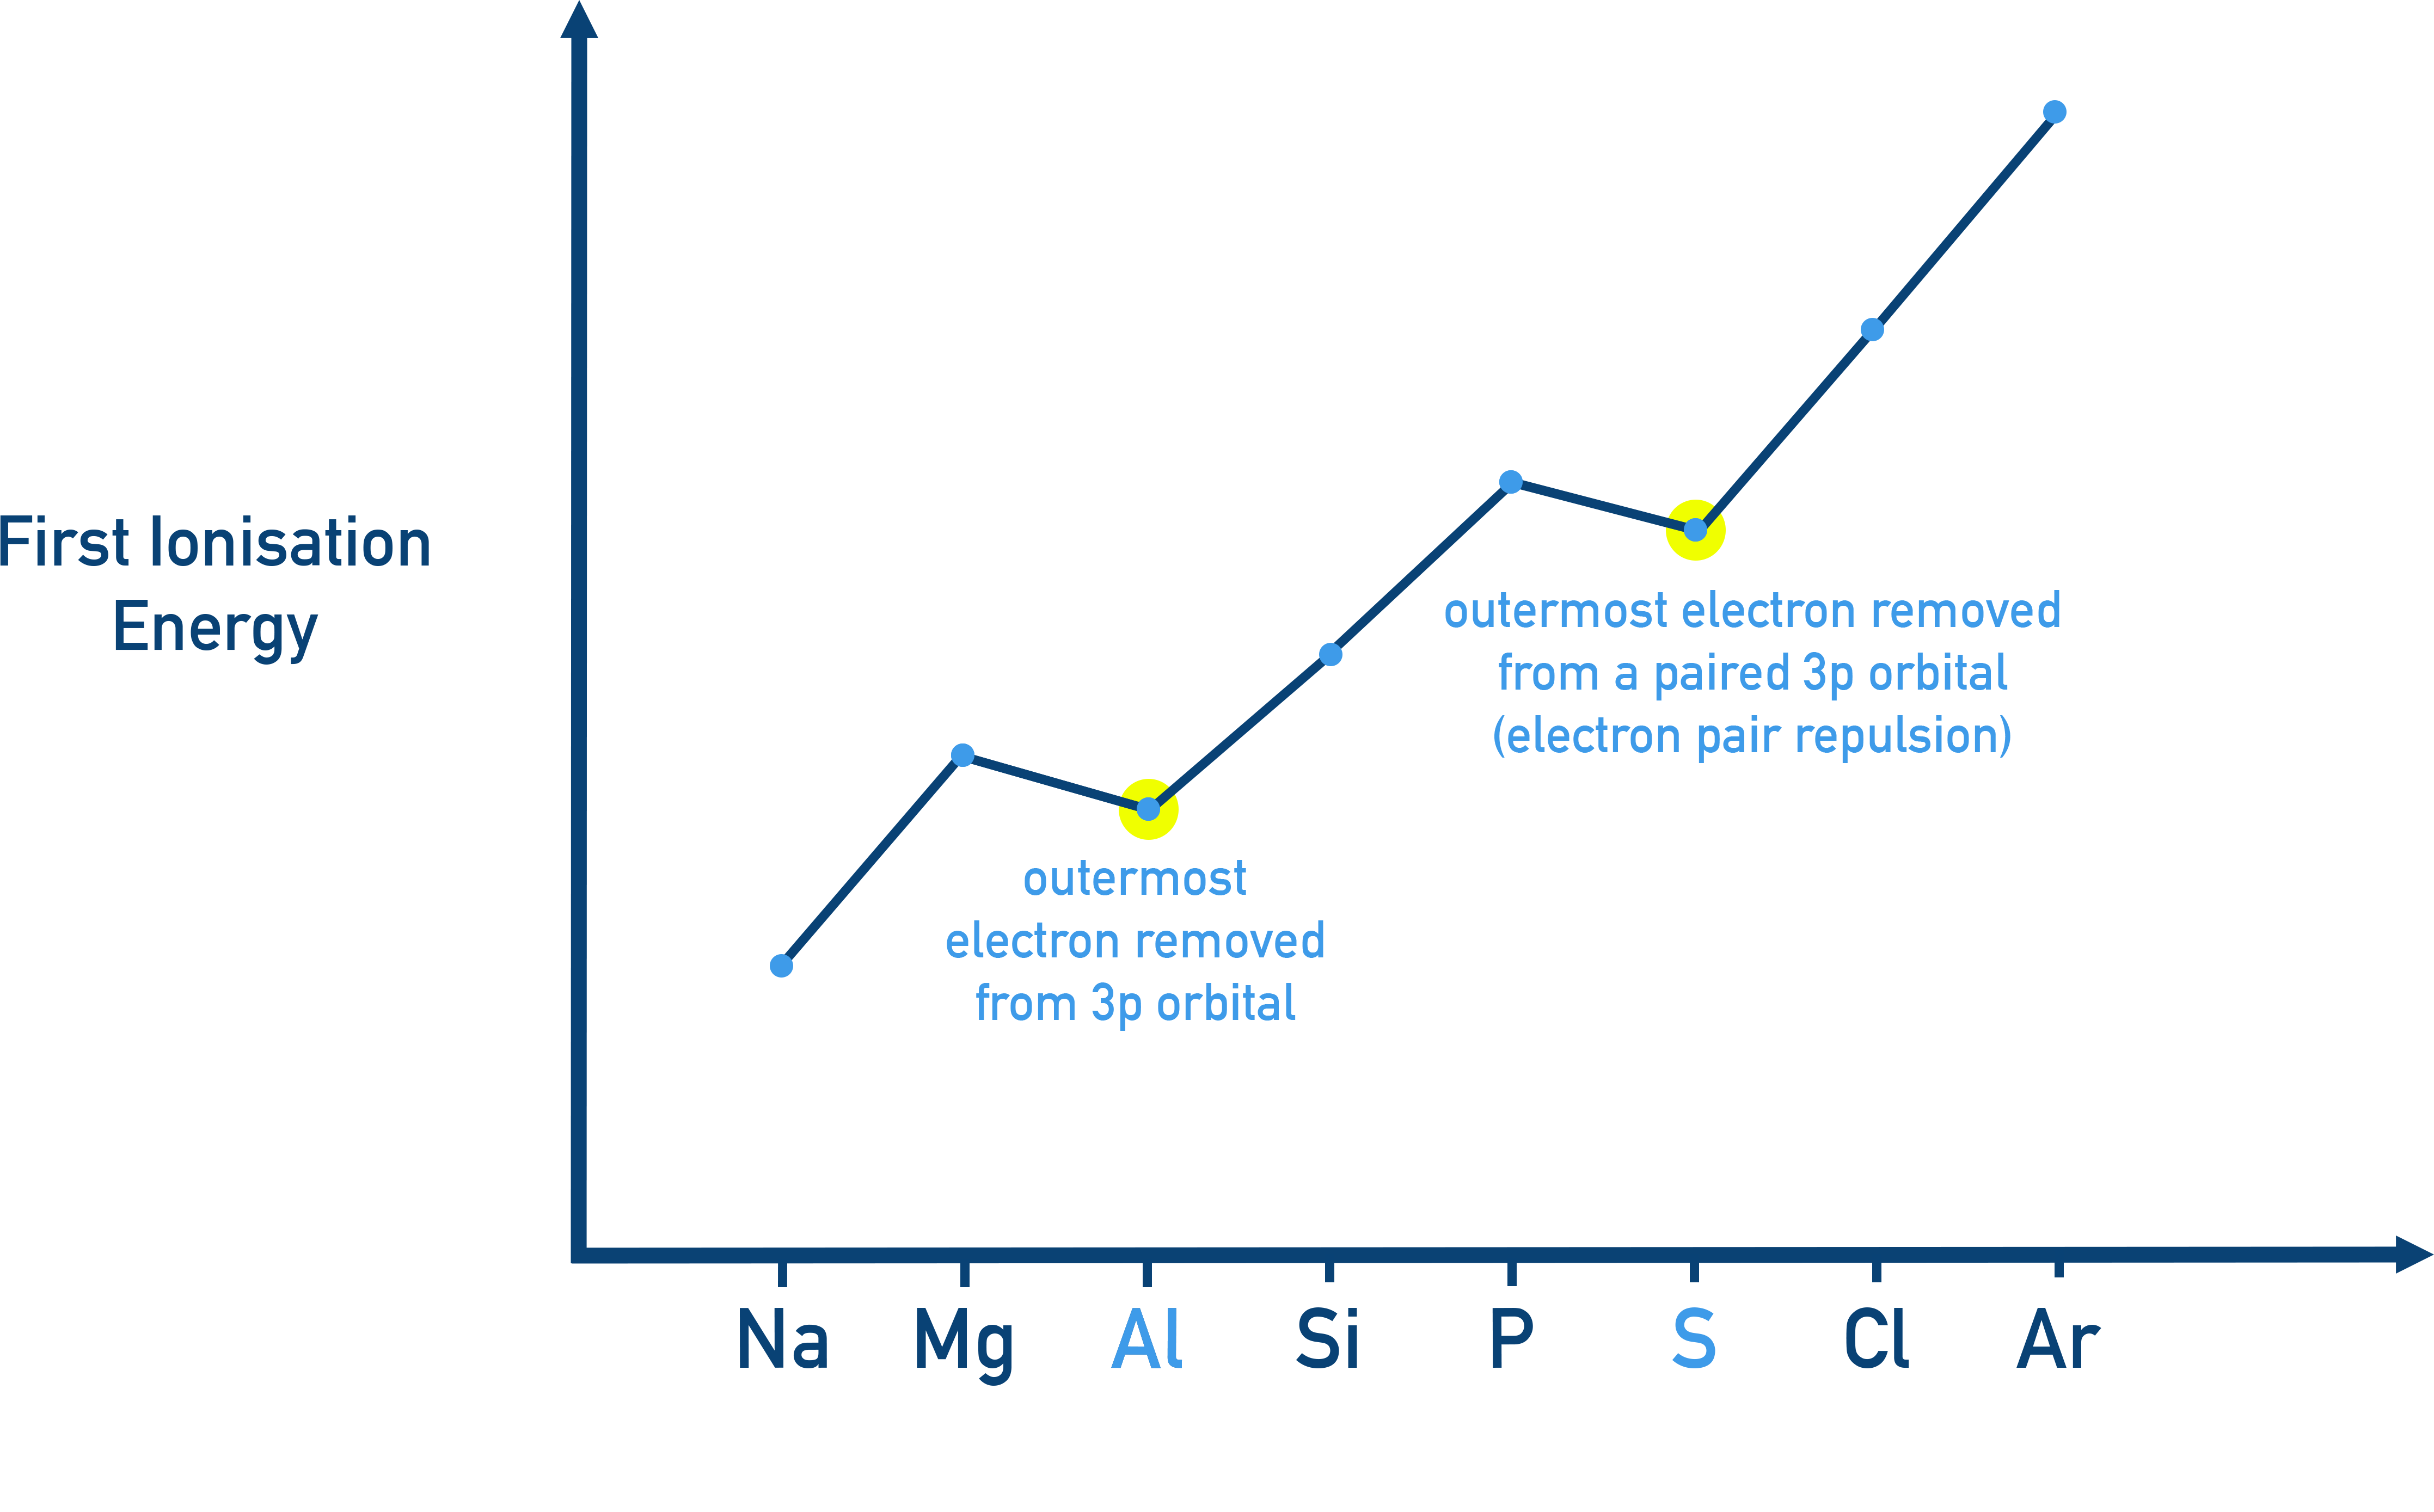
Between Group 2 and Group 13 (e.g., Mg → Al)
Aluminium (Al): Lower than magnesium (Mg), meaning electron removed must have less attraction to the nucleus (be further away and higher energy). This is explained as the outer electron being in a 3p orbital (higher in energy than the 3s orbital the outer electron in magnesium is in).
Between Group 15 and Group 16 (e.g., S → Cl)
Sulfur (S): Lower than phosphorus (P), meaning outermost electron removed must be higher in energy and easier to remove than for sulfur. This is explained as being due to electron pairing in a 3p orbital, causing repulsion and giving evidence that the 3p sub shell must contain 3 orbitals (as the 4th electron in the sub shell has to pair up with another electron in an orbital).
Calculating Ionization Energy from Spectral Data
You can calculate IE from the wavelength or frequency of the convergence limit using two key equations:
- E = h × f
(E = energy in joules, h = Planck constant, f = frequency) - c = λ × f
(c = speed of light, λ = wavelength in meters, f = frequency)
Steps:
- If given λ (wavelength), first calculate frequency: f = c ÷ λ
- Then calculate energy: E = h × f
- To convert energy per photon into kJ mol⁻¹:
- Multiply by Avogadro’s number (L)
- Divide by 1000
Constants:
- h = 6.63 × 10⁻³⁴ J·s
- c = 3.00 × 10⁸ m/s
- L = 6.02 × 10²³ mol⁻¹
Summary
- The convergence limit in hydrogen’s spectrum shows ionization energy.
- IE depends on nuclear charge, atomic radius, and shielding.
- Across a period, IE increases and down a group, IE decreases.
- Discontinuities provide evidence for sublevels and orbital pairing.
- Spectral data can be used to calculate IE using E = h × f and c = λ × f.
Linked Questions
How does the trend in ionisation energy values across a period and down a group explain the trends in properties of metals and non-metals?
Ionisation energy (IE) reflects how strongly an atom holds onto its outer electrons. Across a period, IE increases as nuclear charge rises and atomic radius decreases, making it harder to remove electrons. This explains why metallic character decreases and non-metallic character increases across a period. Down a group, IE decreases due to greater distance and shielding between outer electrons and the nucleus, meaning electrons are more easily lost — so metallic character increases while non-metallic character decreases.
Why are log scales useful when discussing [H⁺] and ionisation energies?
Logarithmic scales allow scientists to represent quantities that vary across many orders of magnitude in a compact and manageable way. The hydrogen ion concentration, [H⁺], ranges from about 1 to 10⁻¹⁴ mol dm⁻³, so expressing it as pH = –log₁₀[H⁺] simplifies comparisons and highlights proportional changes. Similarly, plotting ionisation energies on a log scale makes large differences between elements easier to visualise and compare, revealing patterns such as periodicity or the relative difficulty of successive electron removals.