
pH Curves of Acid–Base Reactions HL Only
Quick Notes
- pH curves show the change in pH as acid or base is added.
- Titration curves have slightly different shapes depending on if strong or weak acids and bases are used.
- Can use half-equivalence point to determine Ka of a weak acid or Kb of a weak base.
Full Notes
pH curves graph the change in pH as one reagent is added to another during a titration. The shape of the curve depends on the strength of the acid and base involved.
Types of Titration Curves
Here’s a breakdown of the common acid–base titrations you need to know:
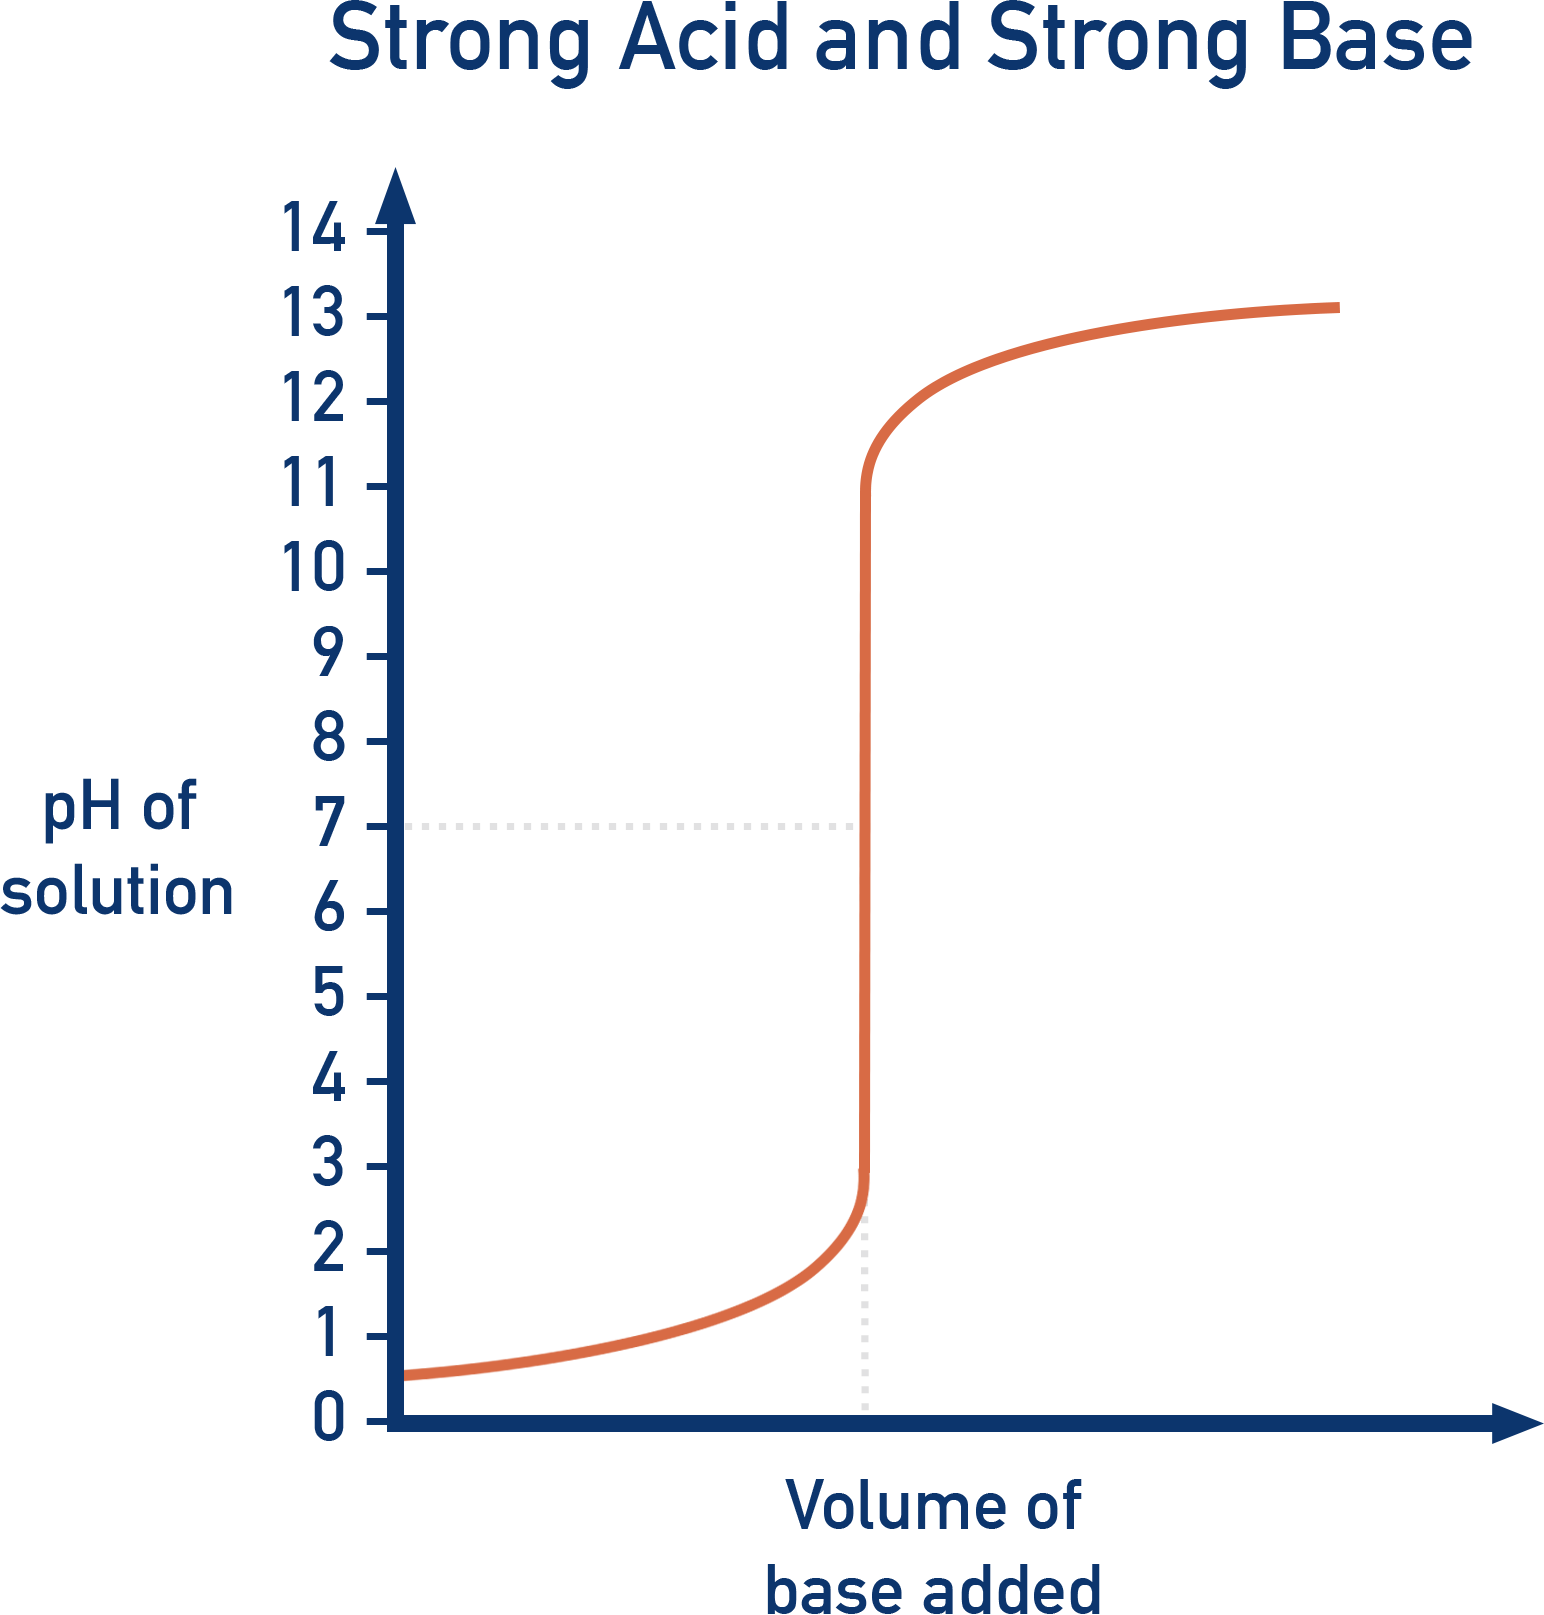
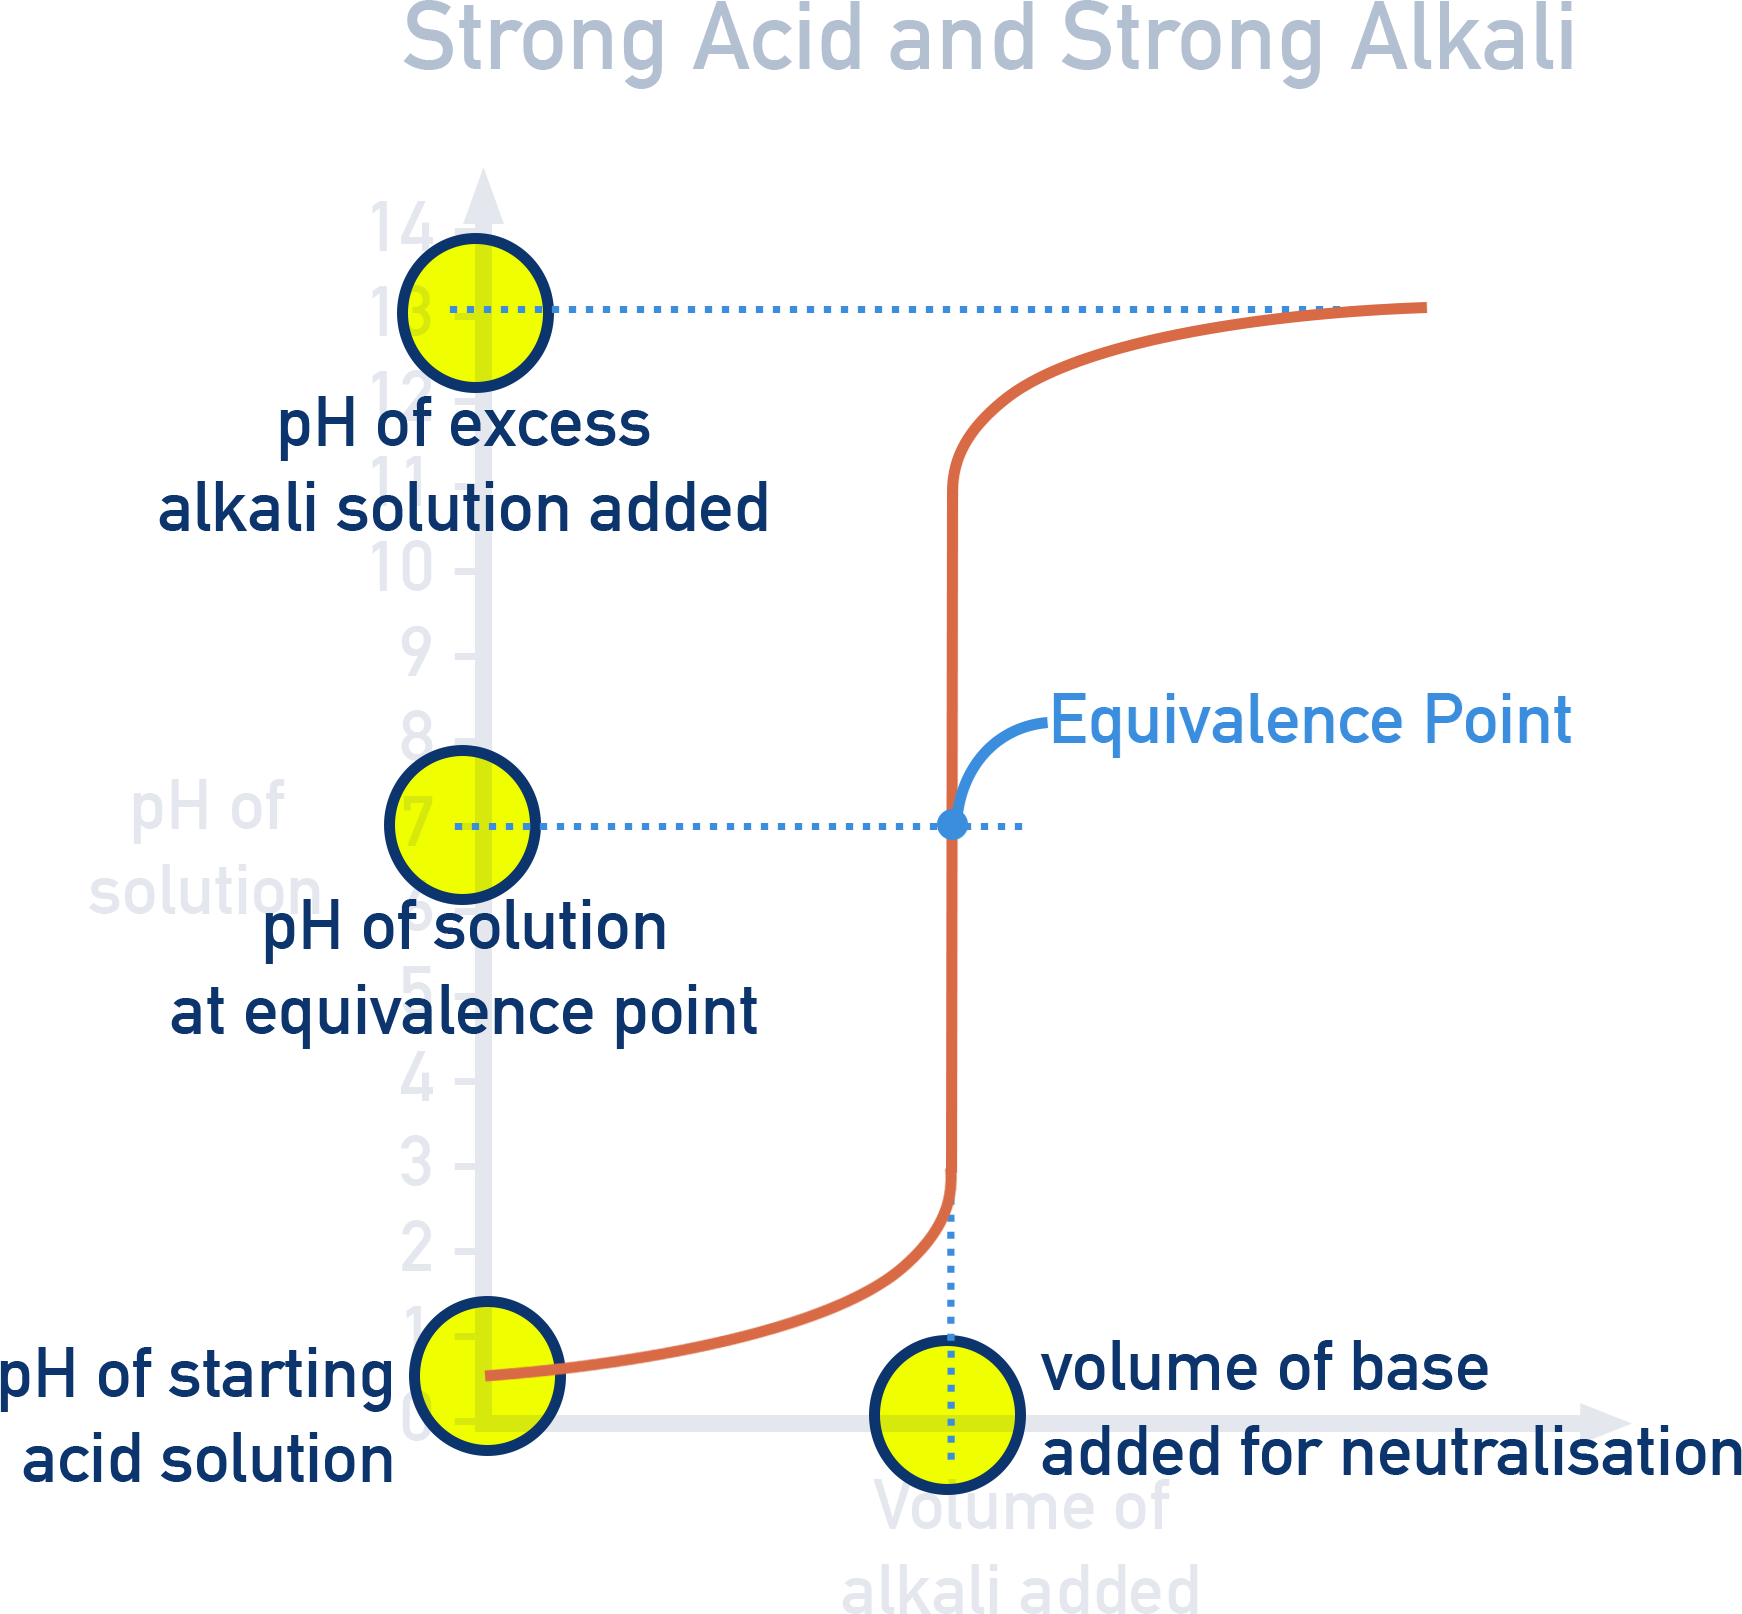
Strong Acid vs. Strong Base (e.g. HCl + NaOH)
- Initial pH: Very low (~1, strong acid).
- Rapid rise around pH 7 (equivalence point).
- Final pH: Very high (~13, strong base).
- Suitable indicators: Phenolphthalein or Methyl Orange.
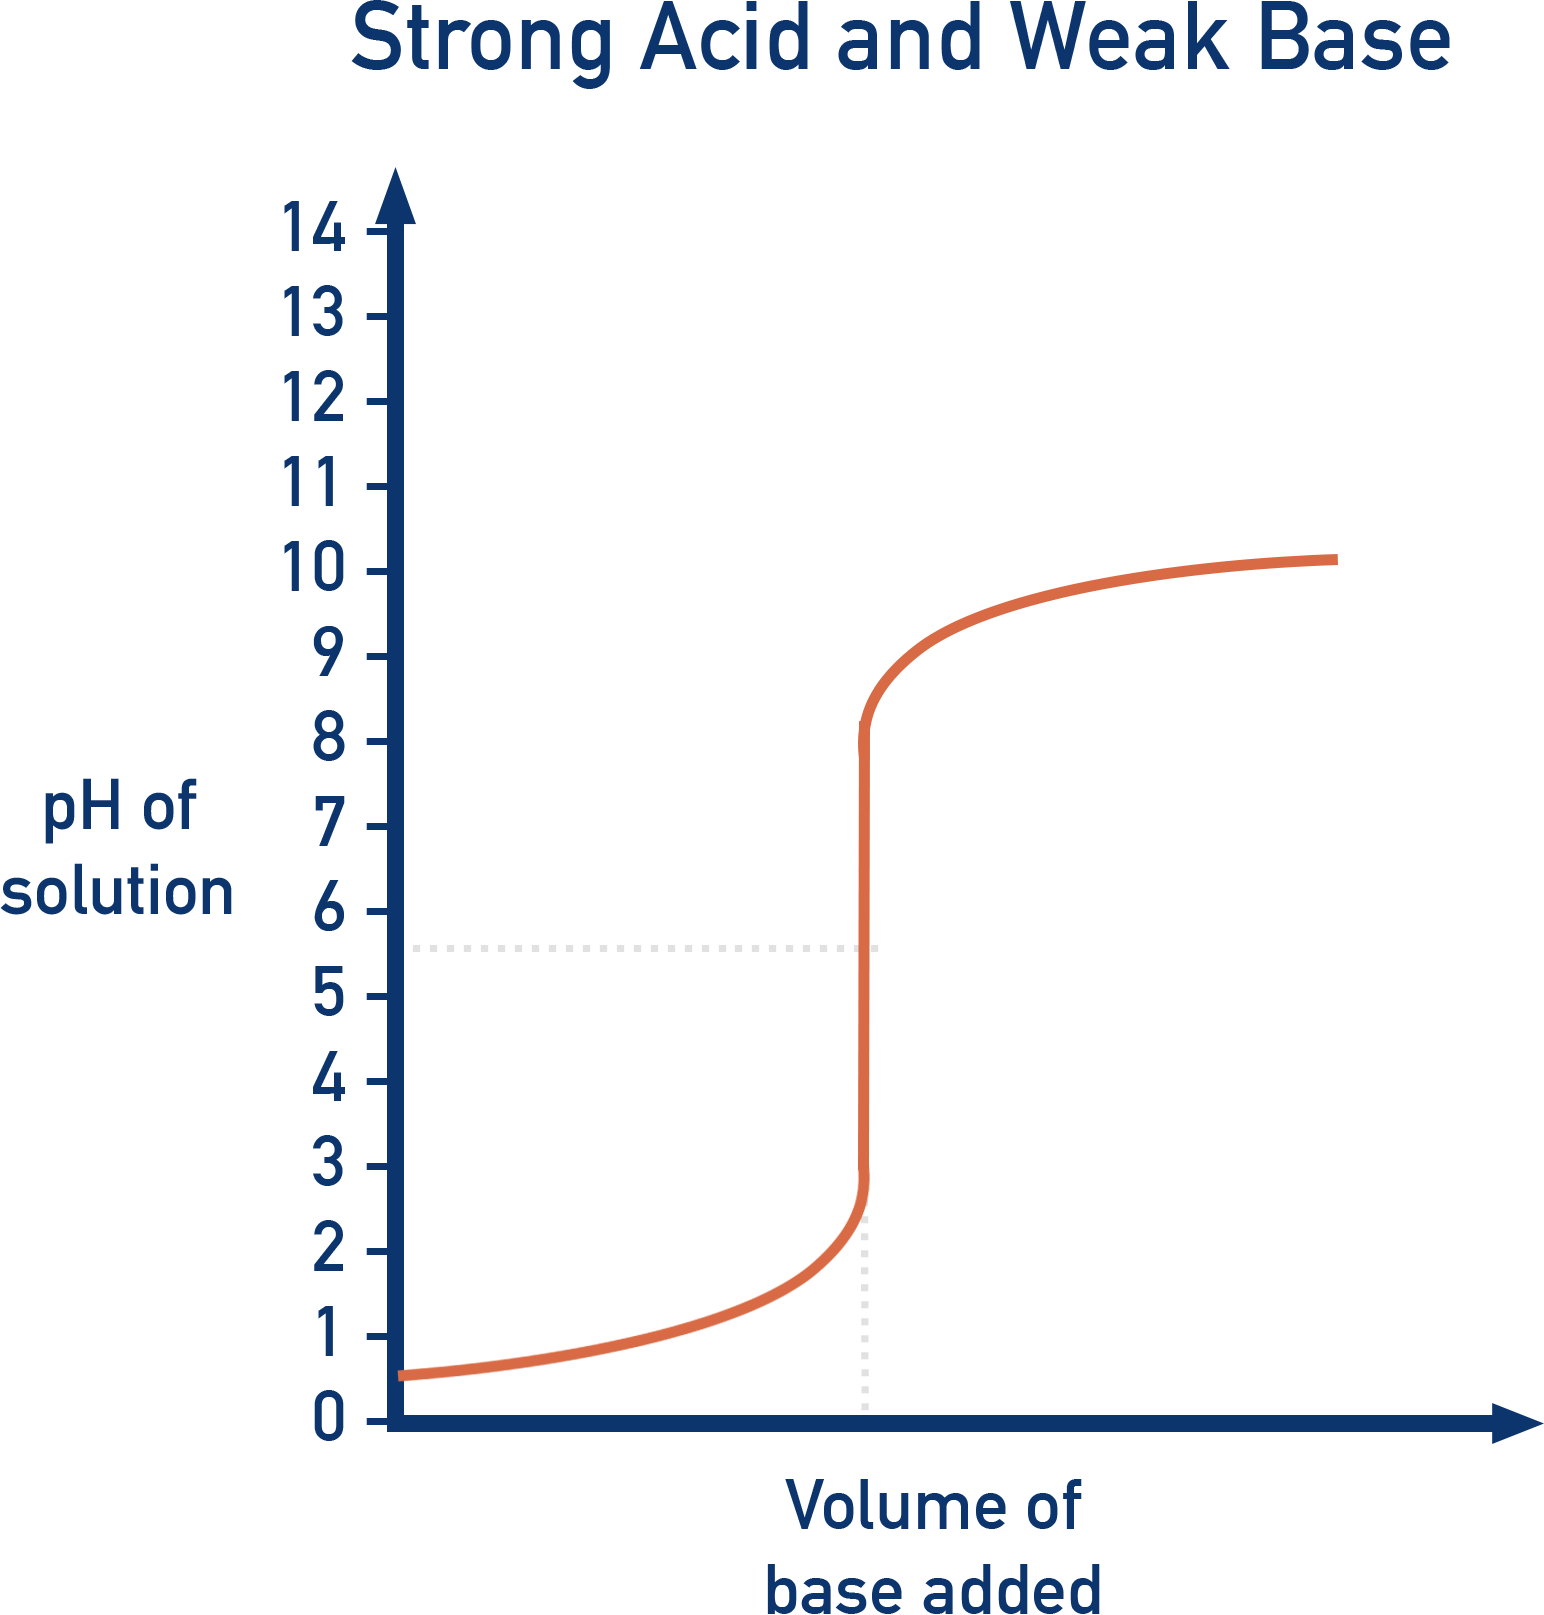
Strong Acid vs. Weak Base (e.g. HCl + NH3)
- Initial pH: Very low (~1, strong acid).
- Equivalence point: Below pH 7 (~5).
- Final pH: ~9 to 10, weak base.
- Suitable indicator: Methyl Orange.
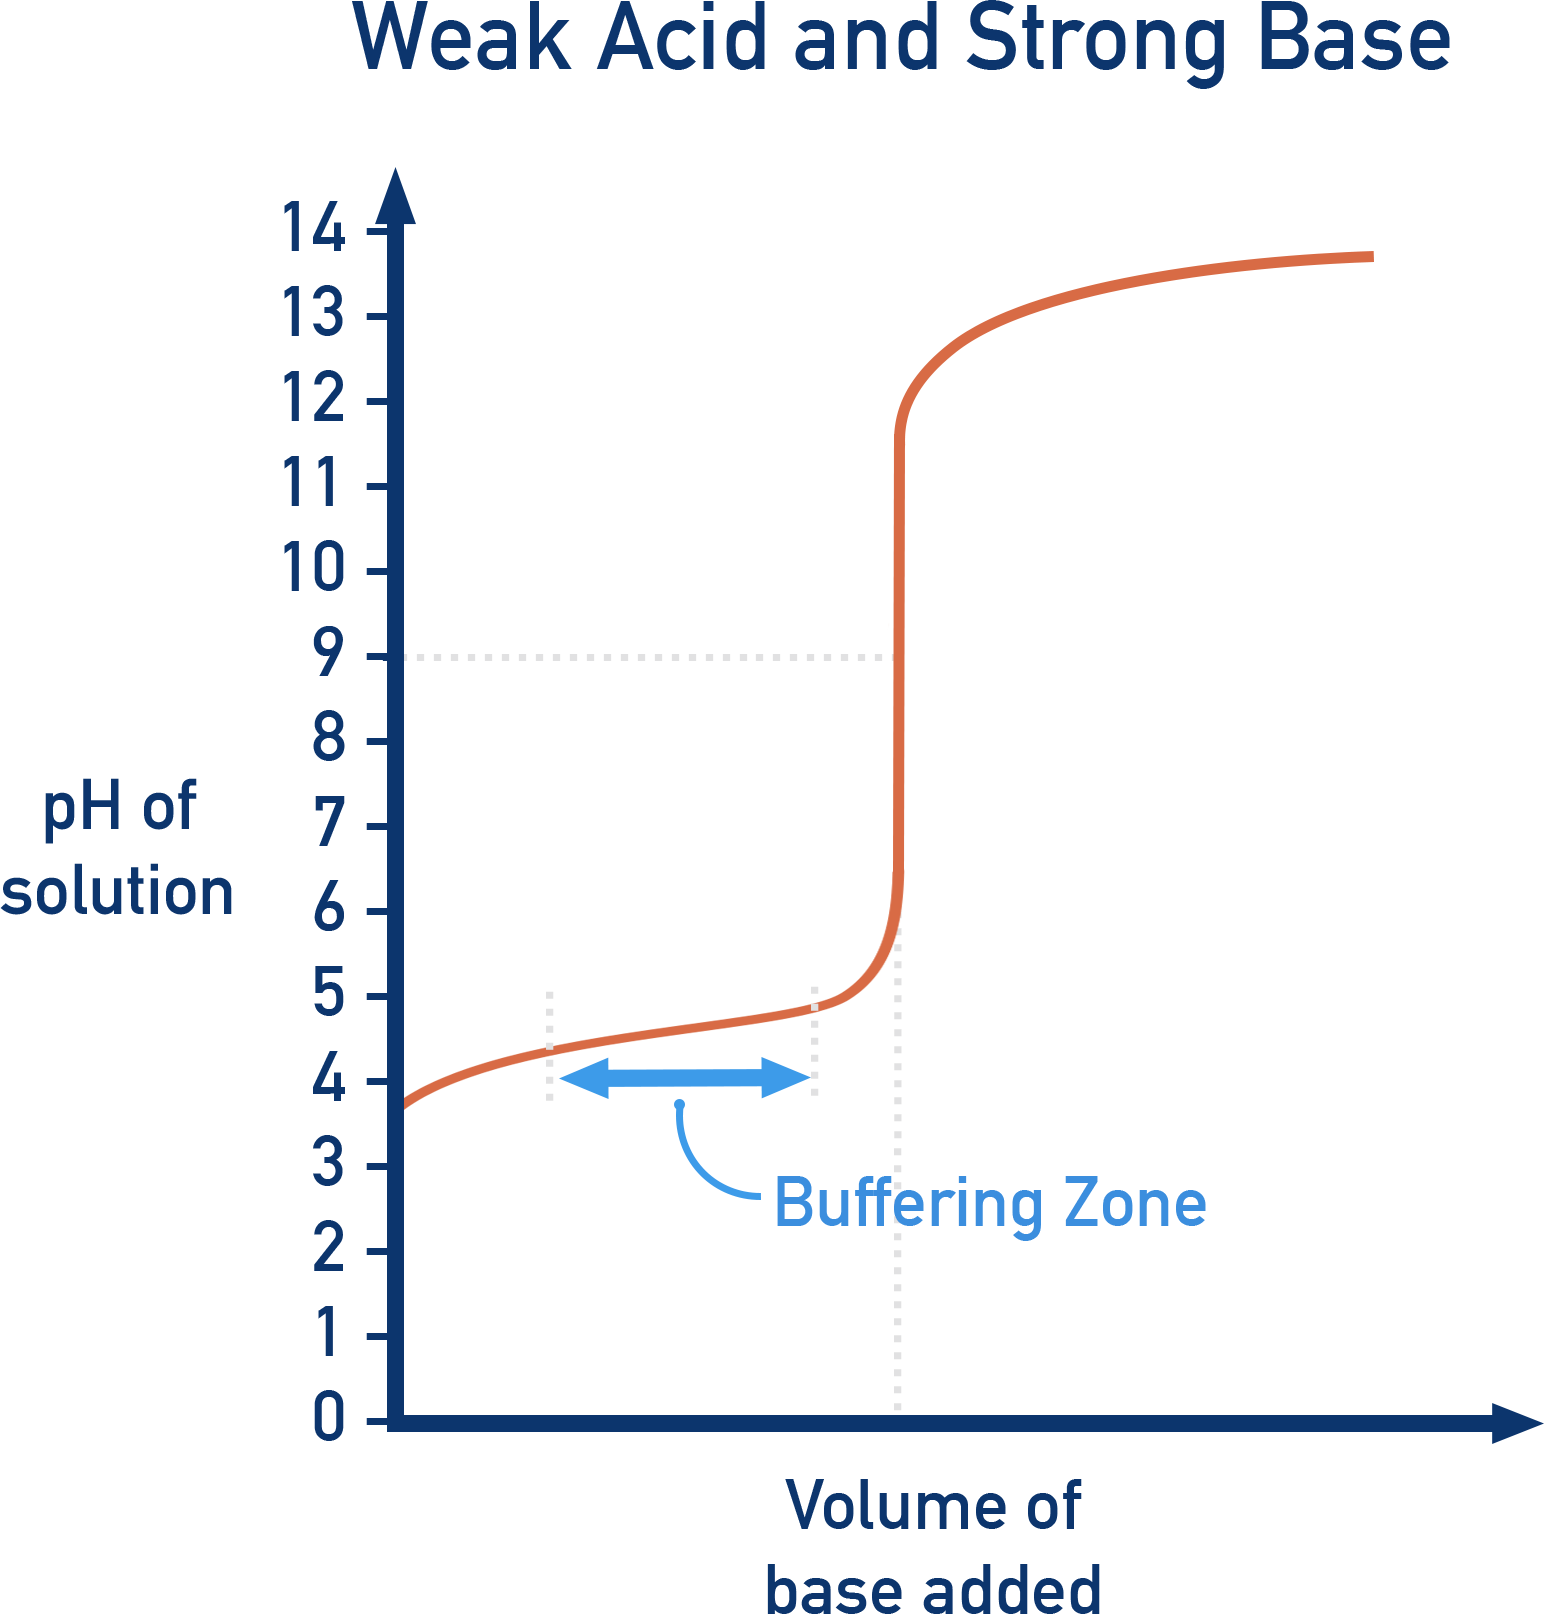
Weak Acid vs. Strong Base (e.g. CH3COOH + NaOH)
- Initial pH: Moderate (~4, weak acid).
- Buffer zone: After a small quantity of base is added, a buffer system is formed meaning the pH change is minimised until overwhelmed.
- Equivalence point: Above pH 7 (~9).
- pH at half-neutralisation = pKa
- Final pH: Very high (~13, strong base).
- Suitable indicator: Phenolphthalein.
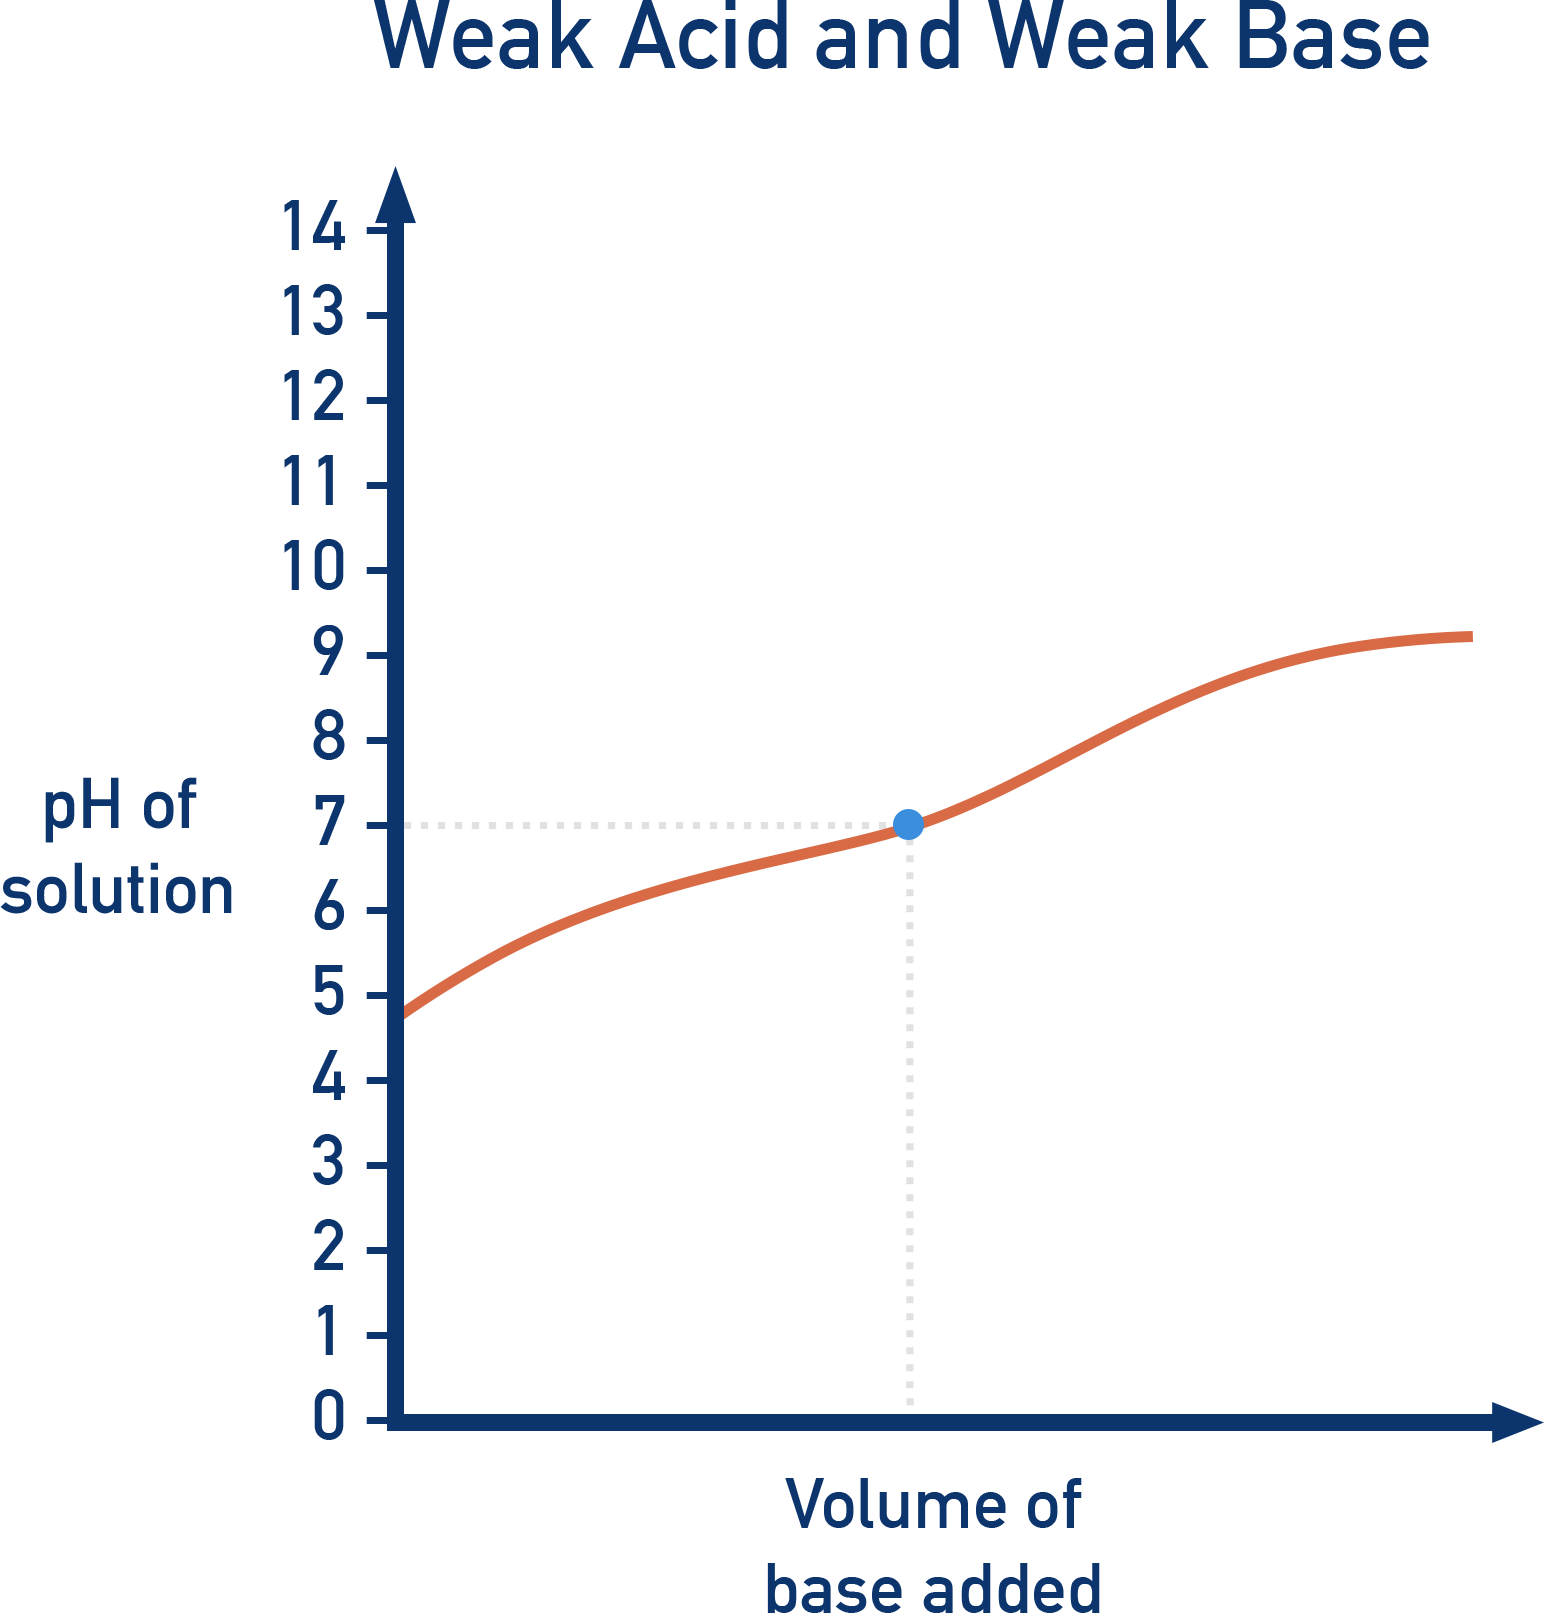
Weak Acid vs. Weak Base (CH3COOH + NH3)
- Initial pH: Moderate (~4, weak acid).
- No sharp pH change: No clear equivalence point.
- pH meter required (no suitable indicator).
Interpreting the Curve
- Initial pH: Depends on strength of acid or base.
- Buffer region (in weak acid + strong base): gradual pH rise due to partial neutralisation.
- Vertical section: where pH changes rapidly — marks the equivalence point.
- Final pH: set by excess base or acid added.
Key Points on Curves
- Intercept with pH axis: initial pH of acid (or base if titrating acid into base).
- Equivalence point: where moles of acid = moles of base added.
- Buffer region: gradual change in pH; presence of both weak acid/base and its conjugate.
- pH = pKa (or pOH = pKb): occurs at half-equivalence point for weak acid/base titrations.
Determining Ka Using a Titration Curve
The Ka of a weak acid can be found from its titration curve with a strong base (e.g. NaOH).
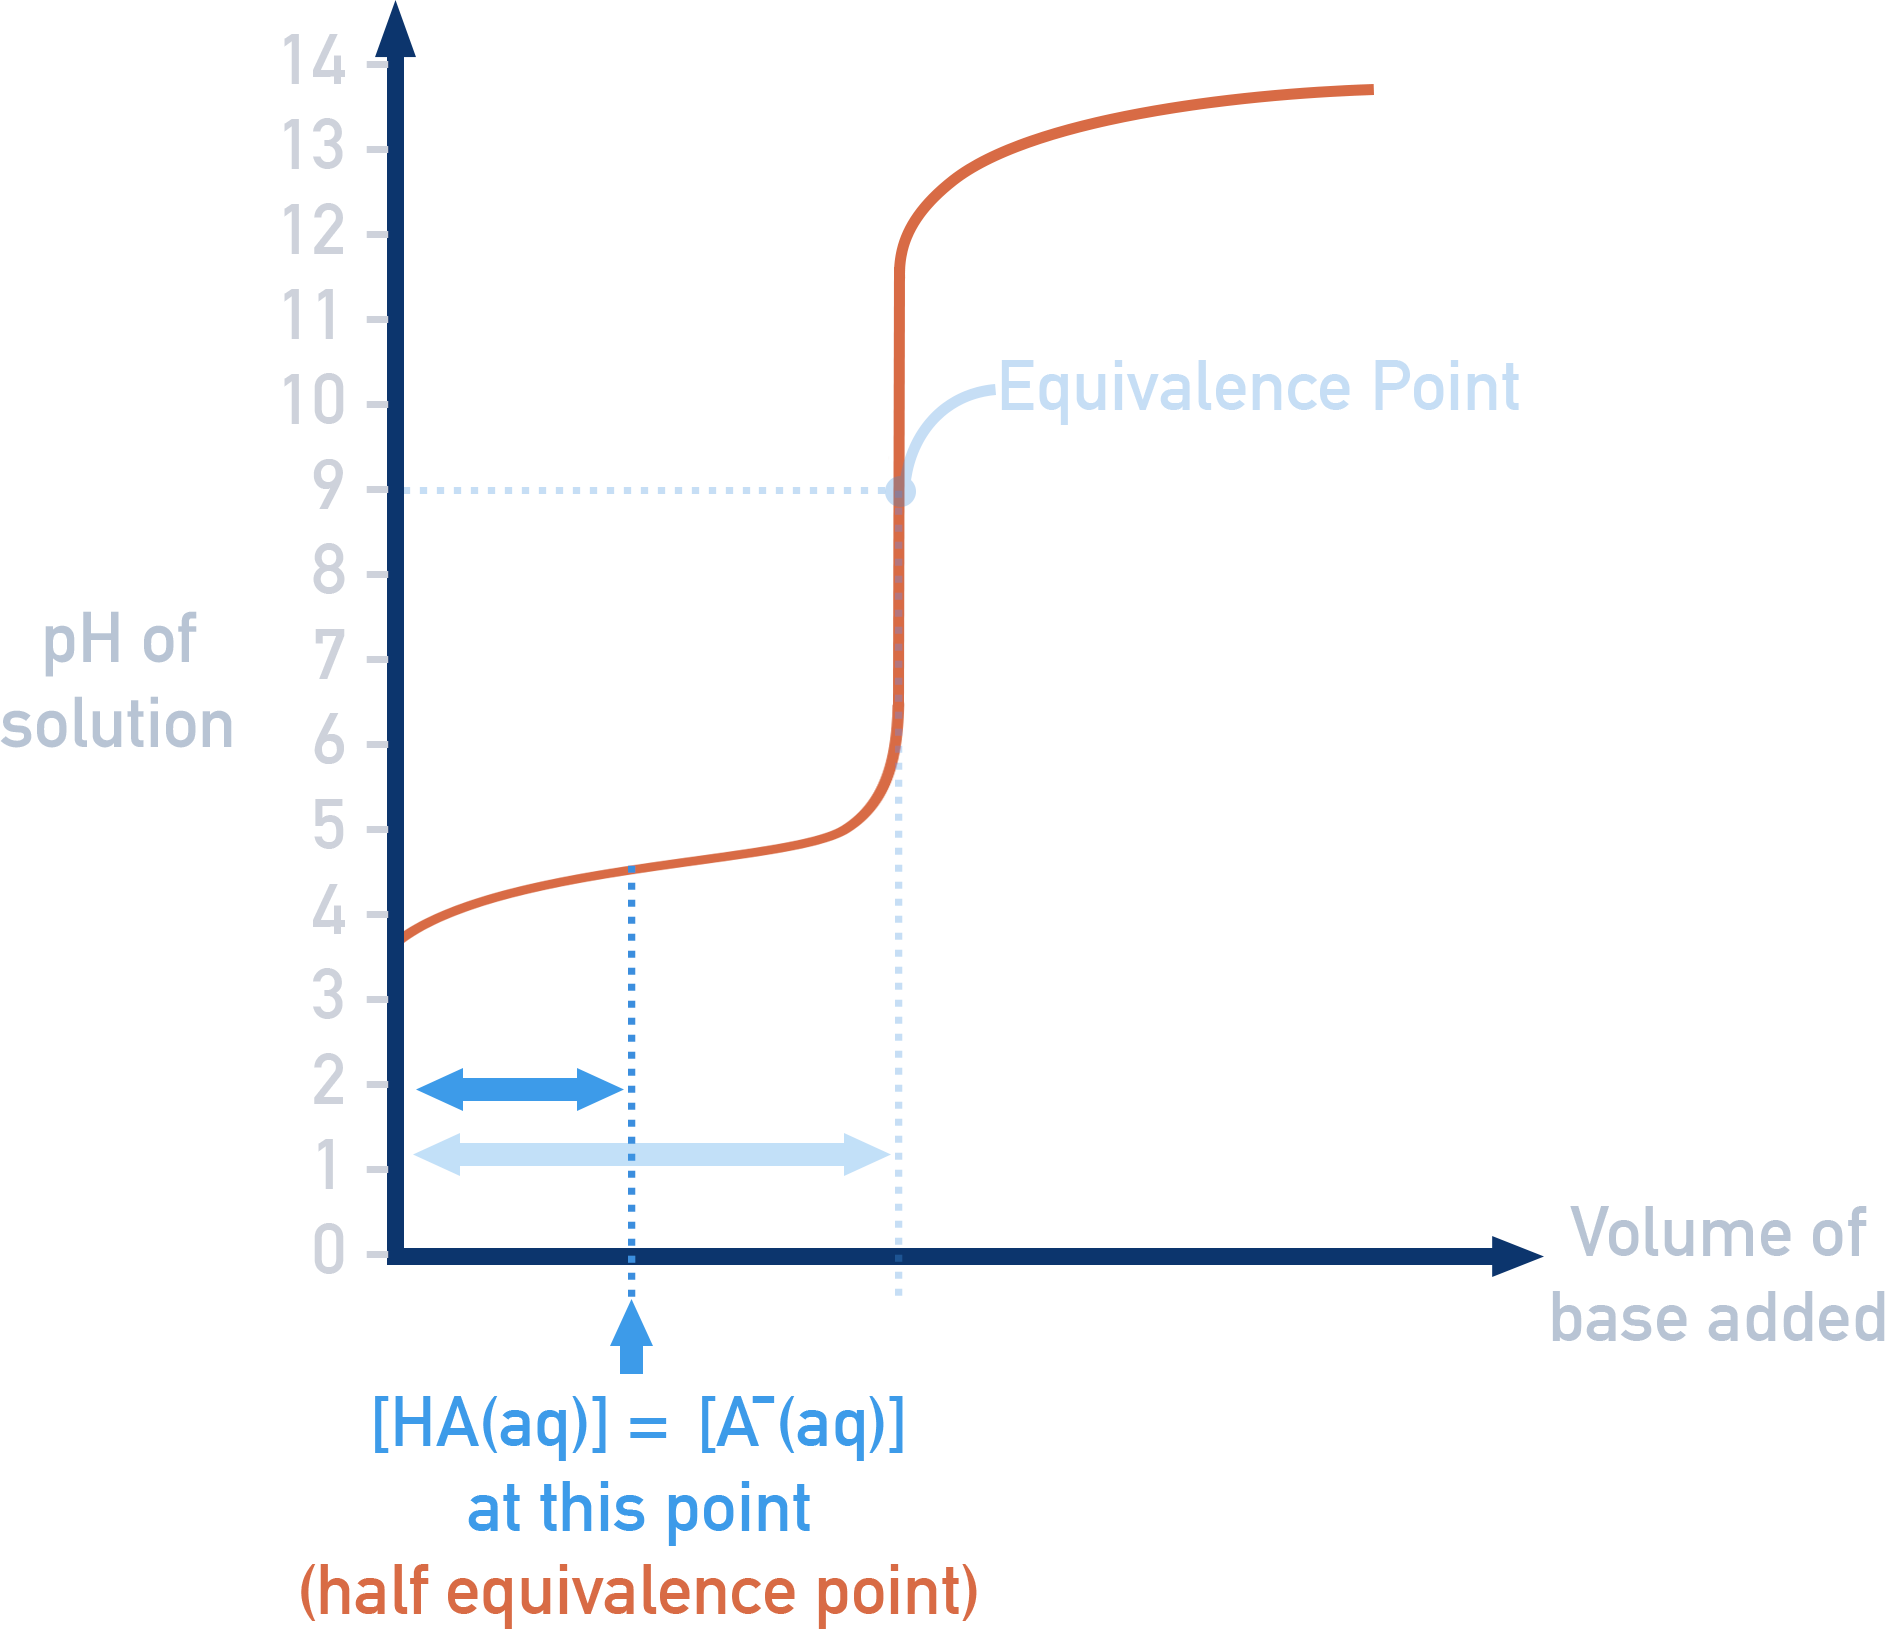
At the half-equivalence point, half of the acid has been neutralised
so: [HA] = [A⁻].
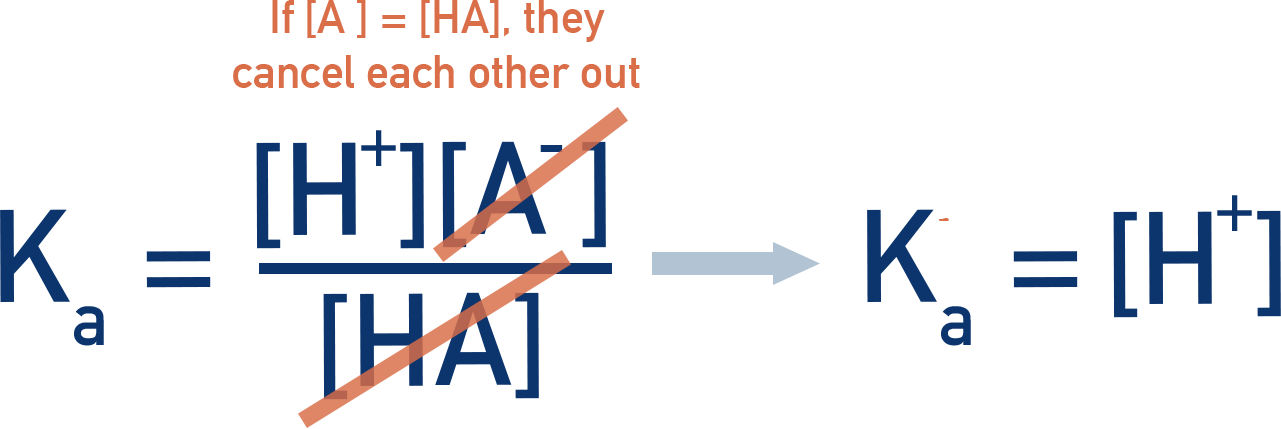
So: Ka = 10−pH and pKa = pH.
This makes the half-equivalence point a useful way to determine Ka or pKa directly from a titration curve.
Determining Kb Using a Titration Curve
The Kb of a weak base can also be found from its titration curve with a strong acid.
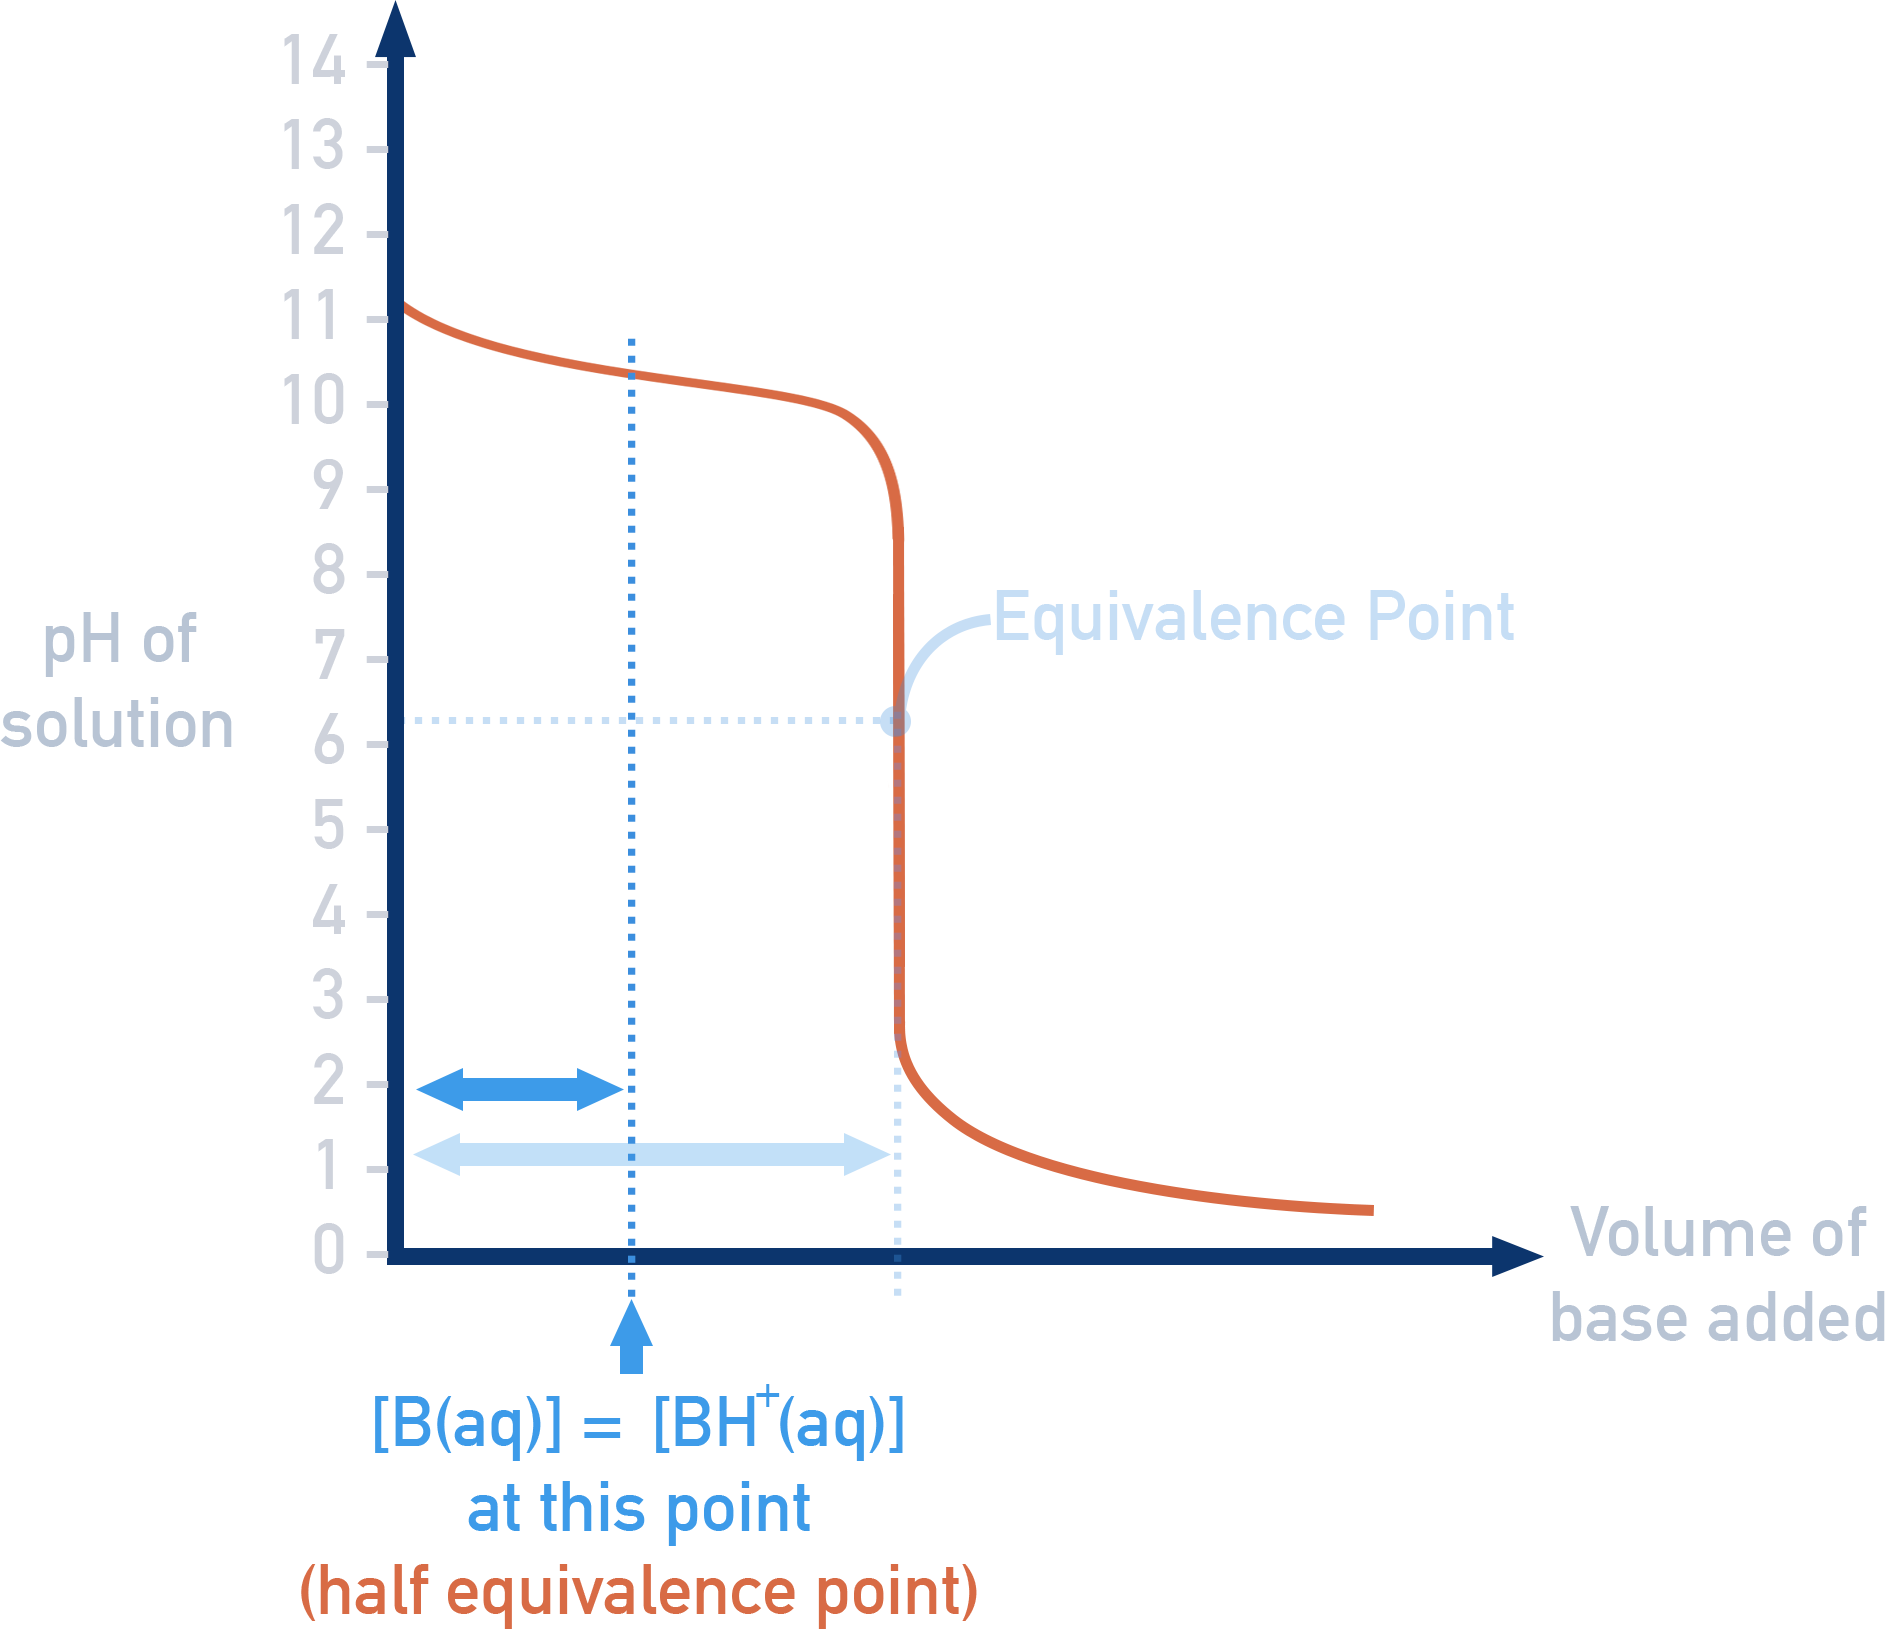
In this titration, the base reacts to form its conjugate acid (BH⁺):
B + H2O ⇌ BH⁺ + OH⁻
The equilibrium expression is:
Kb = [BH⁺][OH⁻] / [B]
At the half-equivalence point: [B] = [BH⁺].
So: Kb = [OH⁻], and taking logs: pKb = pOH.
Since pH + pOH = 14, you can use the pH at this point to calculate pKb.
Summary
- pH curves show neutralisation progress for different acid–base combinations.
- Equivalence points vary with acid and base strength.
- Buffer regions occur in weak acid/base titrations.
- Ka can be determined at half-equivalence (pH = pKa).
- Kb can be determined at half-equivalence (pOH = pKb).
When collecting data to generate a pH curve, when should smaller volumes of titrant be added between each measurement?
Smaller volumes of titrant should be added near the equivalence point, where pH changes rapidly with small additions. This ensures more accurate data around the steepest part of the pH curve, where the most significant chemical changes occur. Larger volume increments can be used before and after this region, where the pH changes more gradually.