Colour in Transition Element Complexes HL Only
Quick Notes
- Transition metal complexes appear coloured because light is absorbed when an electron is promoted between split d-orbitals.
- The energy gap (ΔE) between the split d-levels corresponds to the wavelength of absorbed light.
- The colour observed is the complementry colour of the colour absorbed.
- We can use the colour wheel to match absorbed and observed colours.
- Equation: c = λ × f
- c = speed of light (3.00 × 10⁸ m/s)
- λ = wavelength (m)
- f = frequency (Hz)
Full Notes
Why Are Transition Metal Complexes Coloured?
In an isolated transition metal atom, the d-orbitals are degenerate (same energy).
In a complex however, ligands interact with the metal ion, causing the d-orbitals to split into two energy levels.
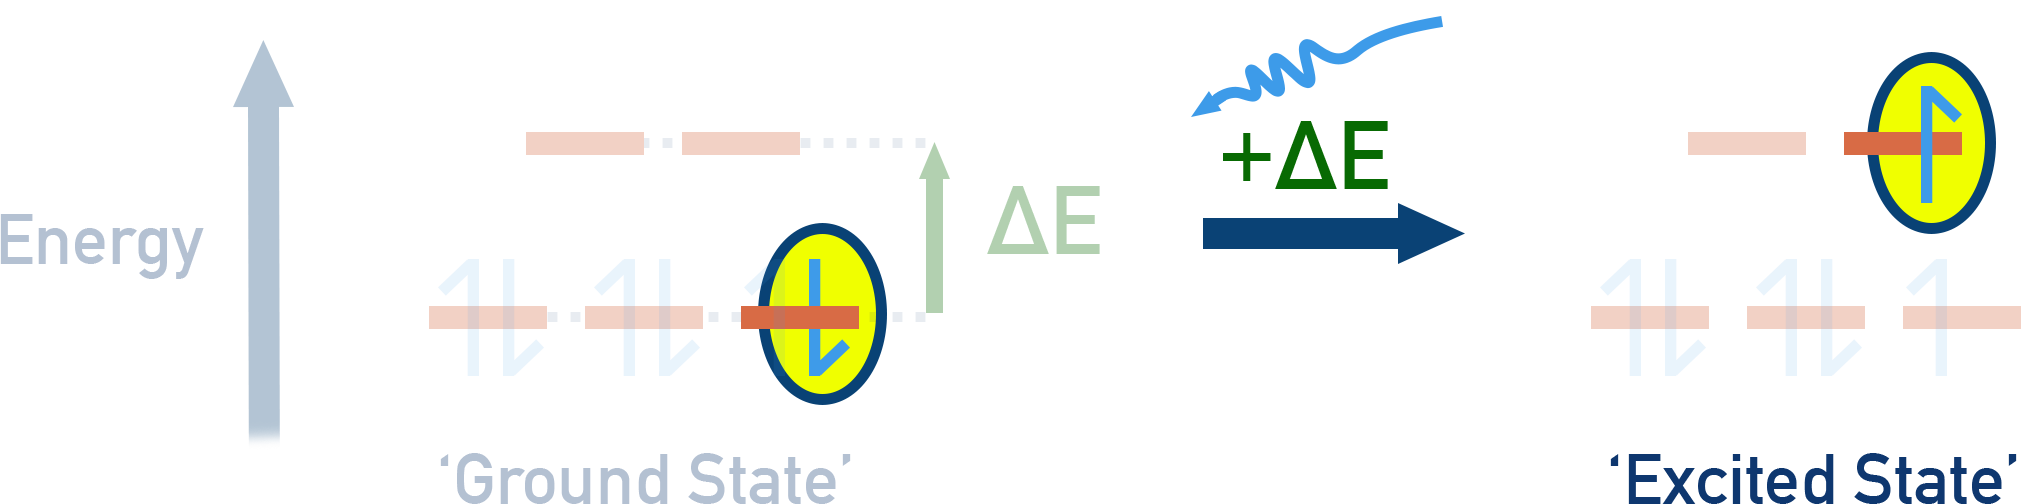
When light hits the complex, electrons in the lower d-orbital can absorb energy and be promoted to the higher d-orbital, going from ground state to excited state.
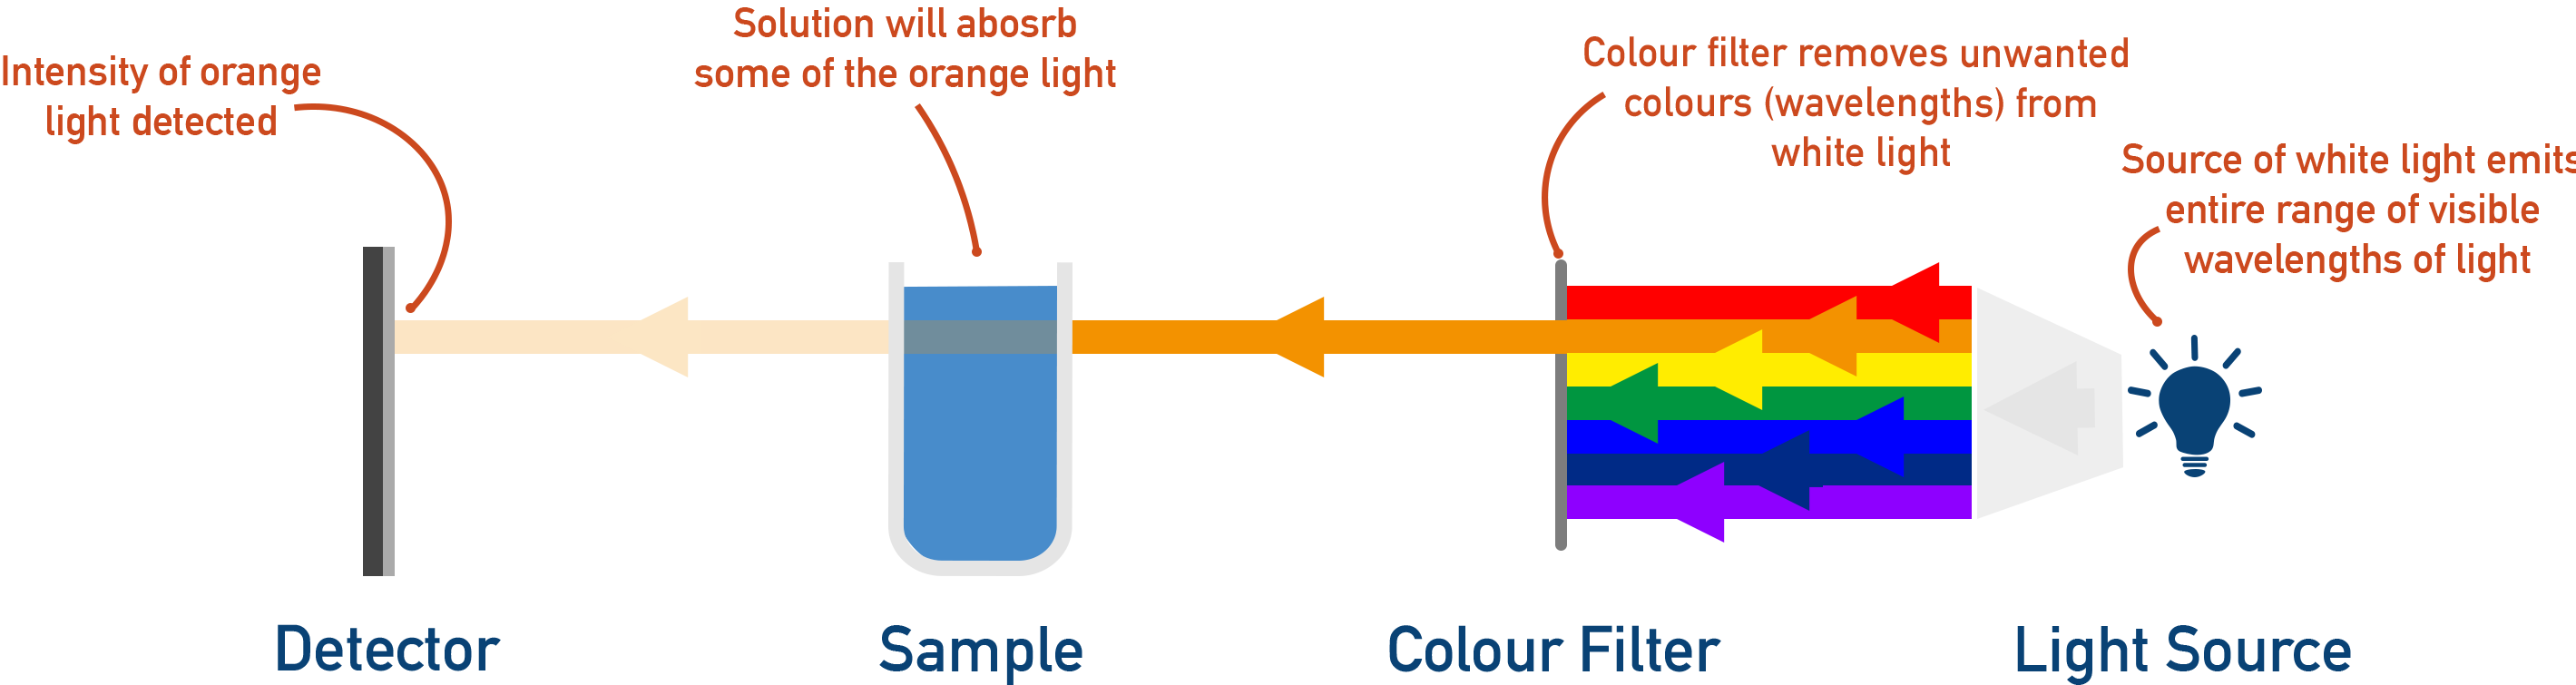
Only specific wavelengths of visible light are absorbed. The light not absorbed is transmitted or reflected, producing the observed colour.
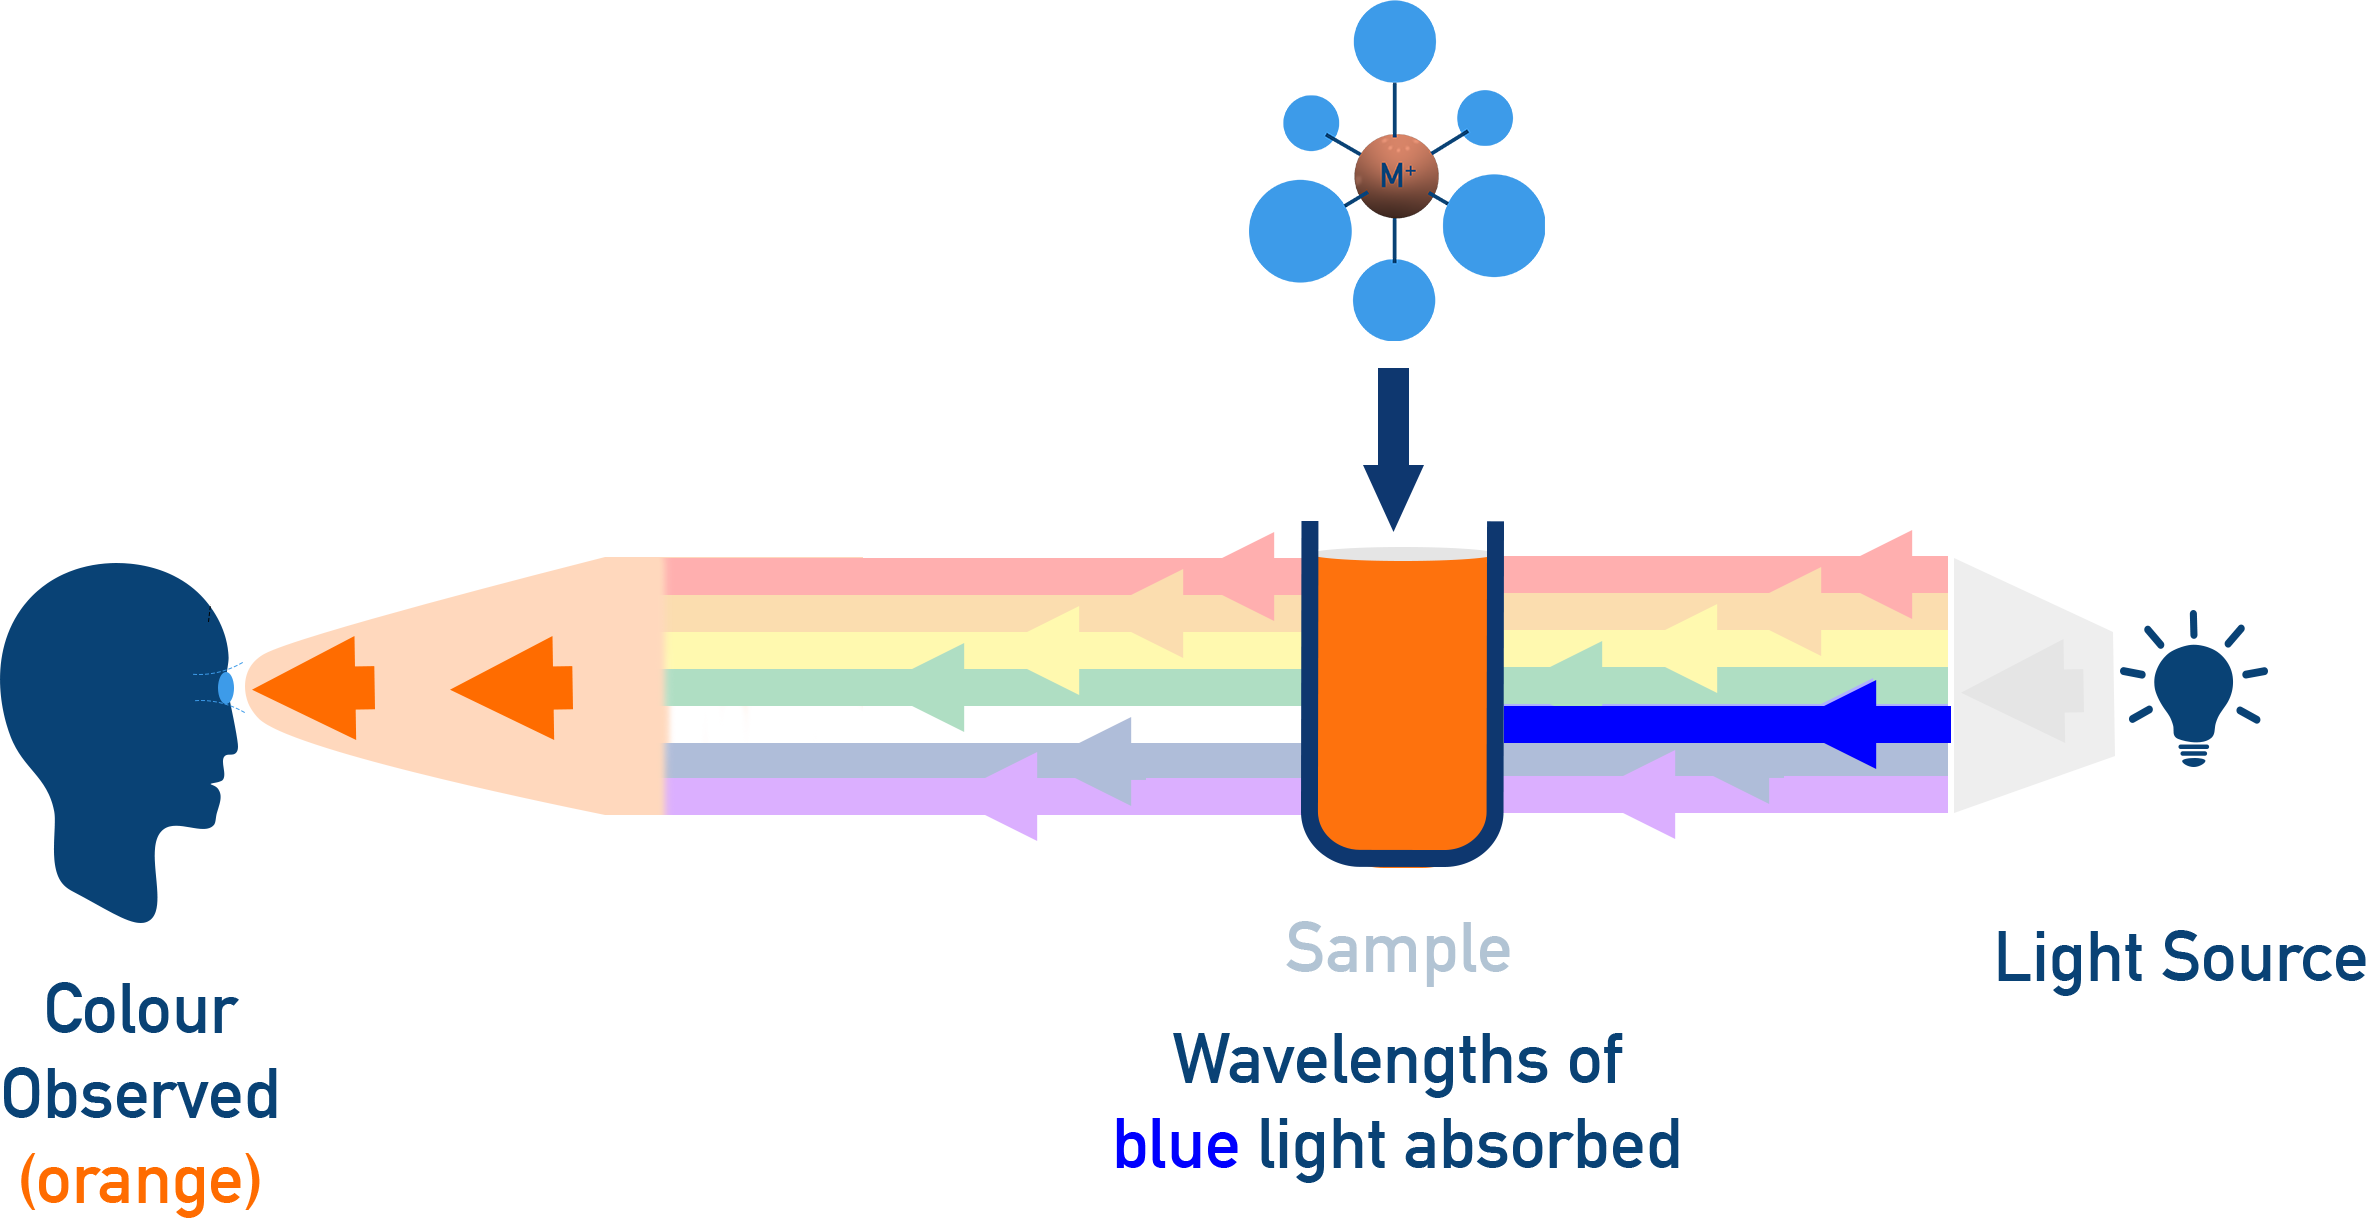
Absorbed vs Observed Colour
The observed colour is the complementary colour of the absorbed colour. A colour wheel can be used to determine this relationship:
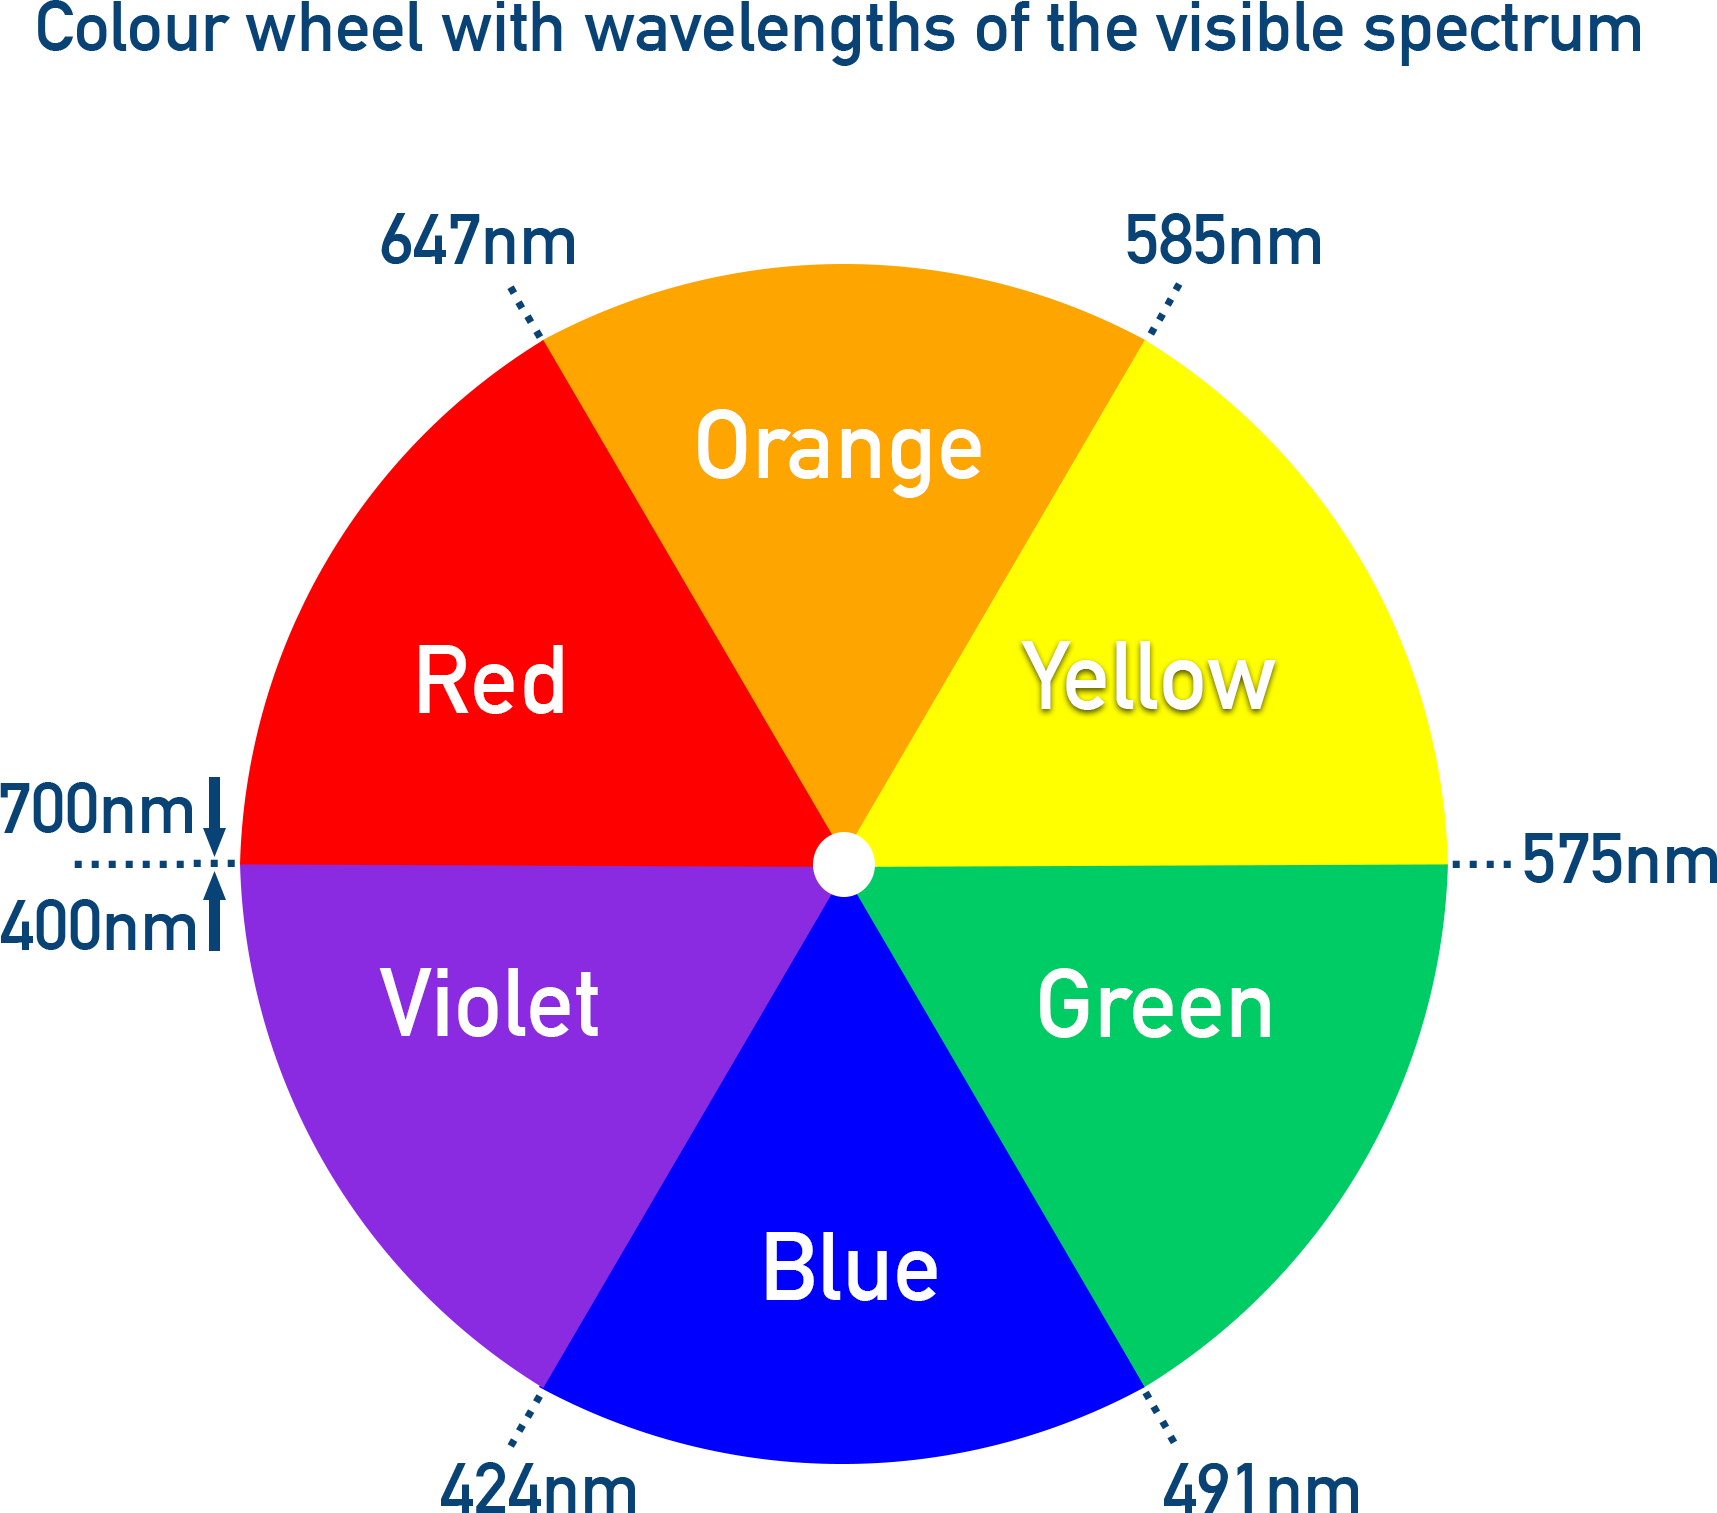
Example If a complex absorbs light in the red region (~650 nm), it will appear green.
| Absorbed Colour | Observed Colour |
|---|---|
| Red | Green |
| Orange | Blue |
| Yellow | Violet |
| Green | Red |
| Blue | Orange |
| Violet | Yellow |
Factors Affecting the Colour
- Identity of metal ion – different ions have different d-electron configurations.
- Oxidation state – affects the splitting of d-orbitals.
- Nature of ligands – different ligands cause different amounts of splitting (ligand field strength).
- Geometry of complex – affects the exact splitting pattern (though not required in detail for IB).
Calculating Wavelength or Frequency
We can calculate wavelength or frequency of light absorbed using the relationship:
c = λ × f
- c = speed of light = 3.00 × 10⁸ m/s
- λ = wavelength (in metres)
- f = frequency (in Hz)
To find frequency: f = c / λ
To find wavelength: λ = c / f
Summary
- Colour arises from d-d electron transitions in split d-orbitals.
- The wavelength of light absorbed corresponds to the energy gap between split d-levels.
- The complementary colour is observed.
- Use the colour wheel and c = λ × f to deduce relationships.
Linked Course Questions
What is the nature of the reaction between transition element ions and ligands in forming complex ions?
Transition metal ions form complex ions by accepting lone pairs of electrons from ligands, which act as Lewis bases. This is a coordinate (dative covalent) bonding process, where ligands donate electron pairs to the empty orbitals of the metal ion, forming stable complexes.
How can colorimetry or spectrophotometry be used to calculate the concentration of a solution of coloured ions?
Colorimetry and spectrophotometry measure how much light a solution absorbs at a specific wavelength. The absorbance is directly related to the concentration of coloured ions, following Beer–Lambert Law. By comparing the absorbance of an unknown sample to a calibration curve of known concentrations, the concentration of the solution can be determined.