
Mass Spectrometry (MS) of Organic Compounds HL Only
Quick Notes
- Mass spectrometry (MS) identifies compounds based on mass-to-charge ratio (m/z) of fragments.
- The molecular ion peak (M+) corresponds to the Mr (relative molecular mass) of the compound.
- Fragmentation occurs when bonds break, forming smaller ions.
- We can use specific fragment masses (given in the data booklet) to deduce structural features.
Full Notes
The Basics of Mass Spectrometry
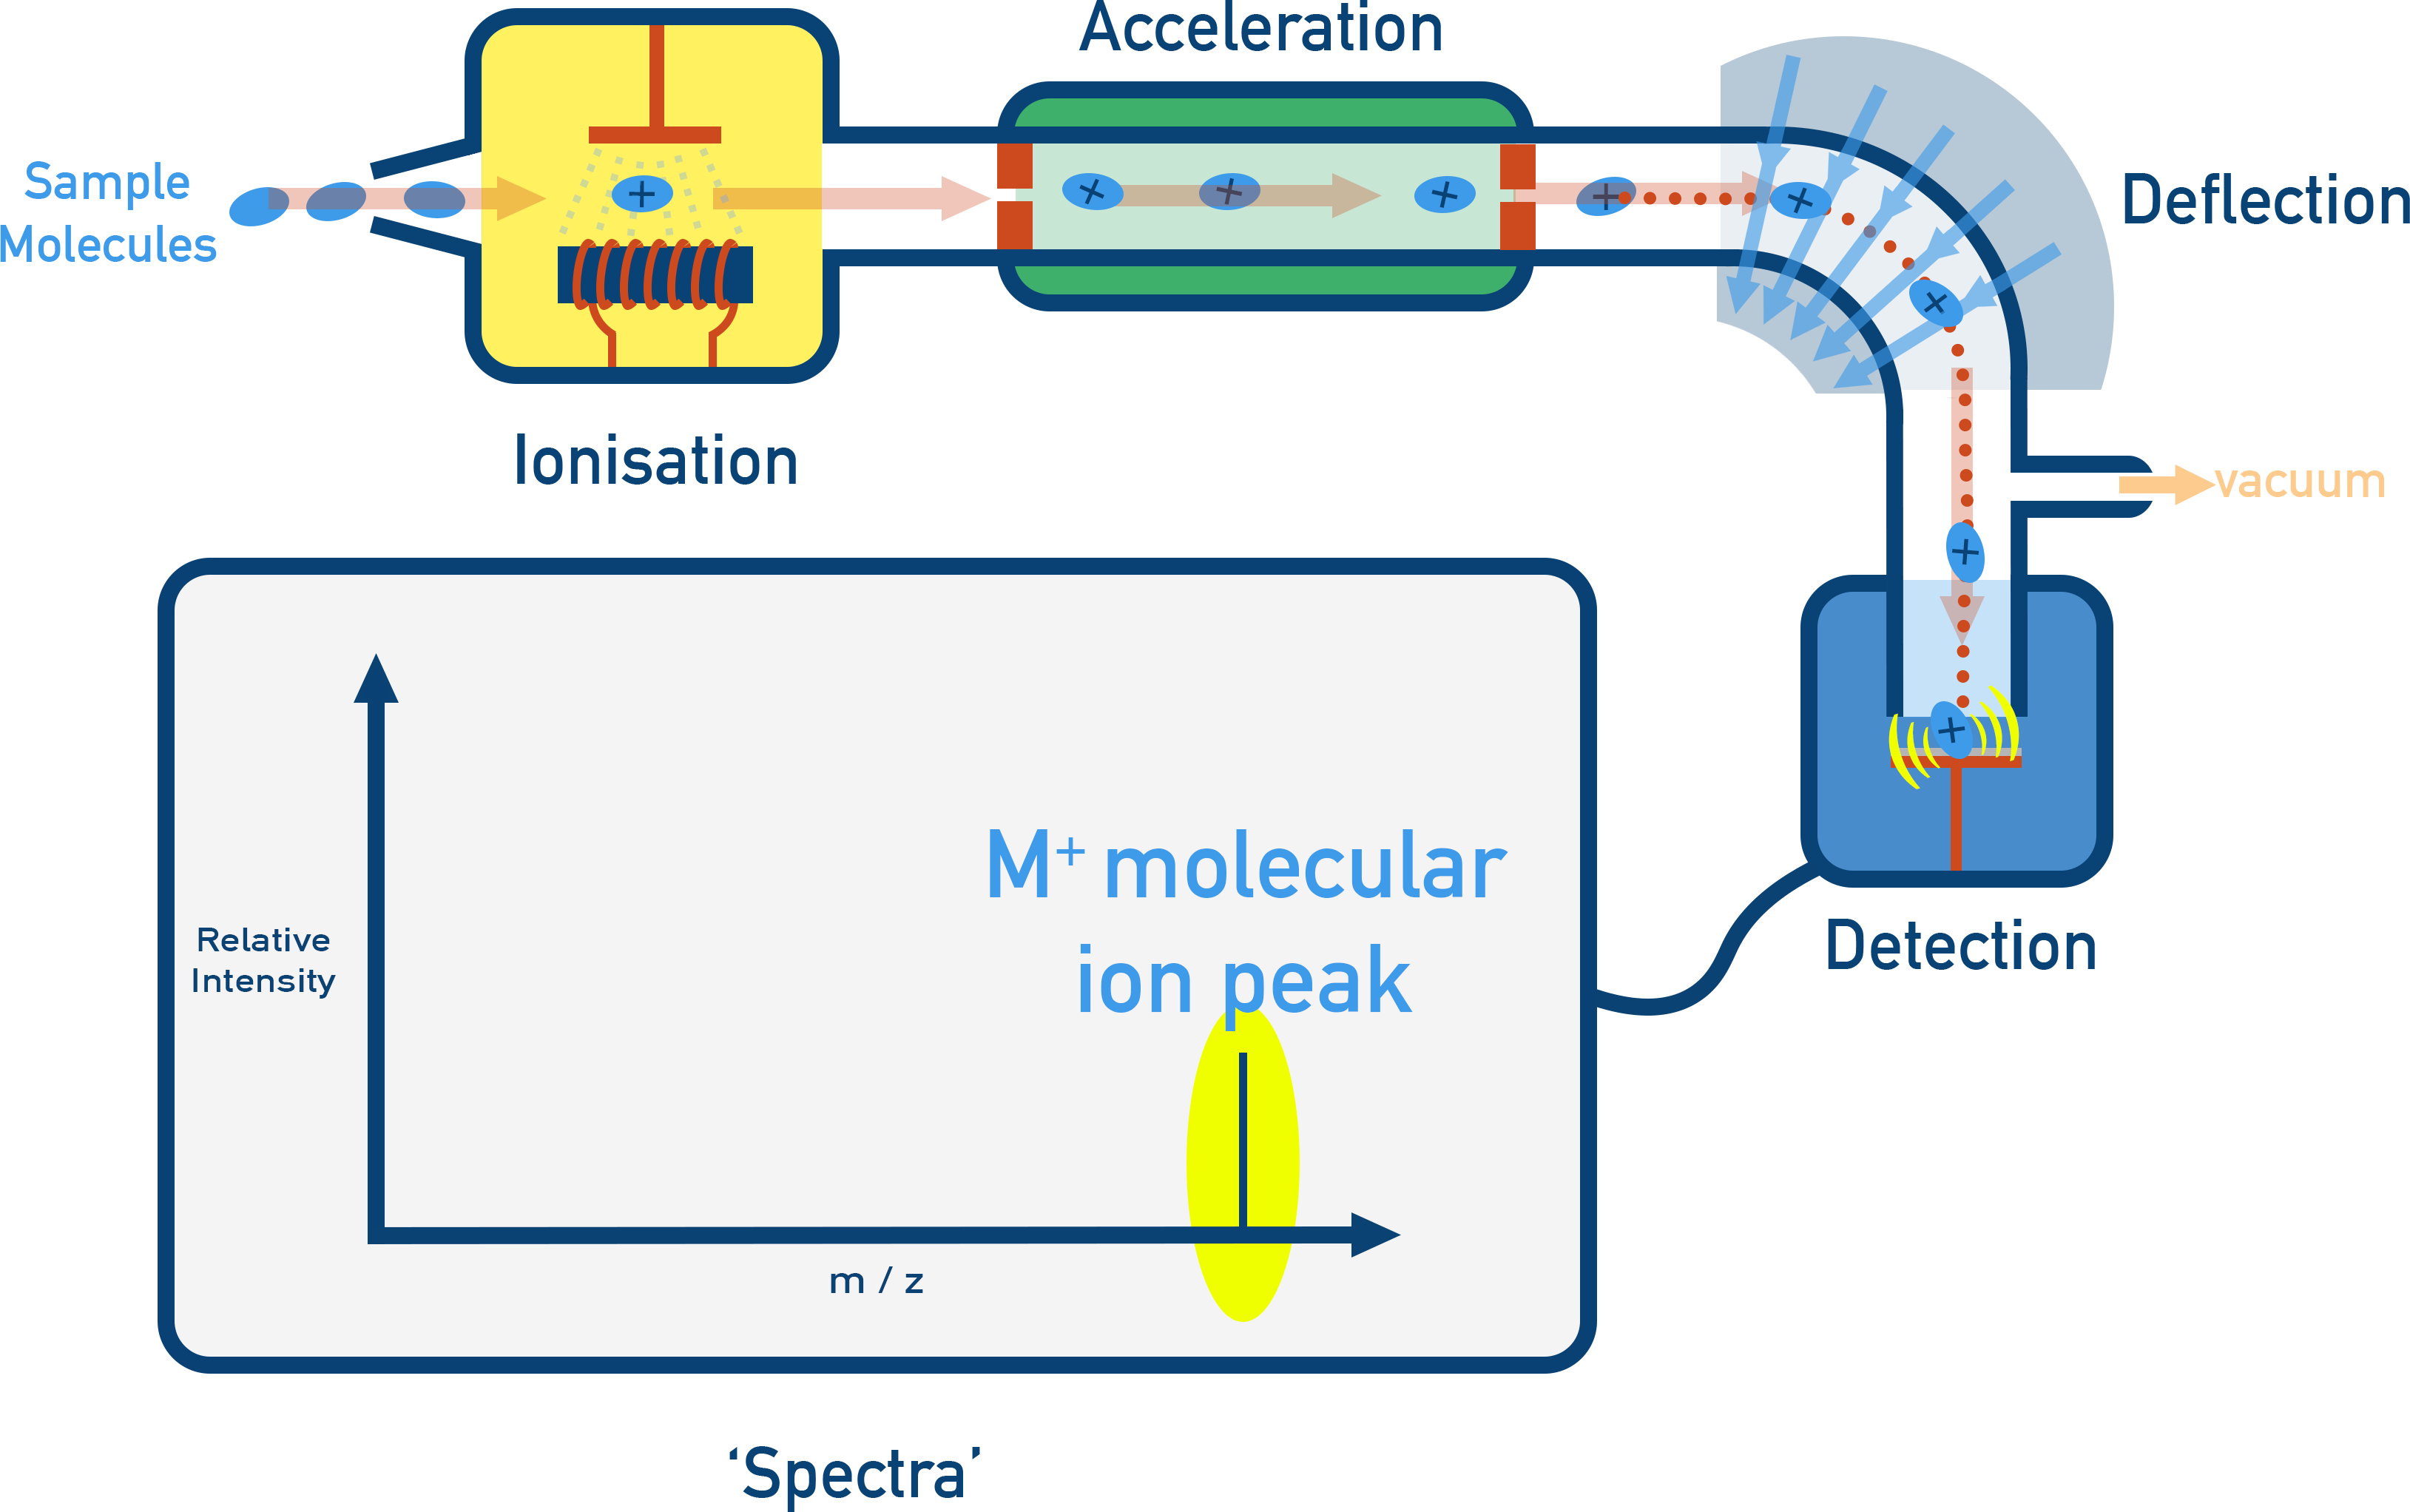
- A sample is ionised to form positive ions.
- Ions are accelerated and separated based on their mass-to-charge ratio (m/z).
- The detector records the ions, producing a mass spectrum.
- The molecular ion peak (M+) represents the relative molecular mass (Mr) of the compound.
Identifying Molecular Mass and Formula
The molecular ion peak (M+) has the highest m/z value on a spectra (peak furthest to the right).
We can use precise atomic masses to confirm the molecular formula based on the M+ peak.
For Example Determining the molecular formula of a compound with an M+ = 58.12

Fragmentation
Inside the mass spectrometer, molecular ions can break into fragments. Each fragment forms a smaller ion and shows up as a peak at a lower m/z.
These peaks help identify parts of the molecule.
Example Hydrocarbons A and B
Hydrocarbons A and B both have a molecular formula of C4H10 (same molecular ion peak), however they have different fragment patterns in their spectra, showing different structures.
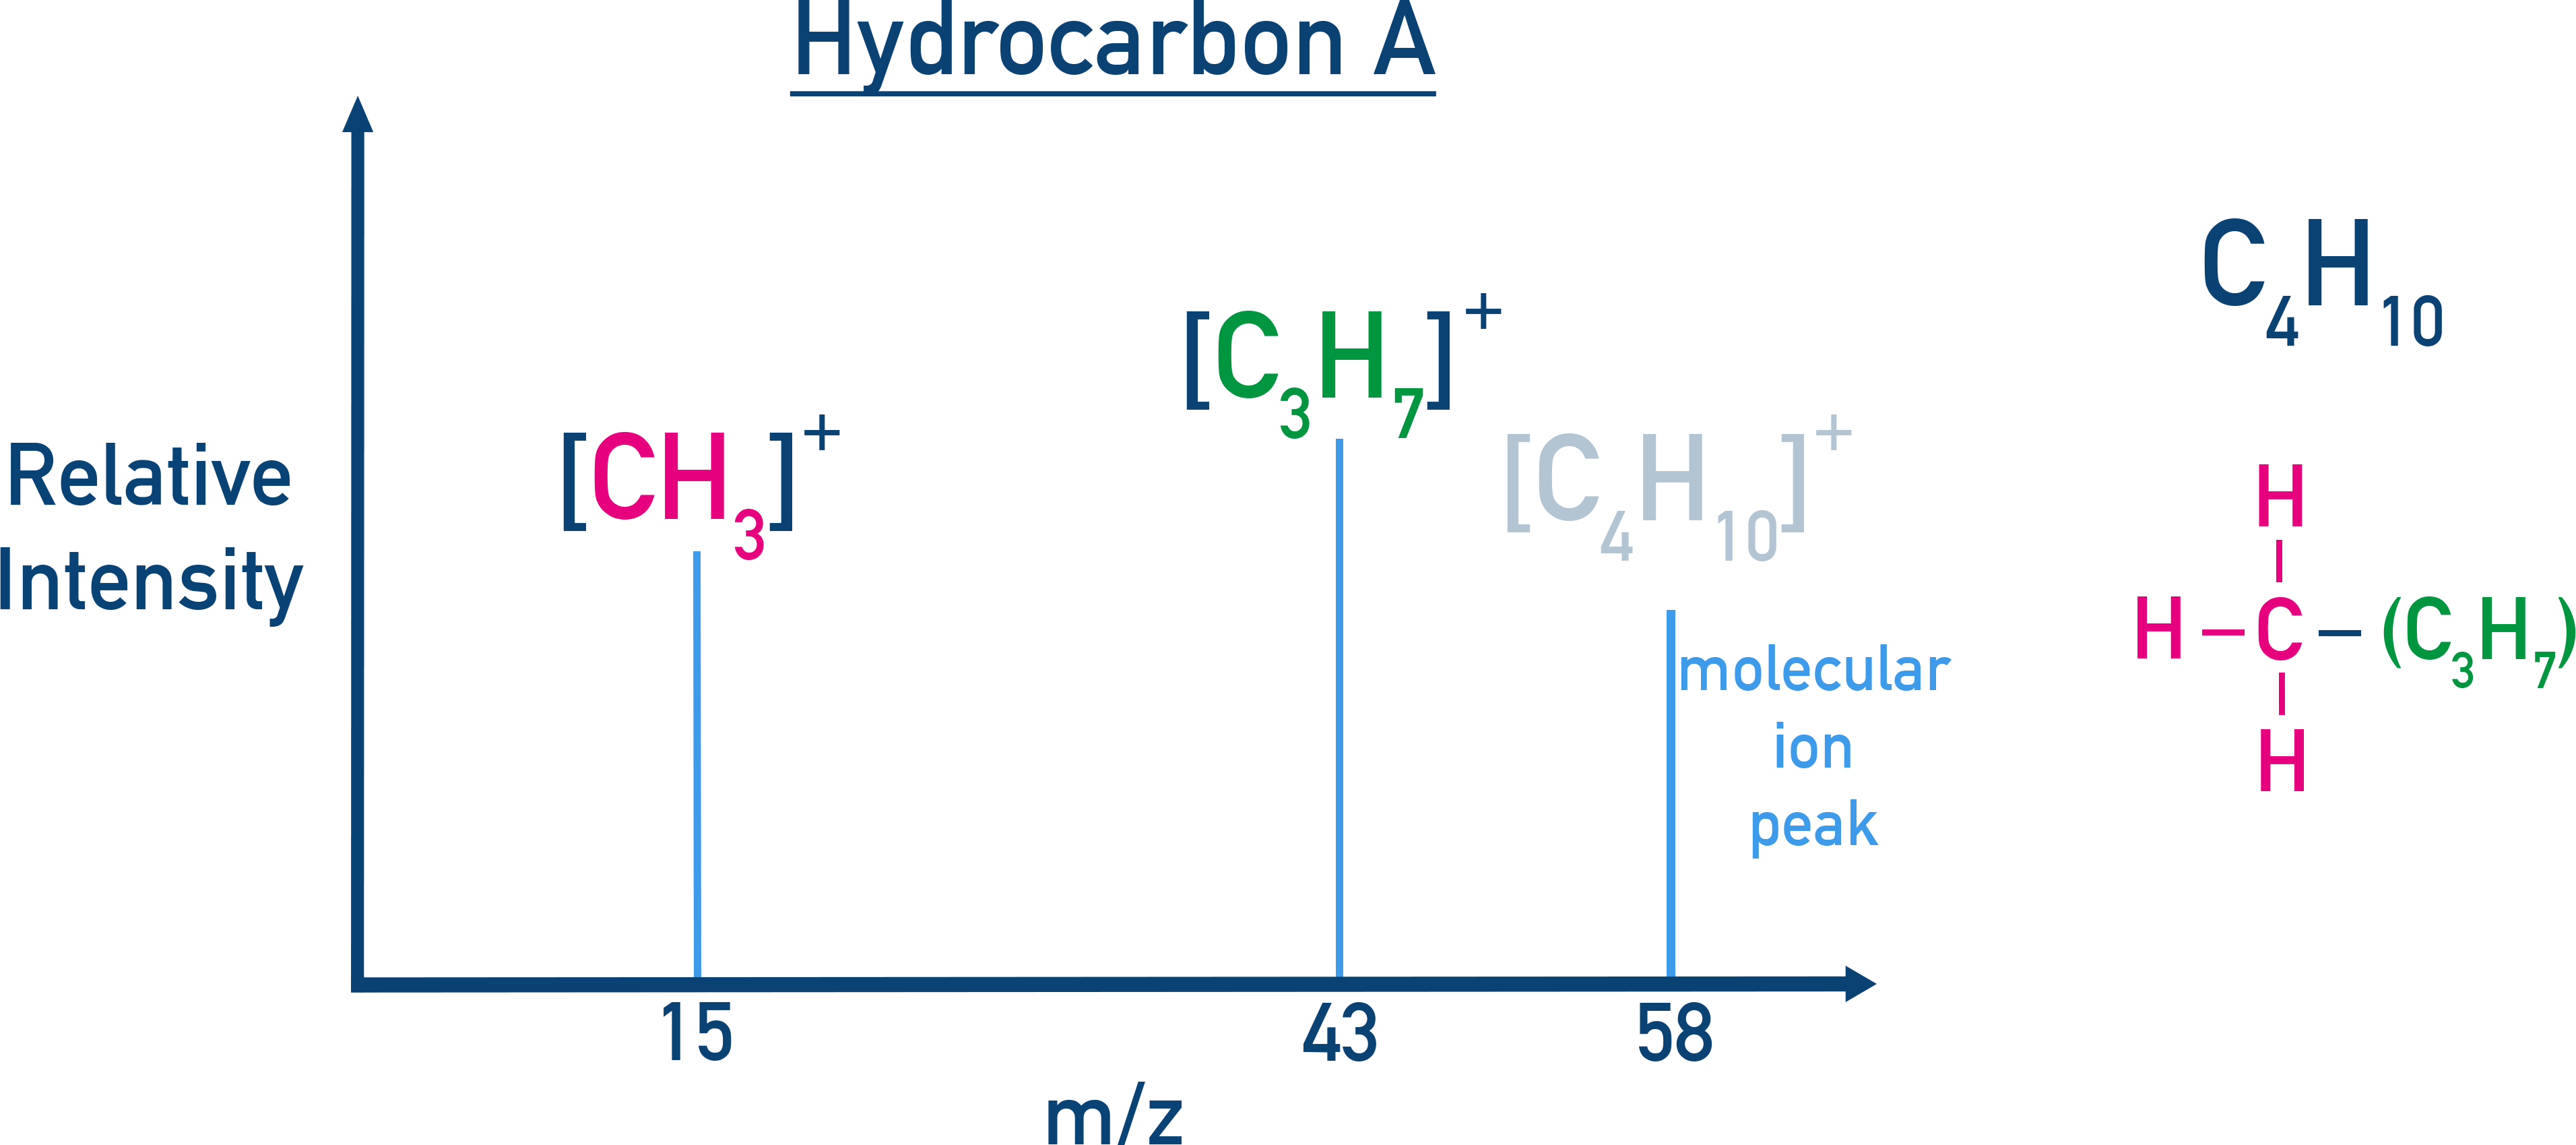
Fragment peaks at 15 and 43 show a CH3 fragment and C3H7 fragment. However, no fragment at 29 means no C2H5 group. This means the likely possible structure is CH3CH(CH3)CH3.
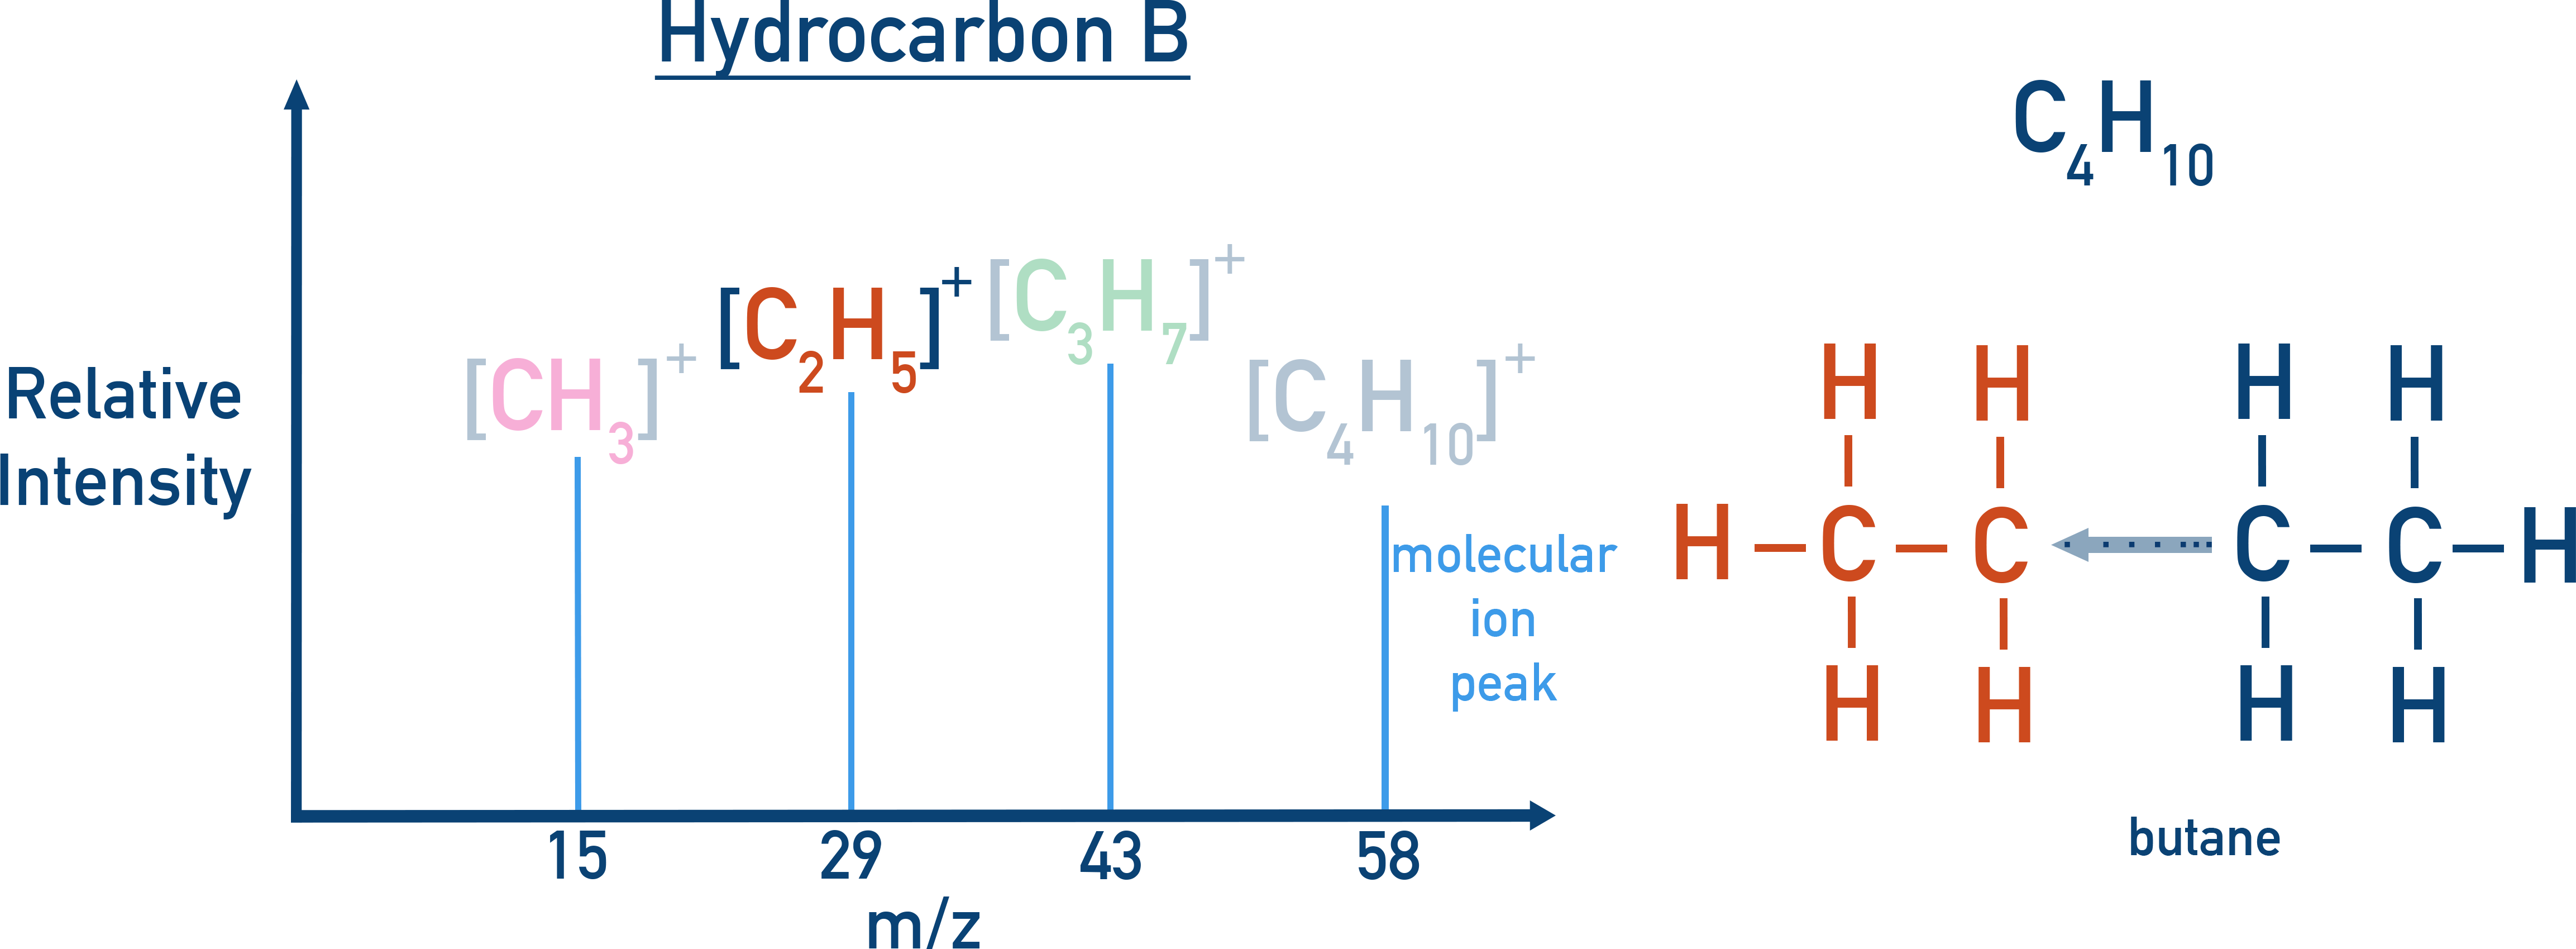
The extra peak at m/z 29 for Hydrocarbon B means it has a C2H5 group in its structure (as well as a CH3 and C3H7 group). This would indicate CH3CH2CH2CH3 as its structure.
Example Fragmentation Patterns
Certain functional groups and bond types break in characteristic ways.
Examples of useful fragments (data booklet values):
| Fragment | m/z | Common in |
|---|---|---|
| CH3+ | 15 | Alkanes, methyl groups |
| C2H5+ | 29 | Alkanes |
| OH+ / H2O+ | 17 / 18 | Alcohols |
| COO+ | 45 | Carboxylic acids |
| C6H5+ (phenyl) | 77 | Aromatic compounds |
Summary
- Mass spectra provides a structural fingerprint of a compound.
- The molecular ion peak shows the Mr.
- Fragment peaks reveal parts of the structure.
- Match peaks to known fragment m/z values in the IB data booklet.
- Essential for structure elucidation in organic chemistry.