
Combining Spectral Data to Determine Structure HL Only
Quick Notes
- Organic structural analysis often requires combining data from several methods:
- Mass spectrometry (MS) = determines molecular mass and fragments
- Infrared (IR) spectroscopy = identifies functional groups via bond vibrations
- ¹H NMR spectroscopy = reveals hydrogen environments, chemical shifts, integration, and splitting patterns
- Combining techniques gives a complete picture of the molecule’s structure.
Full Notes
When analysing organic compounds, a range of techniques are often used to determine molecular structure.
Each technique gives partial information:
- MS tells you the molecular ion (M+) and fragments.
- IR tells you about the types of bonds (e.g. O–H, C=O).
- ¹H NMR tells you:
- How many different H environments there are
- The types of environments
- The relative number of Hs in each
- Neighbouring Hs through splitting patterns
Used together, these tools can help identify a compound and deduce its structure.

Focus on your working when analysing data for structure questions. Show clearly what each piece of data tells you before drawing the final structure. You can still earn good marks just by interpreting the data well.
Deducing Organic Structures
You should be able to use (and combine) data from the following techniques:
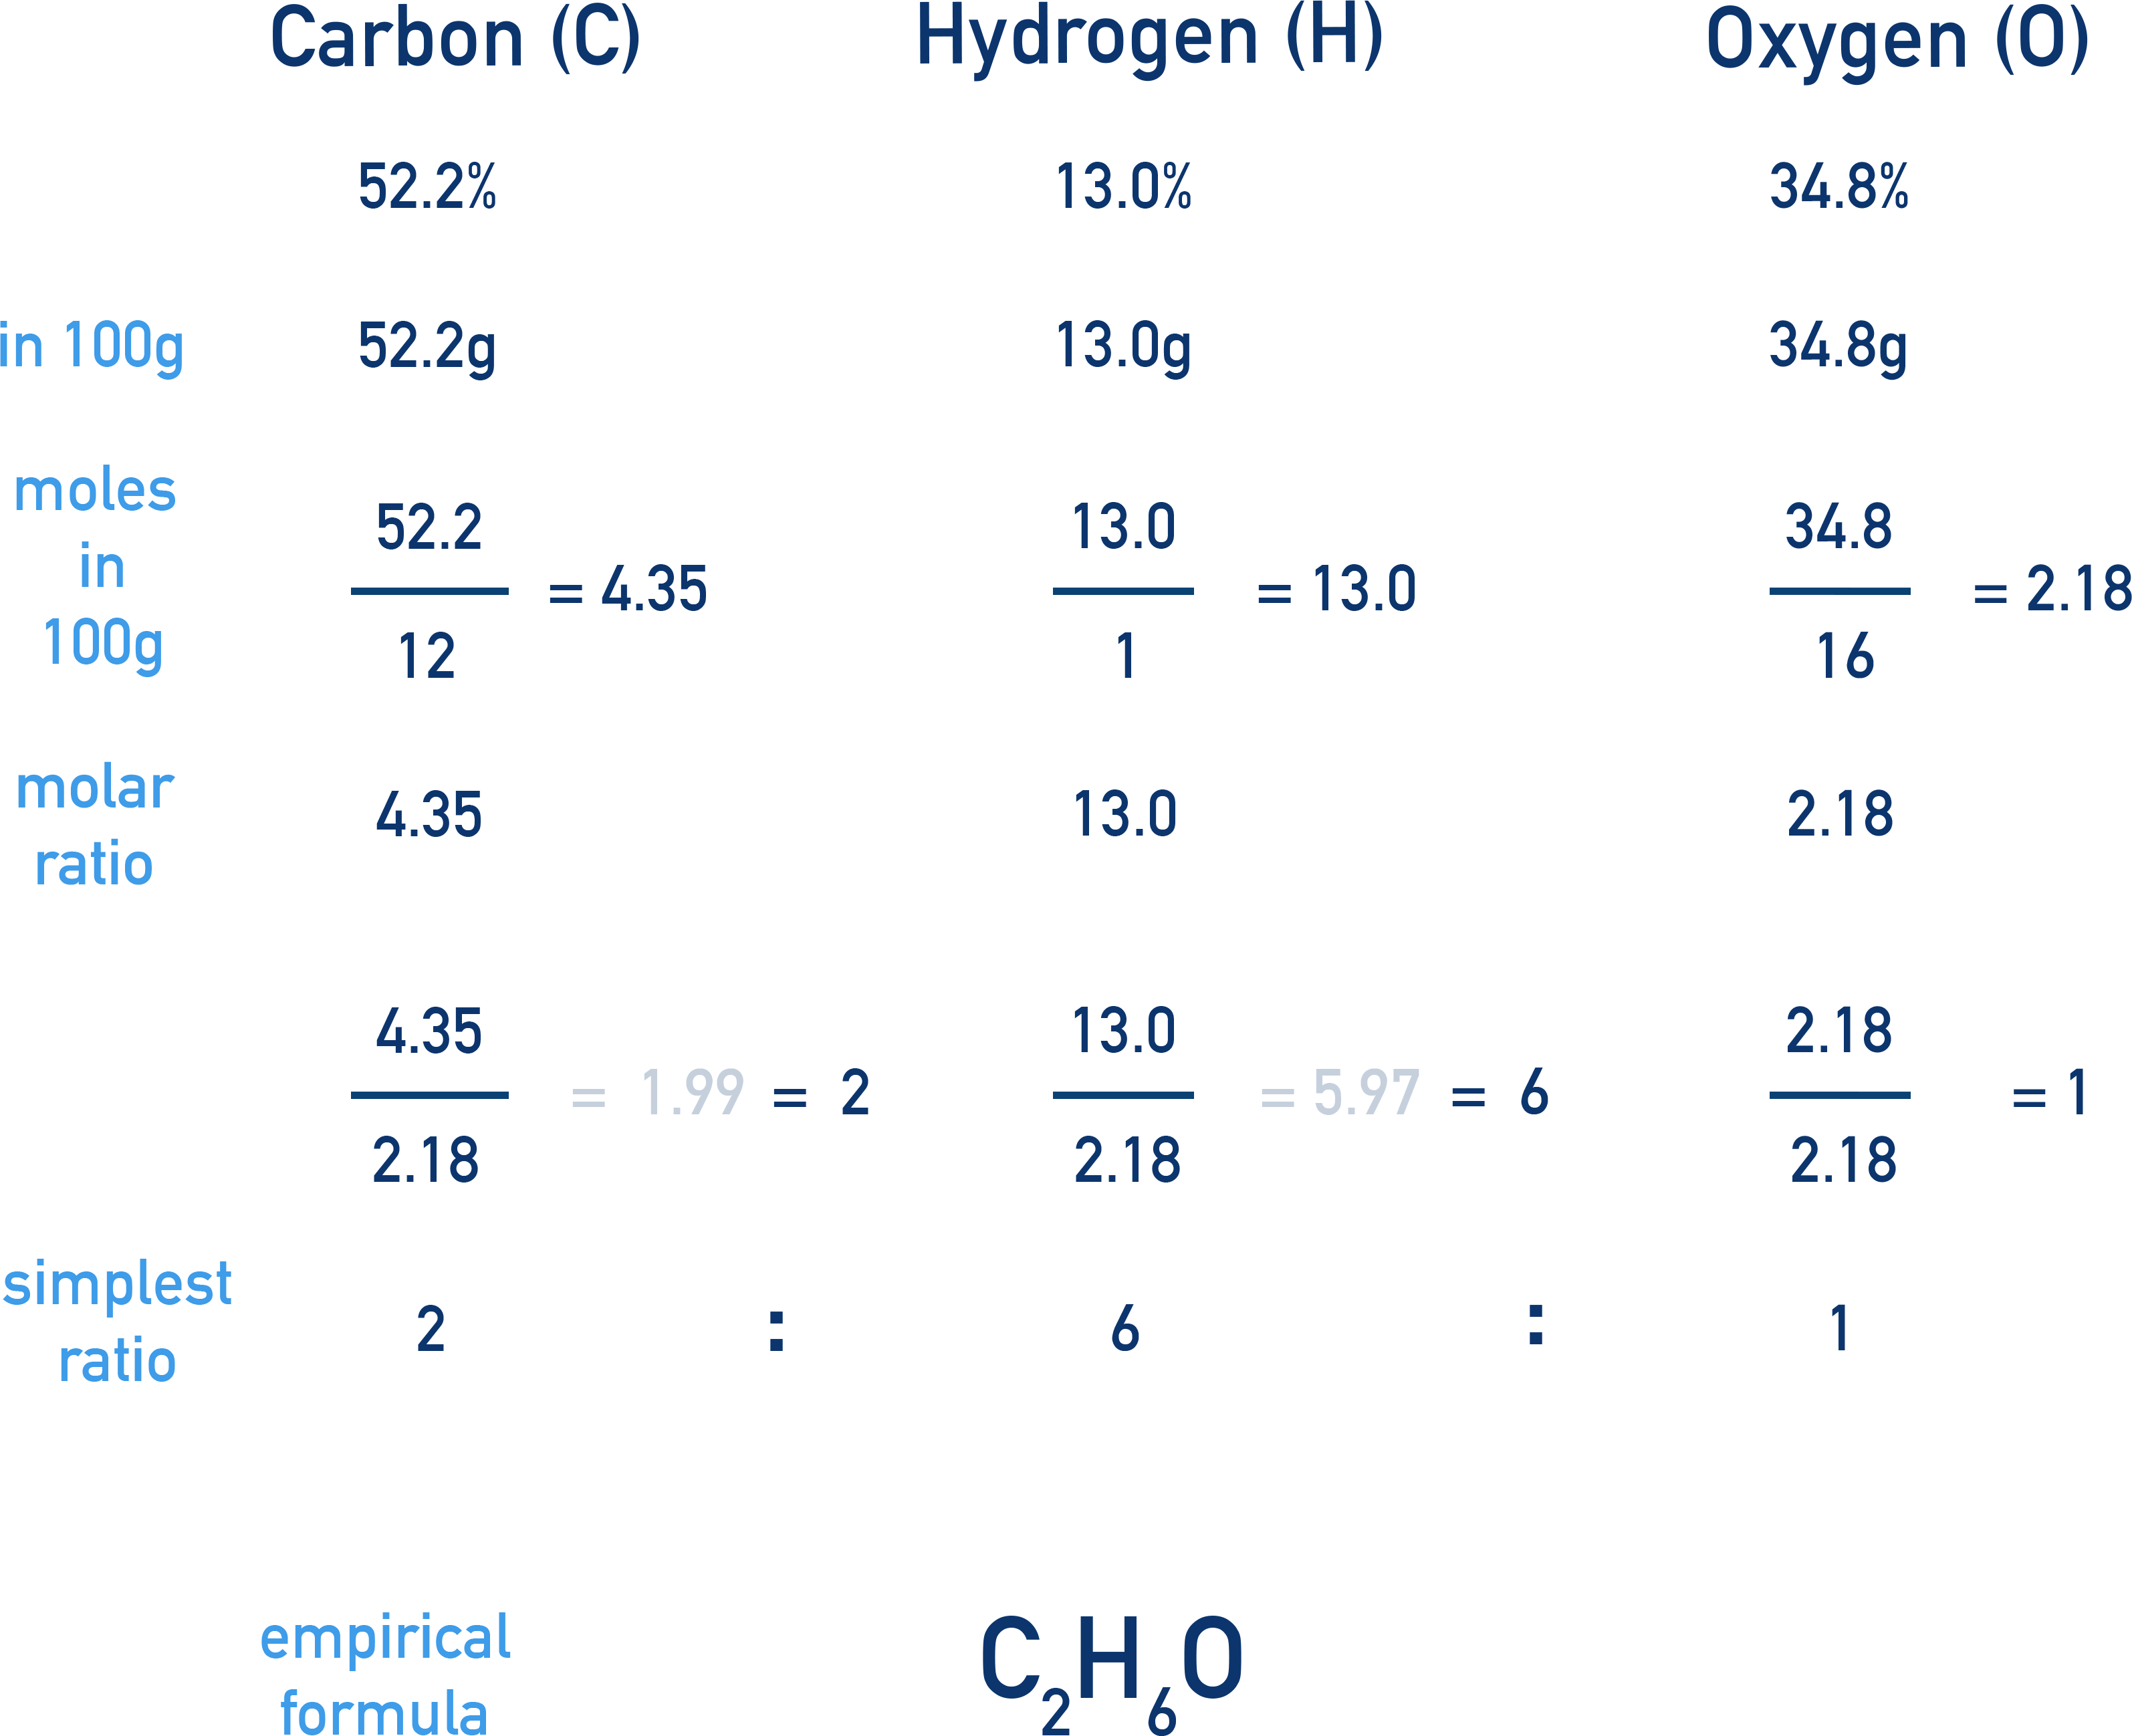
Elemental Analysis
Gives empirical formula.
Example Find the empirical formula for the compound with a composition by mass of C 52.2%, H 13.0% and O 34.8%
Mass Spectrometry
Determines molecular mass and possible fragments.
Example C4H10 isomers
Hydrocarbons A and B both have a molecular formula of C4H10 (same molecular ion peak at 58), however they have different fragment patterns in their spectra, showing different structures.
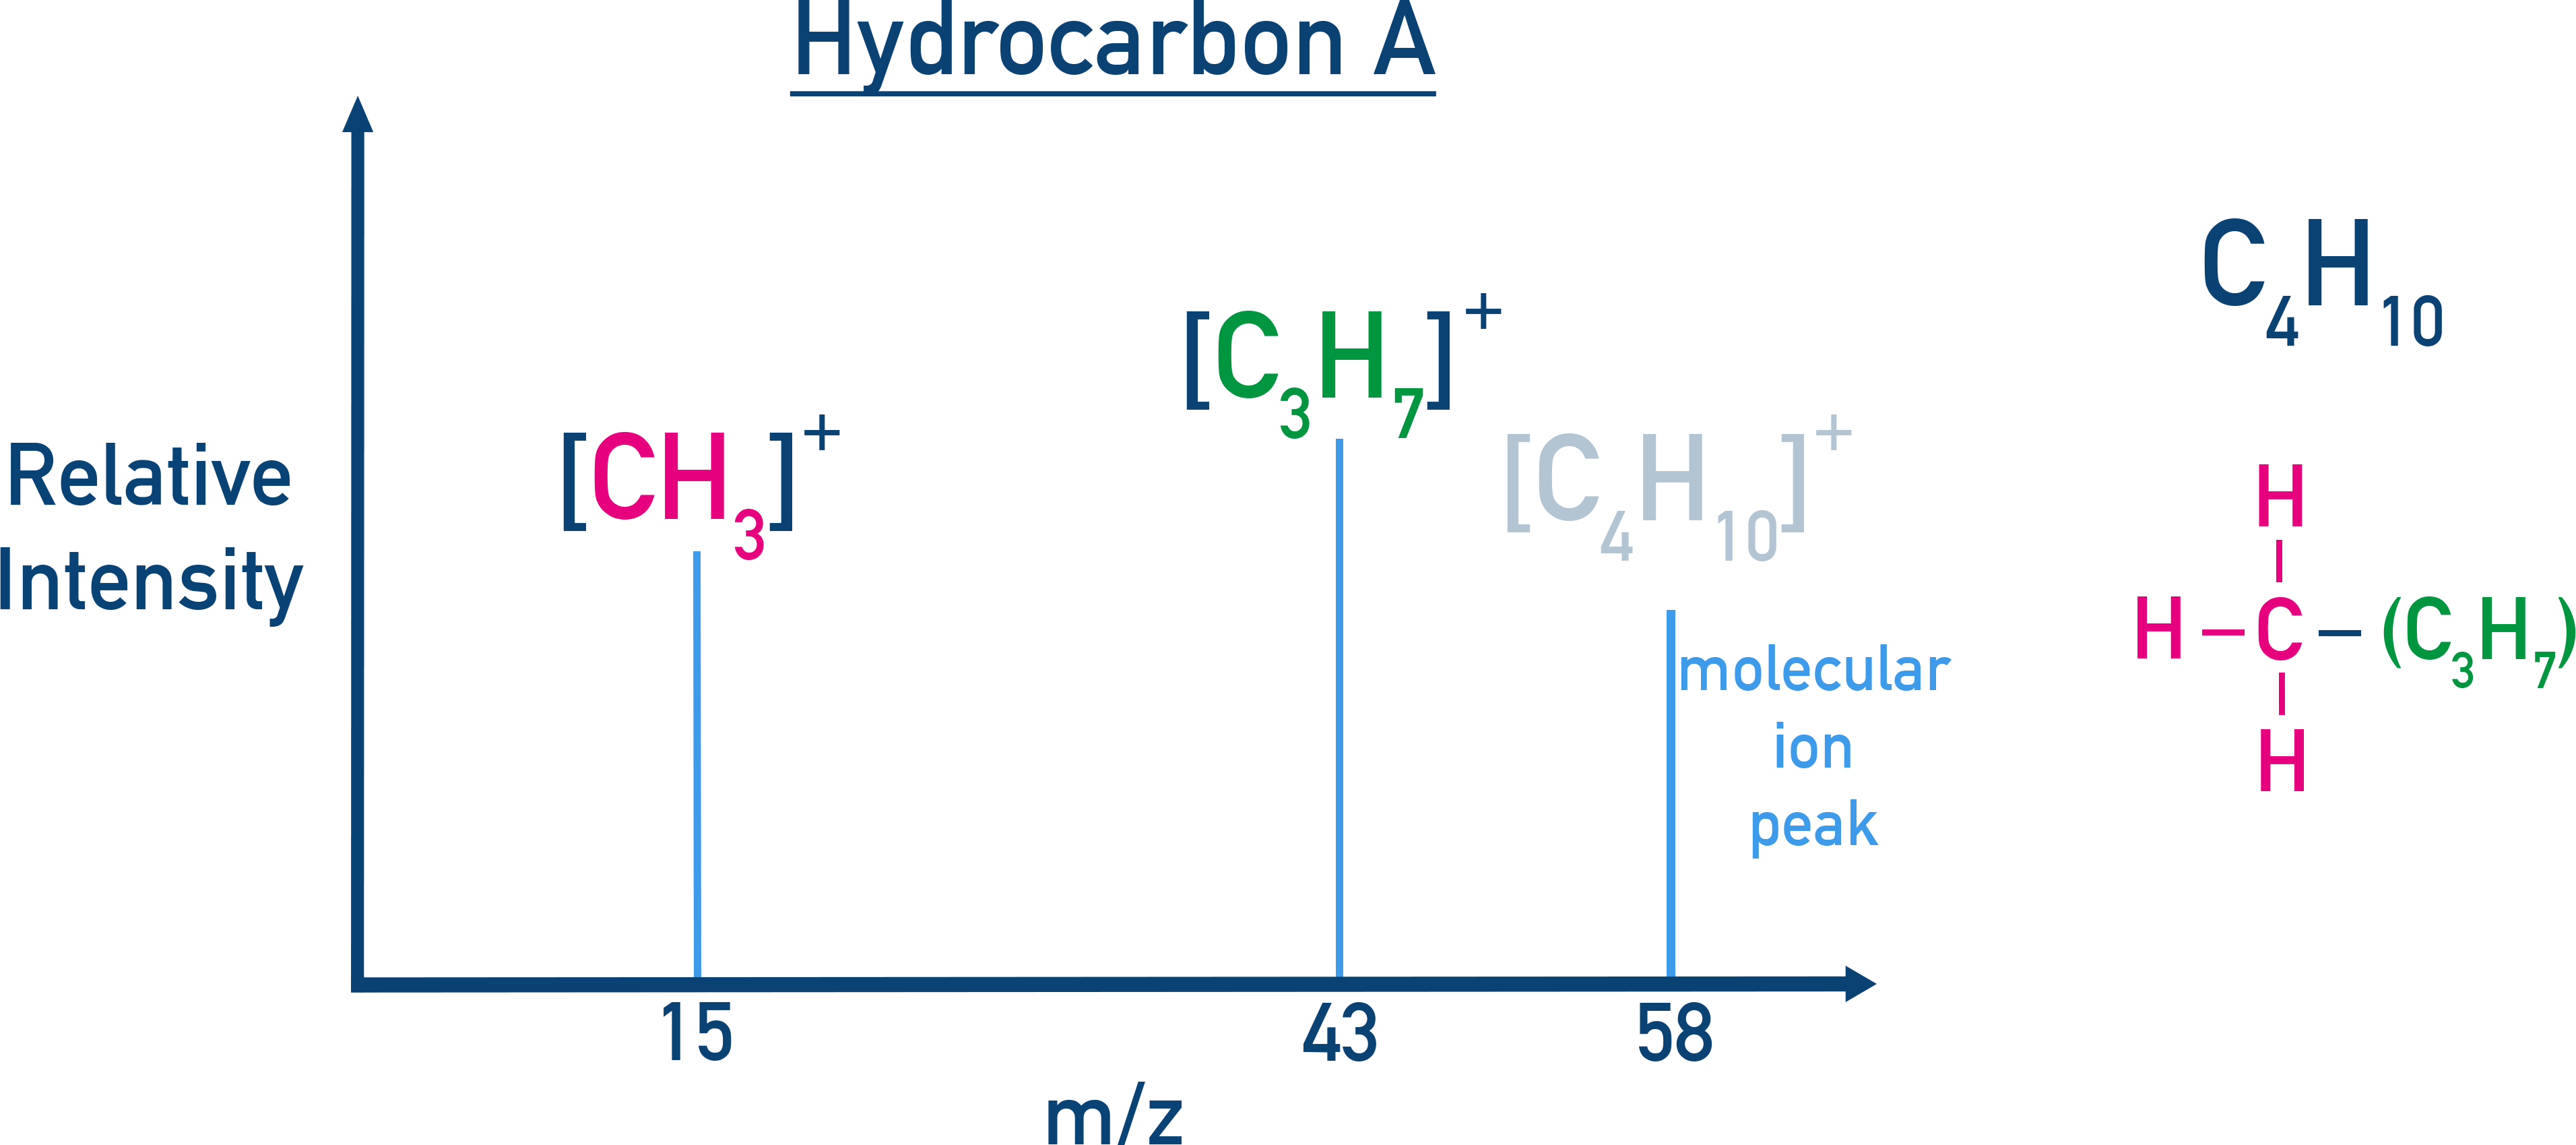
Fragment peaks at 15 and 43 show a CH3 fragment and C3H7 fragment. However, no fragment at 29 means no C2H5 group. This means the likely possible structure is CH3CH(CH3)CH3.
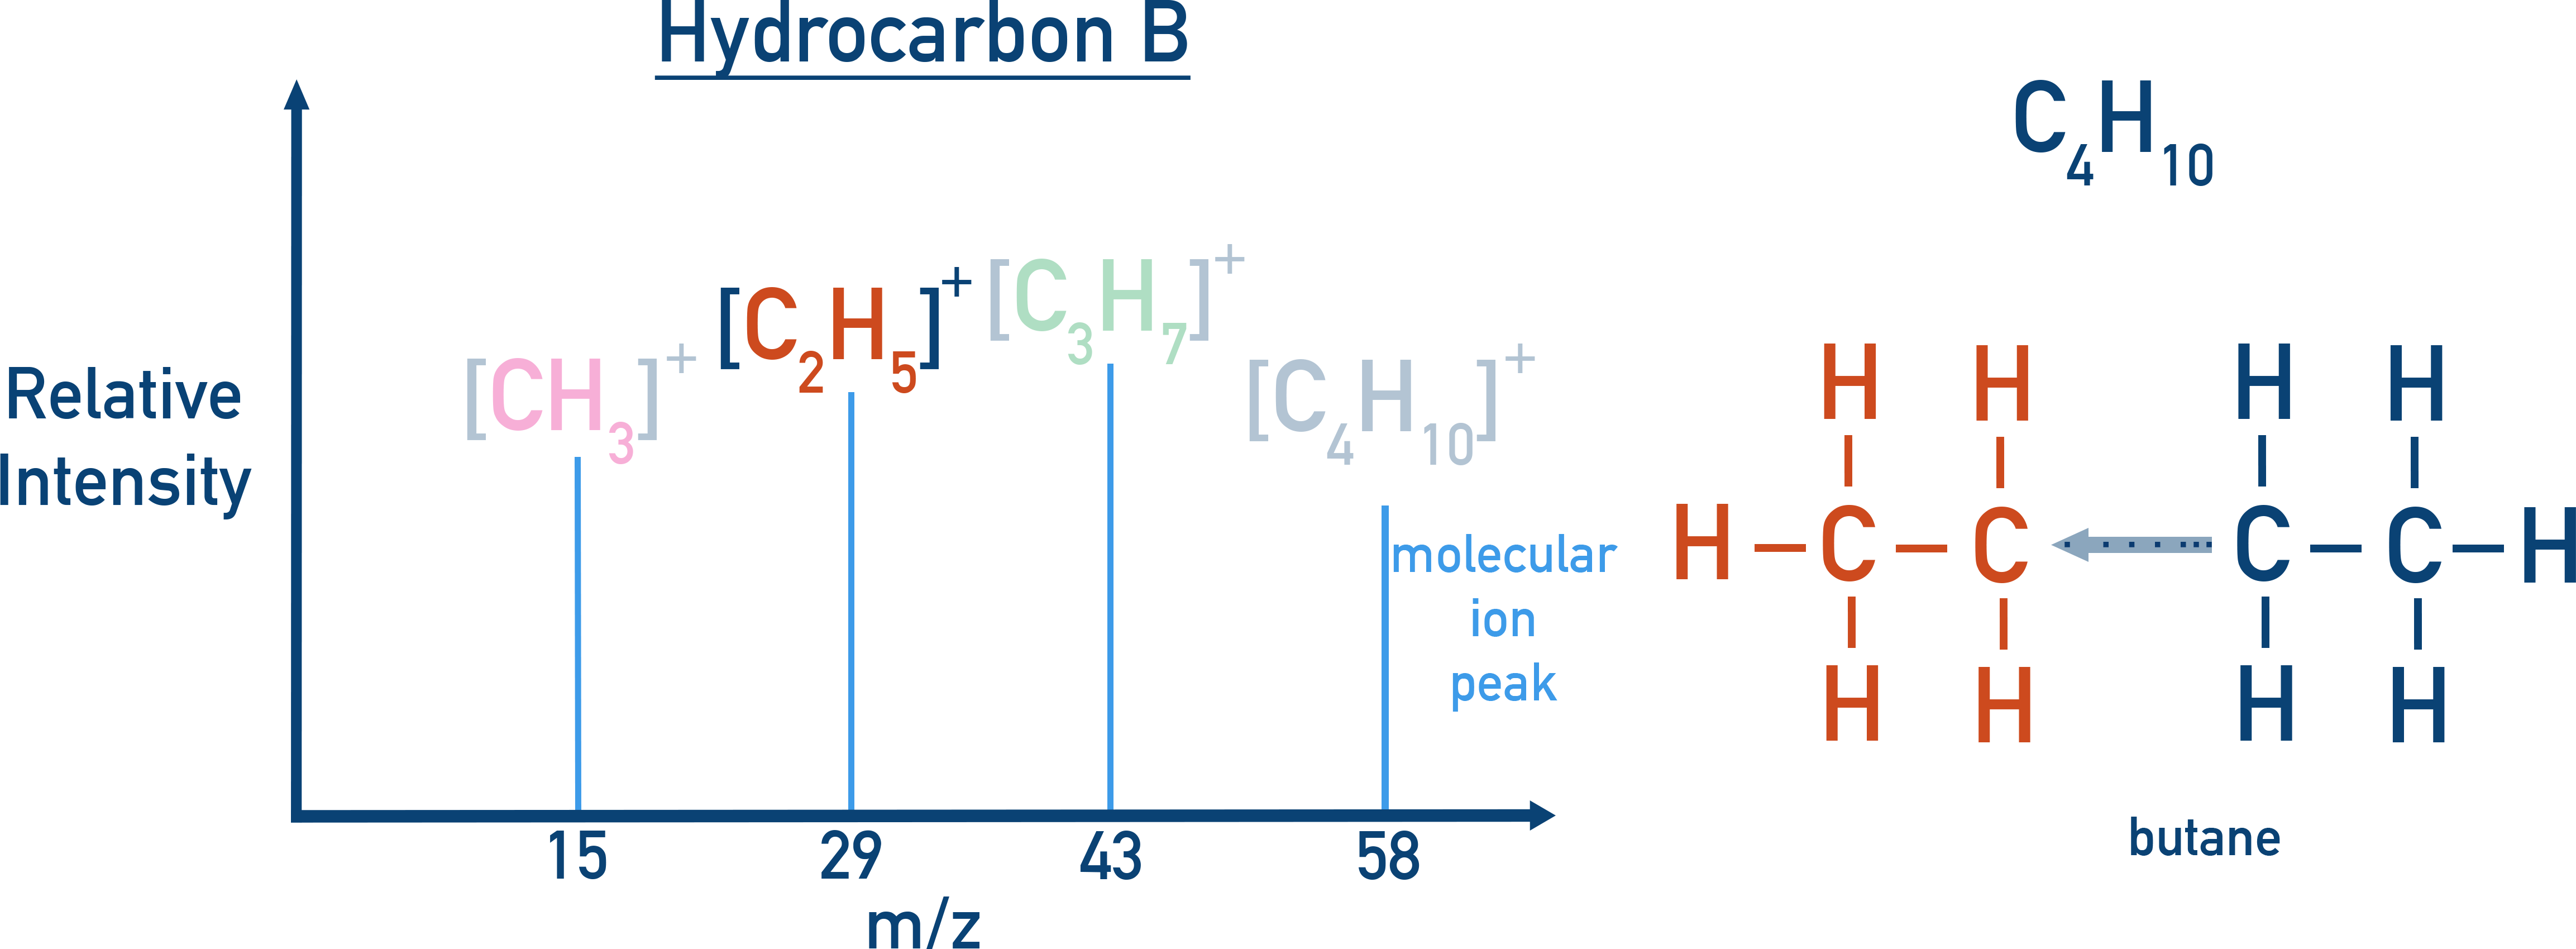
The extra peak at m/z 29 for Hydrocarbon B means it has a C2H5 group in its structure (as well as a CH3 and C3H7 group). This would indicate CH3CH2CH2CH3 as its structure.
IR Spectroscopy
Shows presence of functional groups:
- C=O: ~1700 cm⁻¹
- O–H (broad): ~3200–3600 cm⁻¹
Example Ethanoic acid (CH₃COOH)
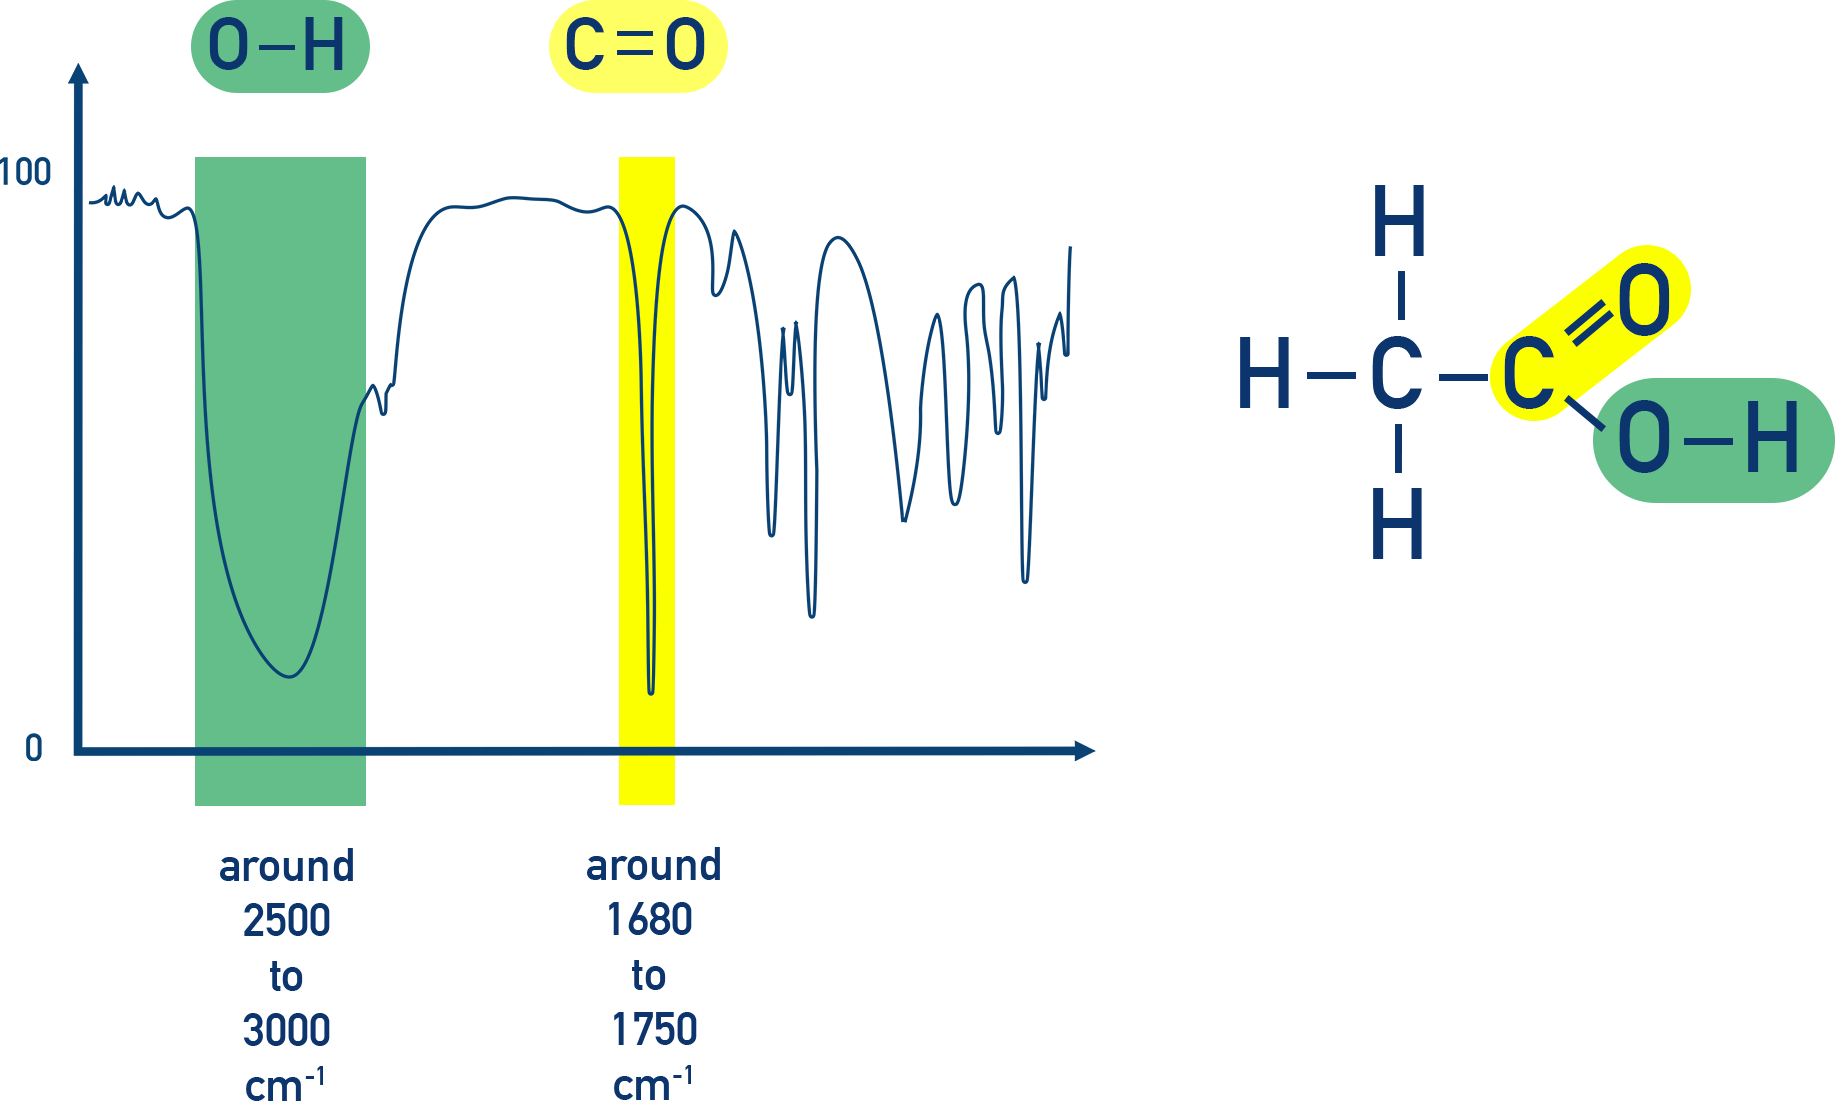
Ethanoic acid has two absorbances in its IR spectra that help identify it: one for the O–H bond (2500 to 3000) and one for the C=O bond (1680 to 1750).
NMR Spectroscopy
Provides detailed framework of molecule.
Example Ethanol (CH3CH2OH)
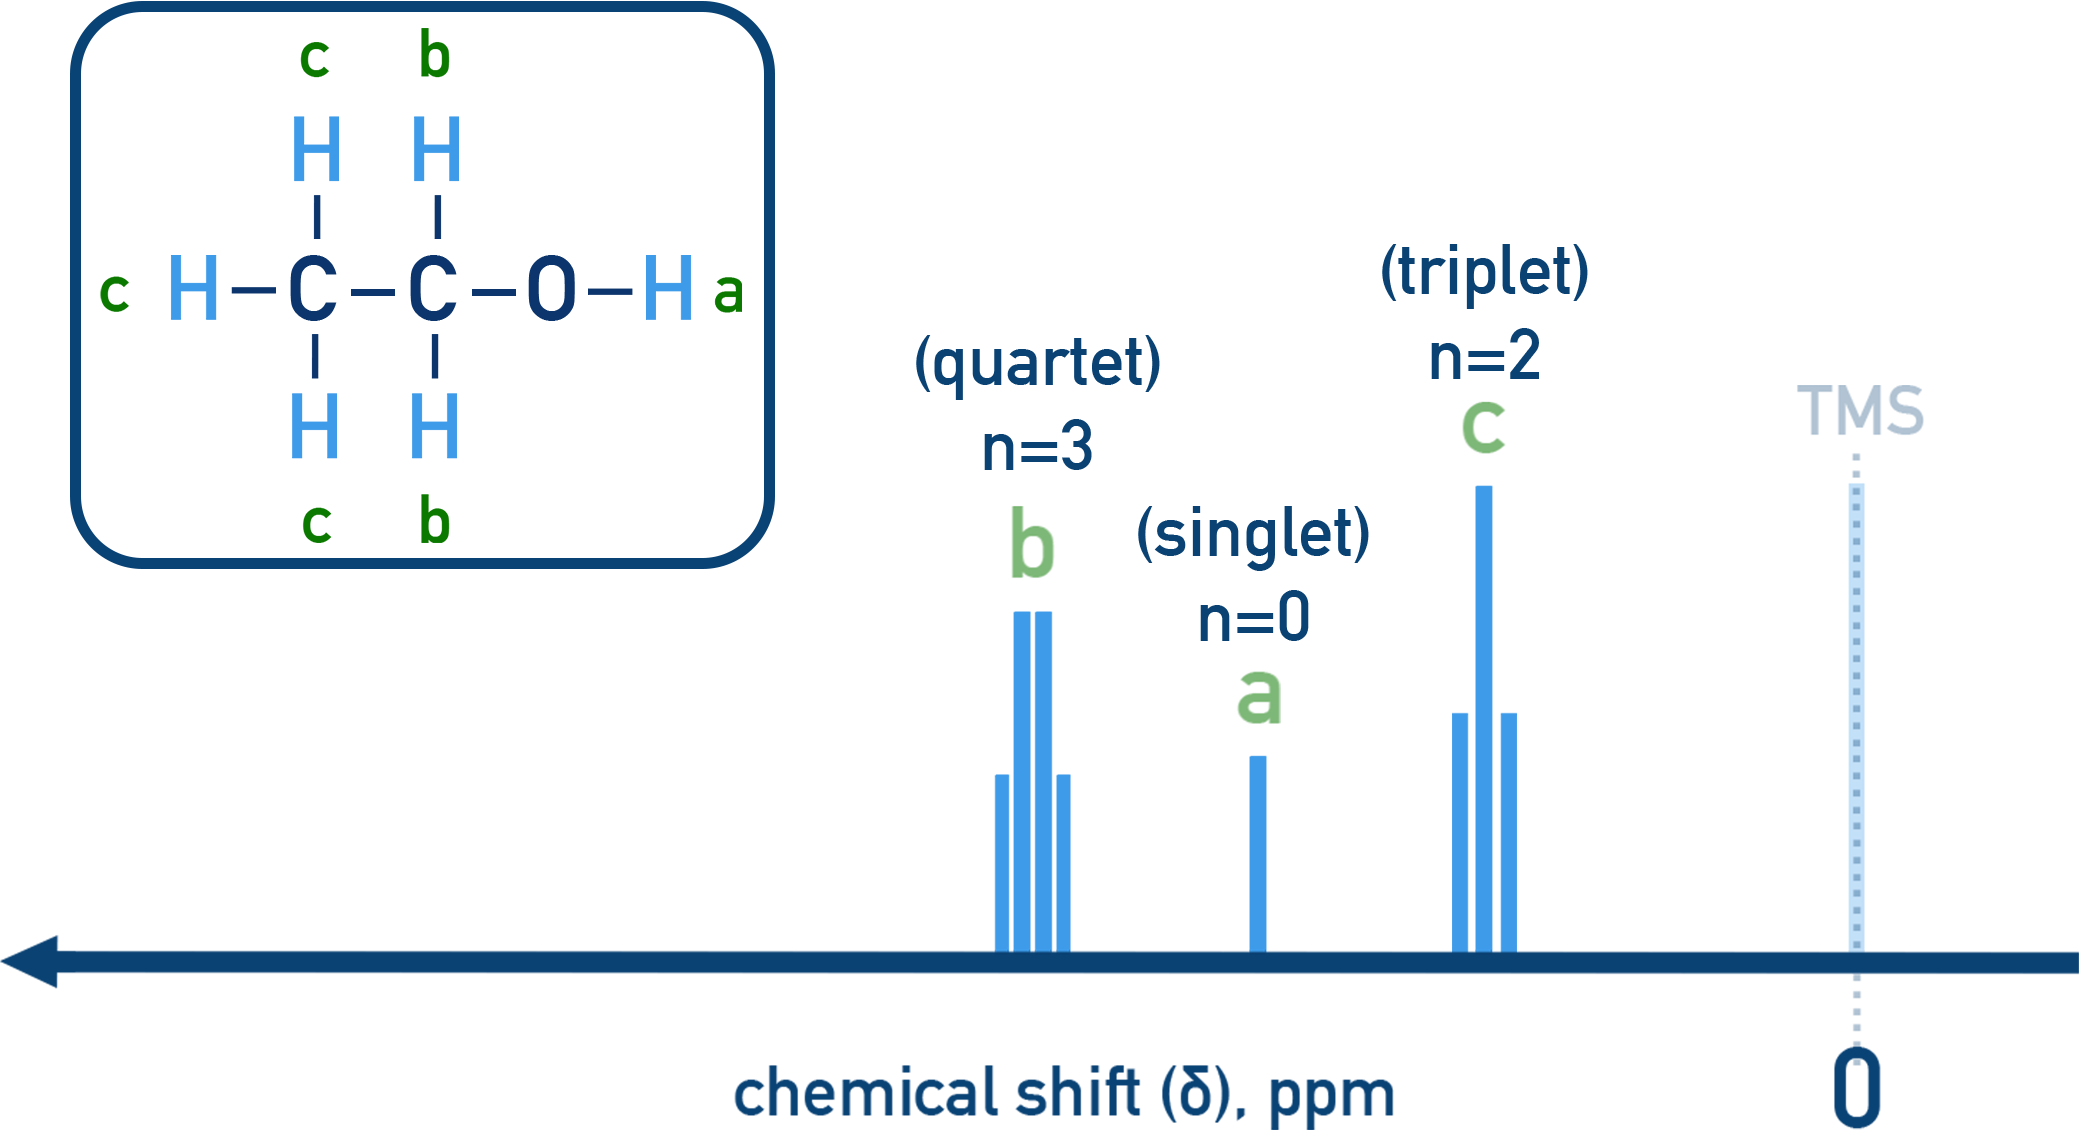
- 3 peaks in the ¹H NMR show 3 unique H environments
- CH3 group shows a triplet (next to CH2).
- CH2 group shows a quartet (next to CH3).
- OH appears as a singlet (no splitting).
Summary
- MS provides molecular mass and fragments.
- IR identifies functional groups via bond vibrations.
- ¹H NMR reveals hydrogen environments, shifts, integration and splitting.
- Combining these gives an accurate molecular structure.