
Proton NMR Spectroscopy (¹H NMR) HL Only
Quick Notes
- ¹H NMR detects different hydrogen (proton) environments in a molecule.
- Each signal (peak) represents a unique H environment.
- Chemical shift (δ) (in ppm) indicates the type of environment (e.g. alkyl, alcohol, aromatic).
- The area under each peak (integration trace) gives the relative number of protons in that environment.
- We can use the number of signals, chemical shift values, and relative areas to deduce a molecules structure.
Full Notes:
Note that peak splitting and the n+1 rule is covered in 3.2.11. This page is introducing the basics of H–NMR.
What Is ¹H NMR?
NMR (Nuclear Magnetic Resonance) Spectroscopy detects nuclei in a magnetic field.
¹H NMR is the most commonly used NMR technique. The hydrogen-1 atoms have a property called nuclear spin, which means they act like tiny magnets. When placed in a strong magnetic field, these tiny magnets can absorb energy and 'flip' their spin – this is called resonance. The amount of energy needed to do this depends on their chemical environment. Because of this, hydrogen-1 atoms in different environments absorb slightly different amounts of energy.
Chemical shift (δ) is used to describe this energy and is measured in parts per million (ppm) relative to TMS (δ = 0). Spectra are produced that show peaks at certain ppm.
Each peak refers to a unique hydrogen environment in the sample.
For H-NMR, samples must be dissolved in deuterated solvents (contain only isotopes ²H that don’t have an overall spin) or solvents that have no hydrogens in, such as tetrachloromethane (CCl₄). This ensures that the solvent doesn’t interfere with the spectra.

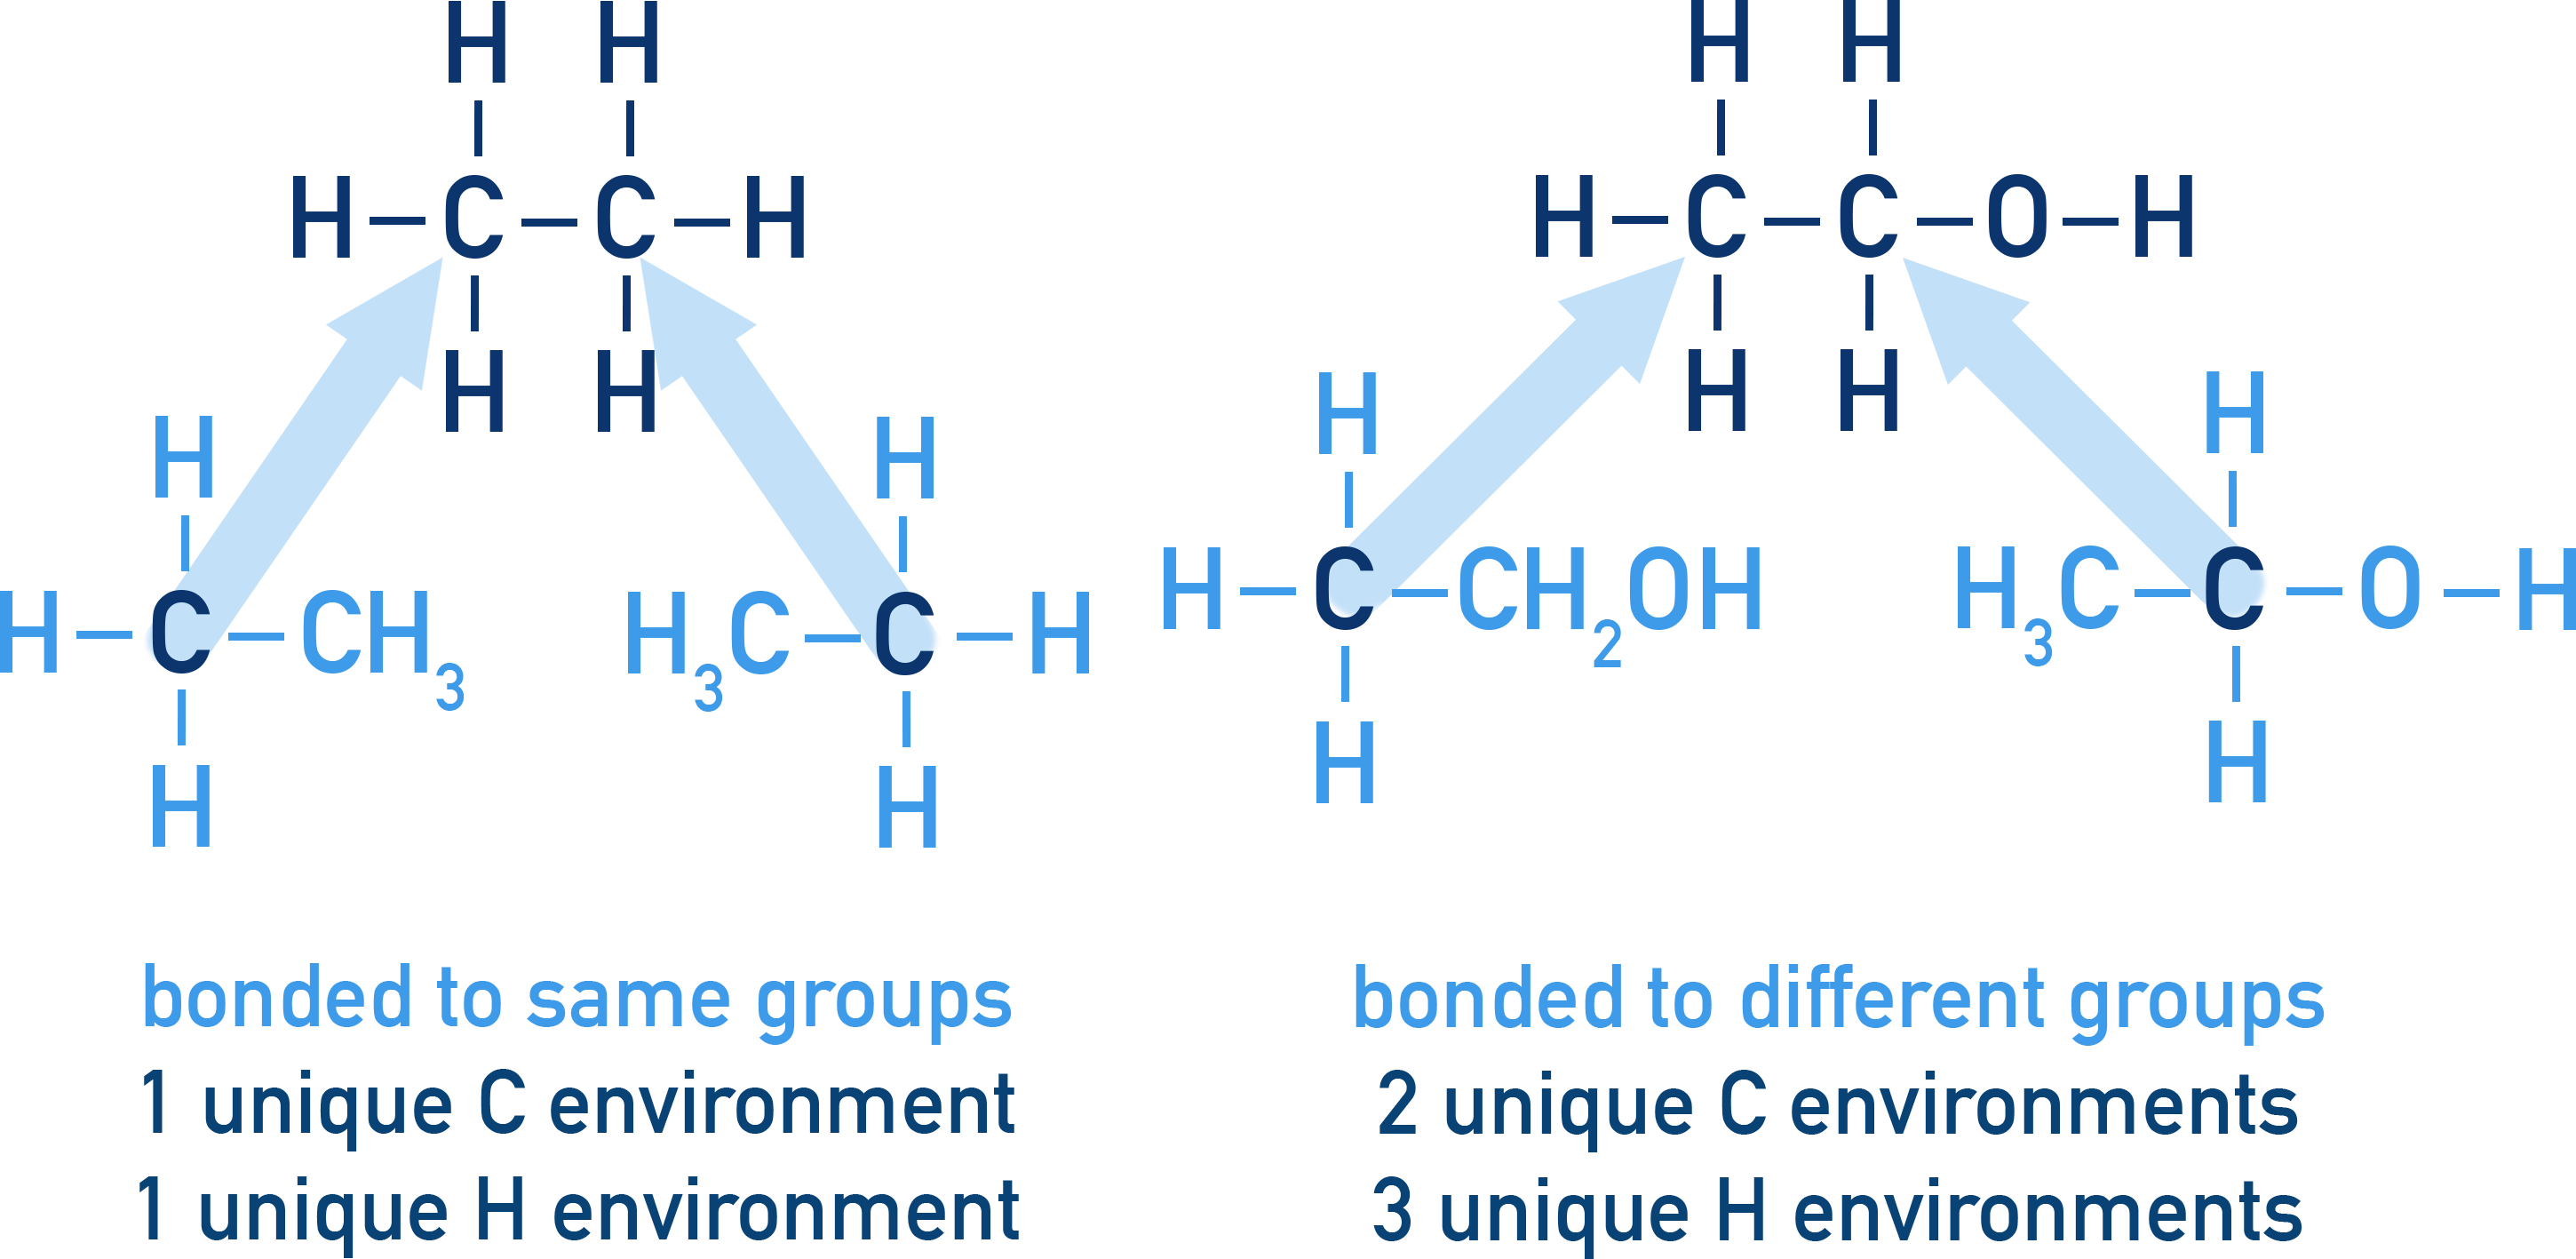
The most important thing in NMR is to recognise ‘unique’ hydrogen environments in a molecule before worrying about advanced details. It isn’t just the immediate atoms bonded to a hydrogen that matter — also check what those atoms are themselves bonded to.
Key Terms and Concepts
| Term | Meaning |
|---|---|
| Chemical shift (δ) | The position of a signal on the spectrum (in ppm) |
| Signal (peak) | Each peak = different chemical environment for H |
| Integration trace | Area under peak = number of equivalent H atoms |
Interpreting a ¹H NMR Spectrum
To deduce a molecule’s structure, look at:
- Number of signals – this tells you how many distinct proton environments exist.
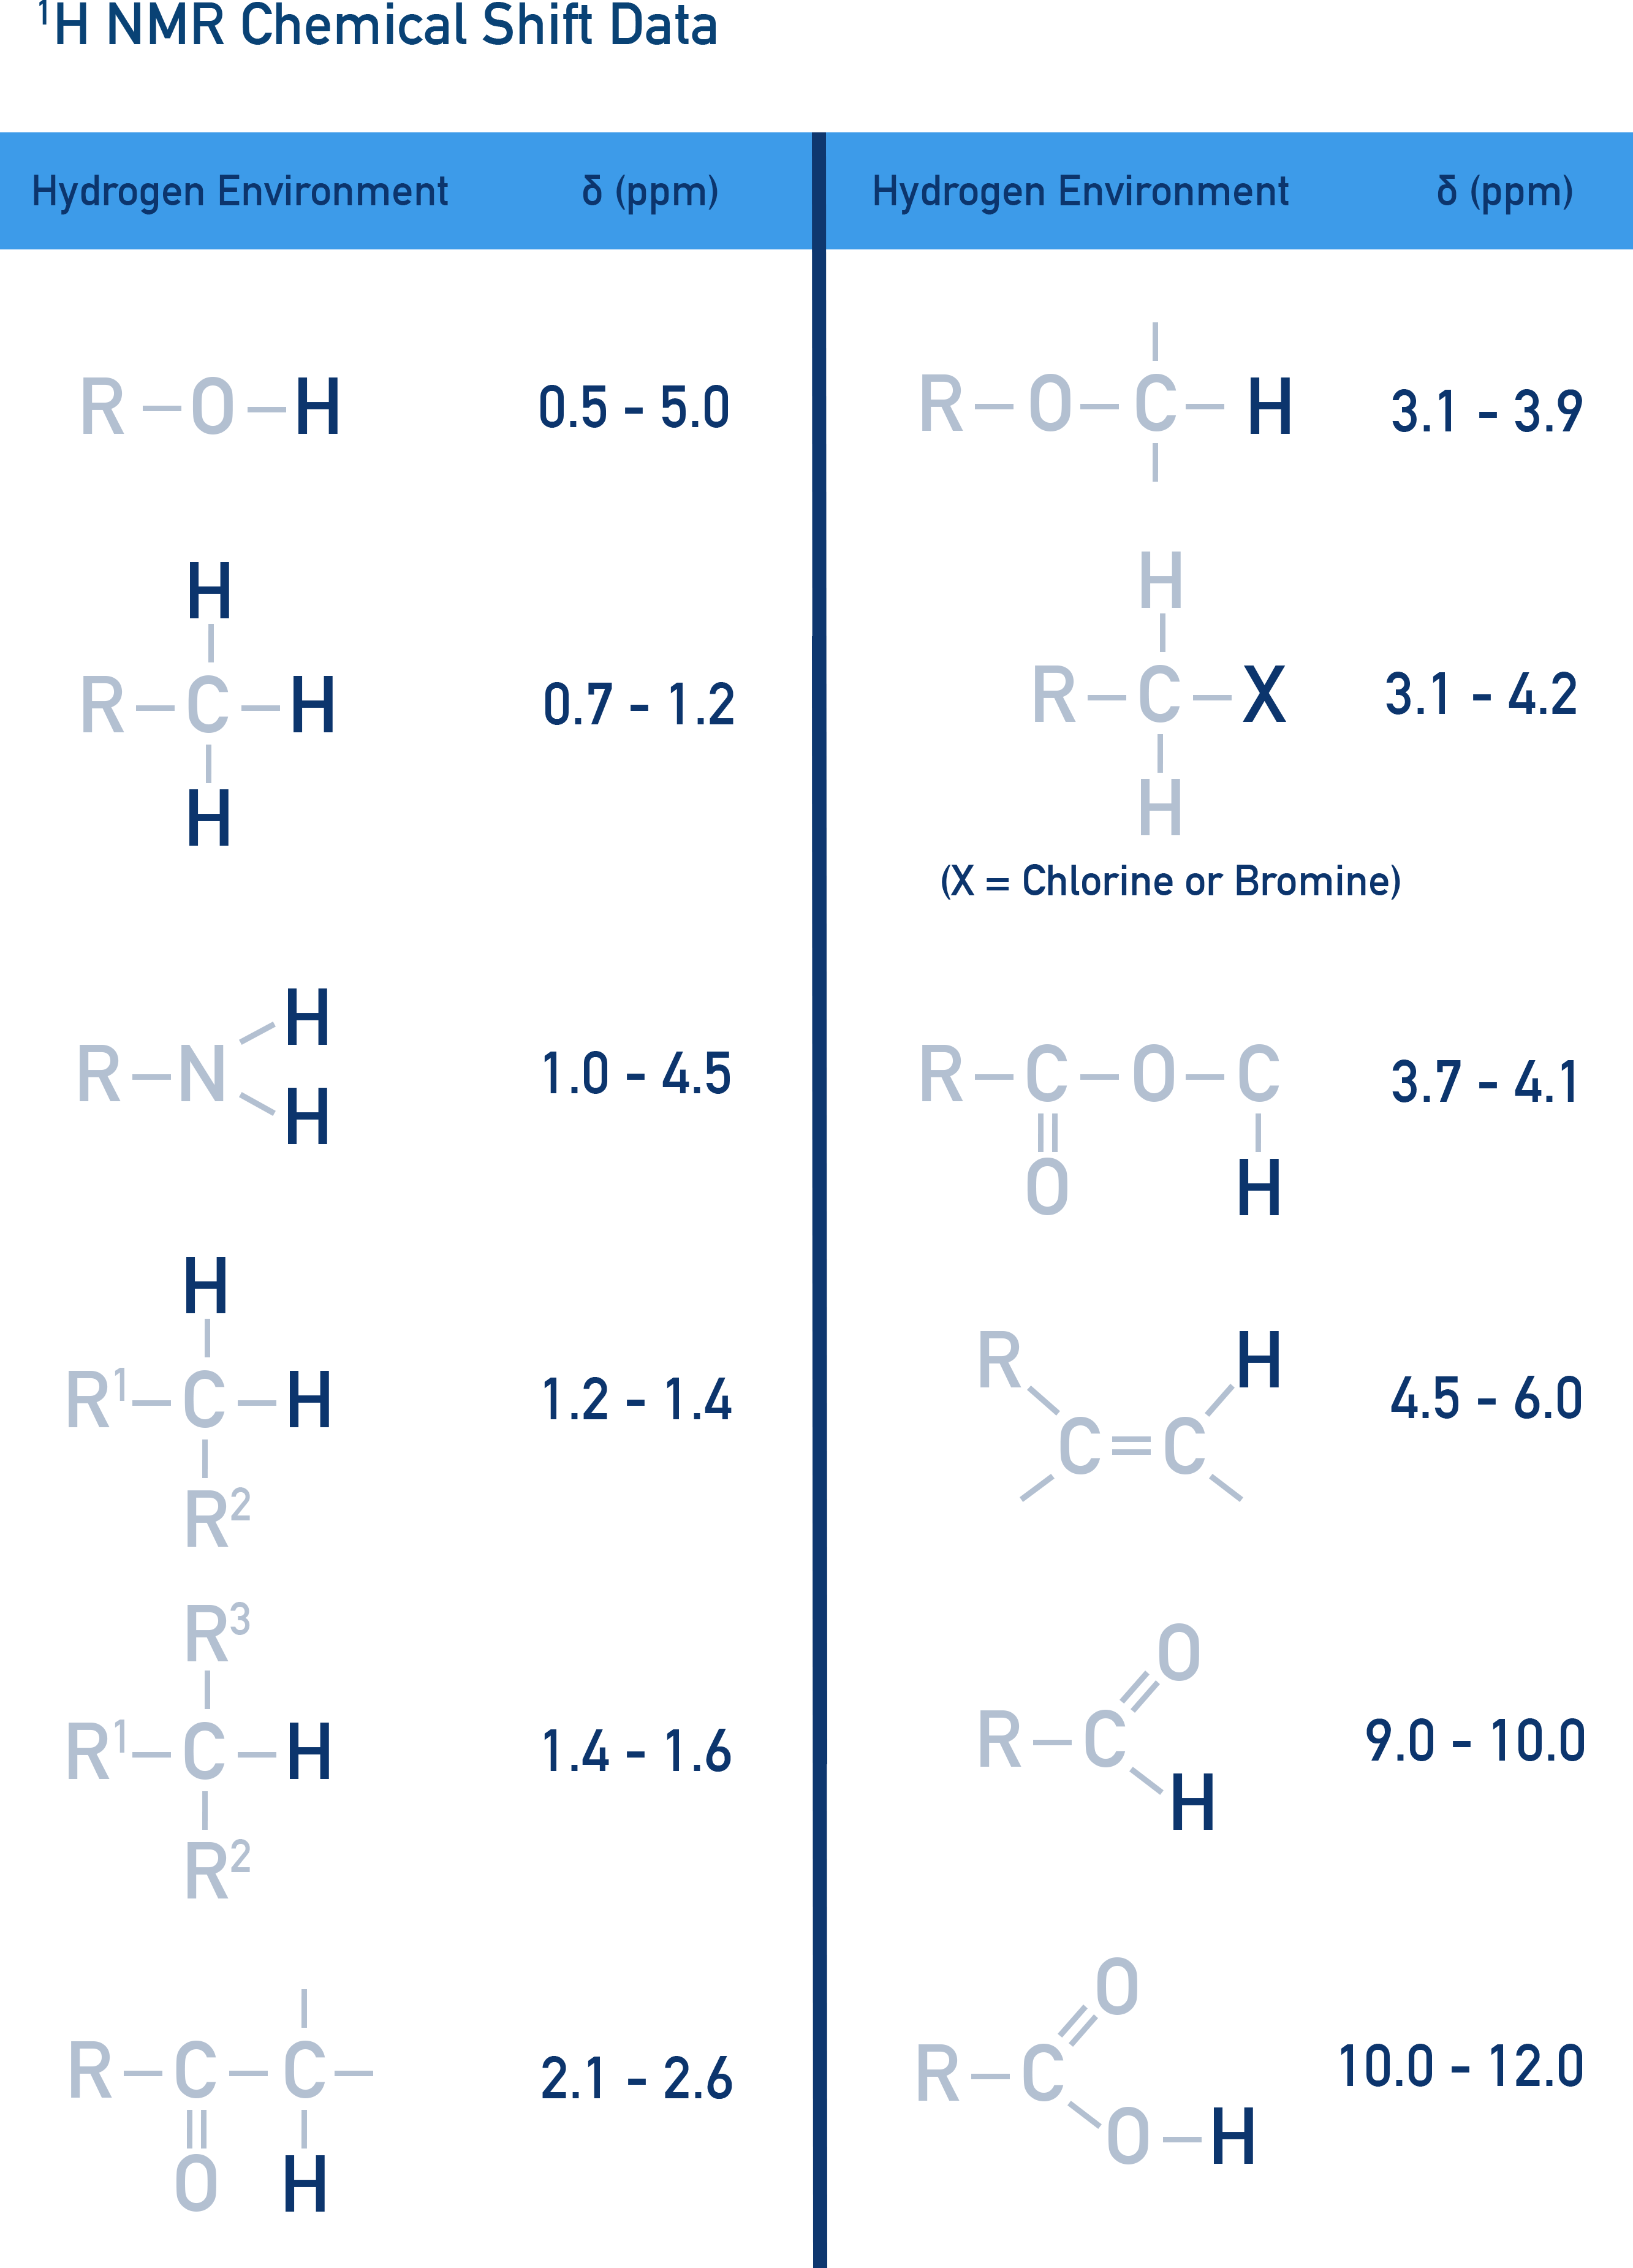
- Chemical shift values – this tells you about the environment of the hydrogens in an environment (depends on electron density, electronegative groups shift peaks downfield (higher δ values)).
- Integration ratios these give relative numbers of protons in each environment.
Data book values are used to compare the peaks on a spectra to identify possible bonding groups within a sample.
¹H NMR Integration
Integration traces (relative peak areas) show the ratio of protons in each unique environment.
Ratios must be linked to the total number of hydrogens in the molecular formula.
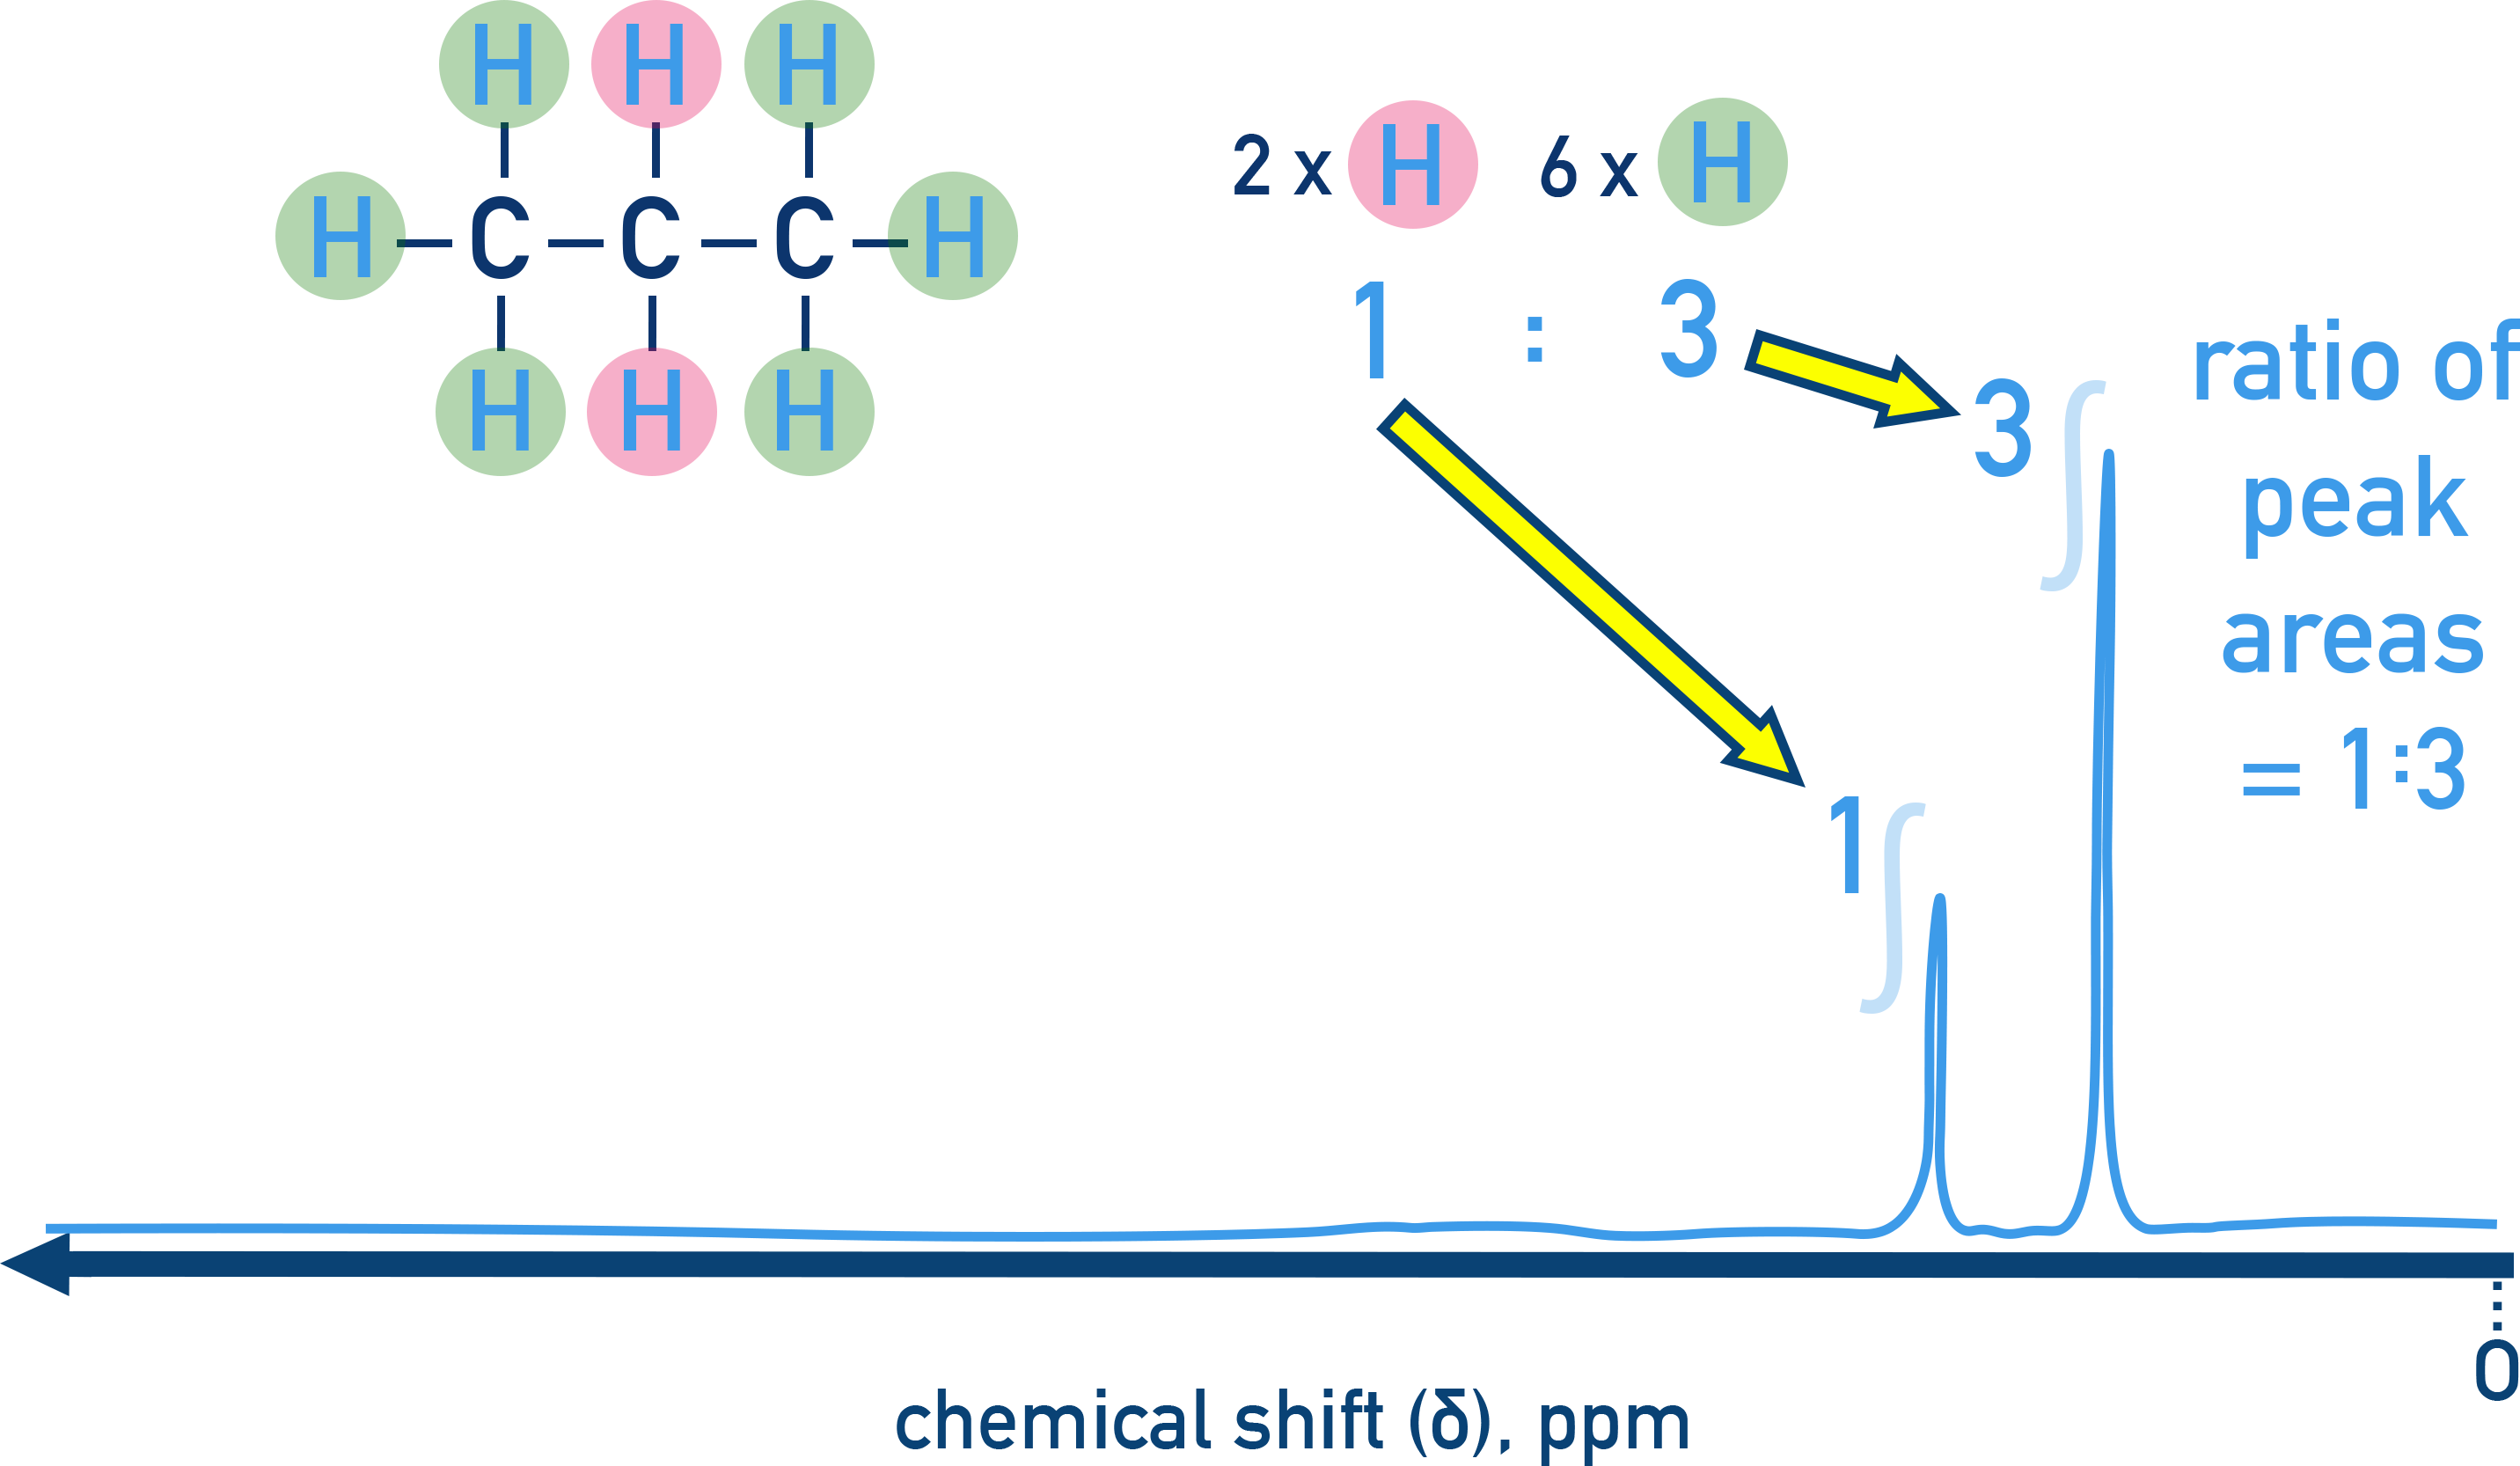
Be really careful: integration ratios aren’t necessarily the actual number of protons in each environment — just the ratio.
For example, the propane spectra above has 2 Hs in one environment and 6 Hs in another. However, the integration ratios on the spectra are 1:3. You then have to look at the molecular formula (C3H8) and link the ratio of Hs to the actual number in each environment. 8 Hs in total with a ratio of 1:3 means 2 Hs in one environment and 6 Hs in the other 🙂
Example Propan-1-ol (CH₃CH₂CH₂OH)
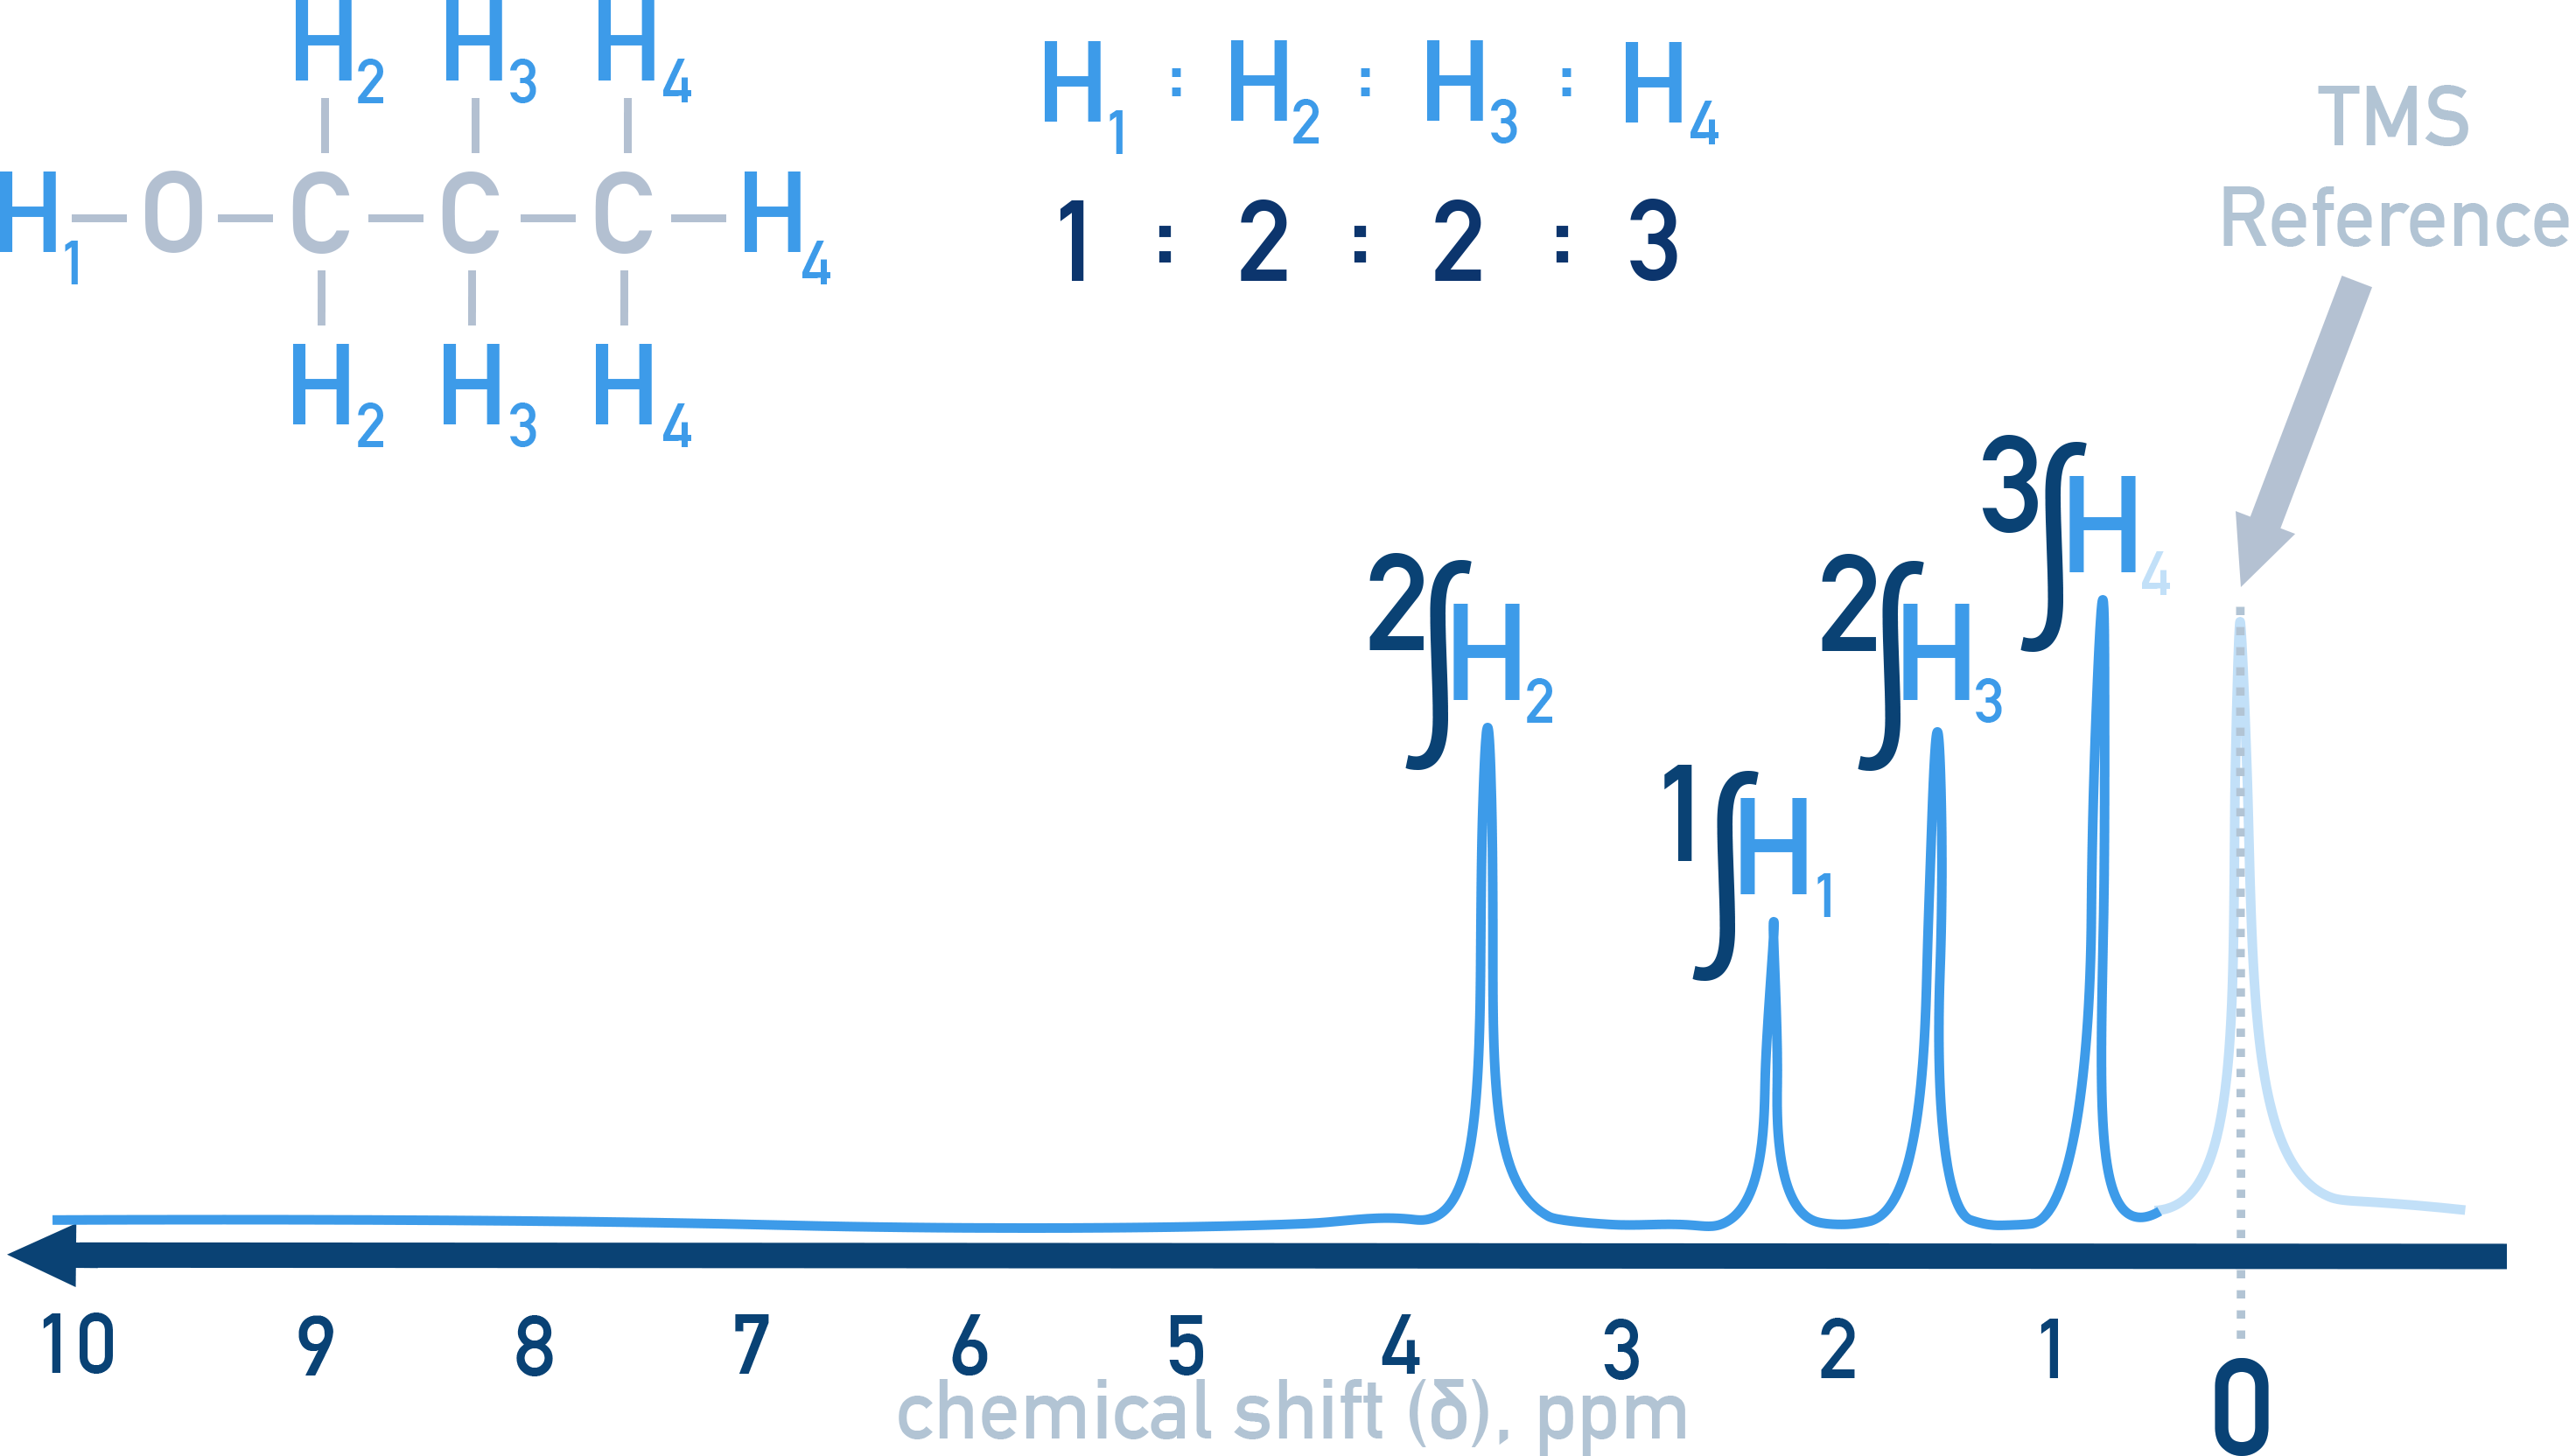
- The spectrum shows four distinct peaks, each corresponding to a unique proton environment in the molecule.
- Peak at ~3.8 ppm (H₂): Two protons on the carbon next to the –OH group (–CH₂–OH) that are deshielded by the electronegative oxygen.
- Peak at ~1.6 ppm (H₁): The single –OH proton.
- Peak at ~1.4 ppm (H₃): Two protons on the middle –CH₂– group that are relatively shielded.
- Peak at ~0.9 ppm (H₄): Three protons from the terminal –CH₃ group
Integration ratio (1:2:2:3) matches the expected hydrogen count.
Summary
- ¹H NMR shows the number of proton environments in a molecule.
- Chemical shifts identify the type of hydrogen environment.
- Integration traces give the relative numbers of protons.
- The IB data booklet provides useful δ ranges for interpretation.
- Splitting patterns are not required for HL IB Chemistry.