
The Hydrogen Emission Spectrum and Energy Levels
Quick Notes:
- The line emission spectrum of hydrogen shows evidence that electrons exist in fixed (quantised) energy levels.
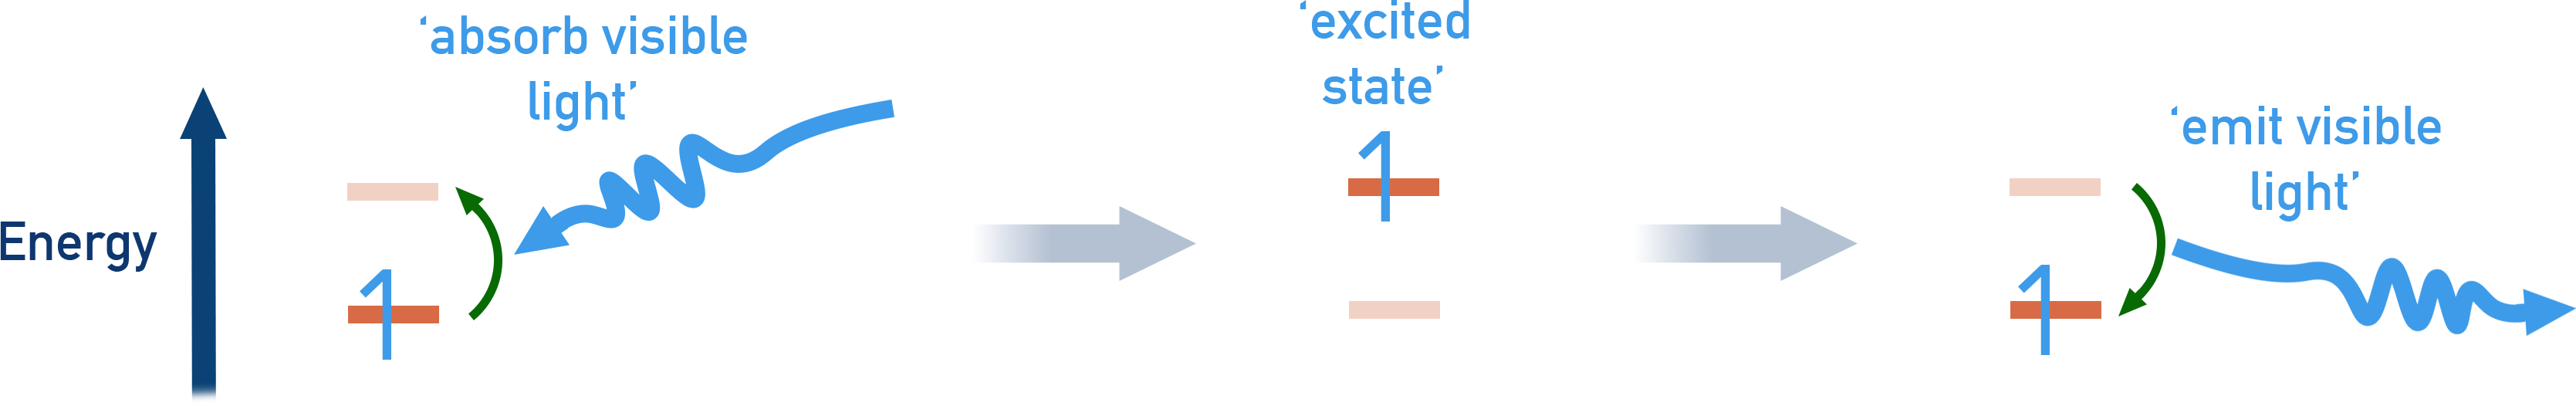
- When an electron in a hydrogen atom falls from a higher to a lower energy level, it emits a photon of light with energy equal to the gap between levels.
- The lines in the spectrum represent specific energy transitions.
- As the energy levels increase, they get closer together – they converge at higher energies.
- Transitions from higher energy levels back to:
- n = 1 produce ultraviolet lines
- n = 2 produce visible light lines
- n = 3 produce infrared lines
- The position and spacing of the lines reflect the structure of the atom and the quantised nature of energy.
Full Notes:
What the Hydrogen Spectrum Tells Us
The hydrogen atom has only one electron, but its emission spectrum gives us lots of information about electronic structure. When this electron is excited to a higher energy level and then falls back down, it emits a photon of light.
Each emission corresponds to a transition between two specific energy levels.
Because energy levels in an atom are quantised, only certain transitions are possible – this produces a line spectrum rather than a continuous one.
Key Features of the Hydrogen Line Spectrum
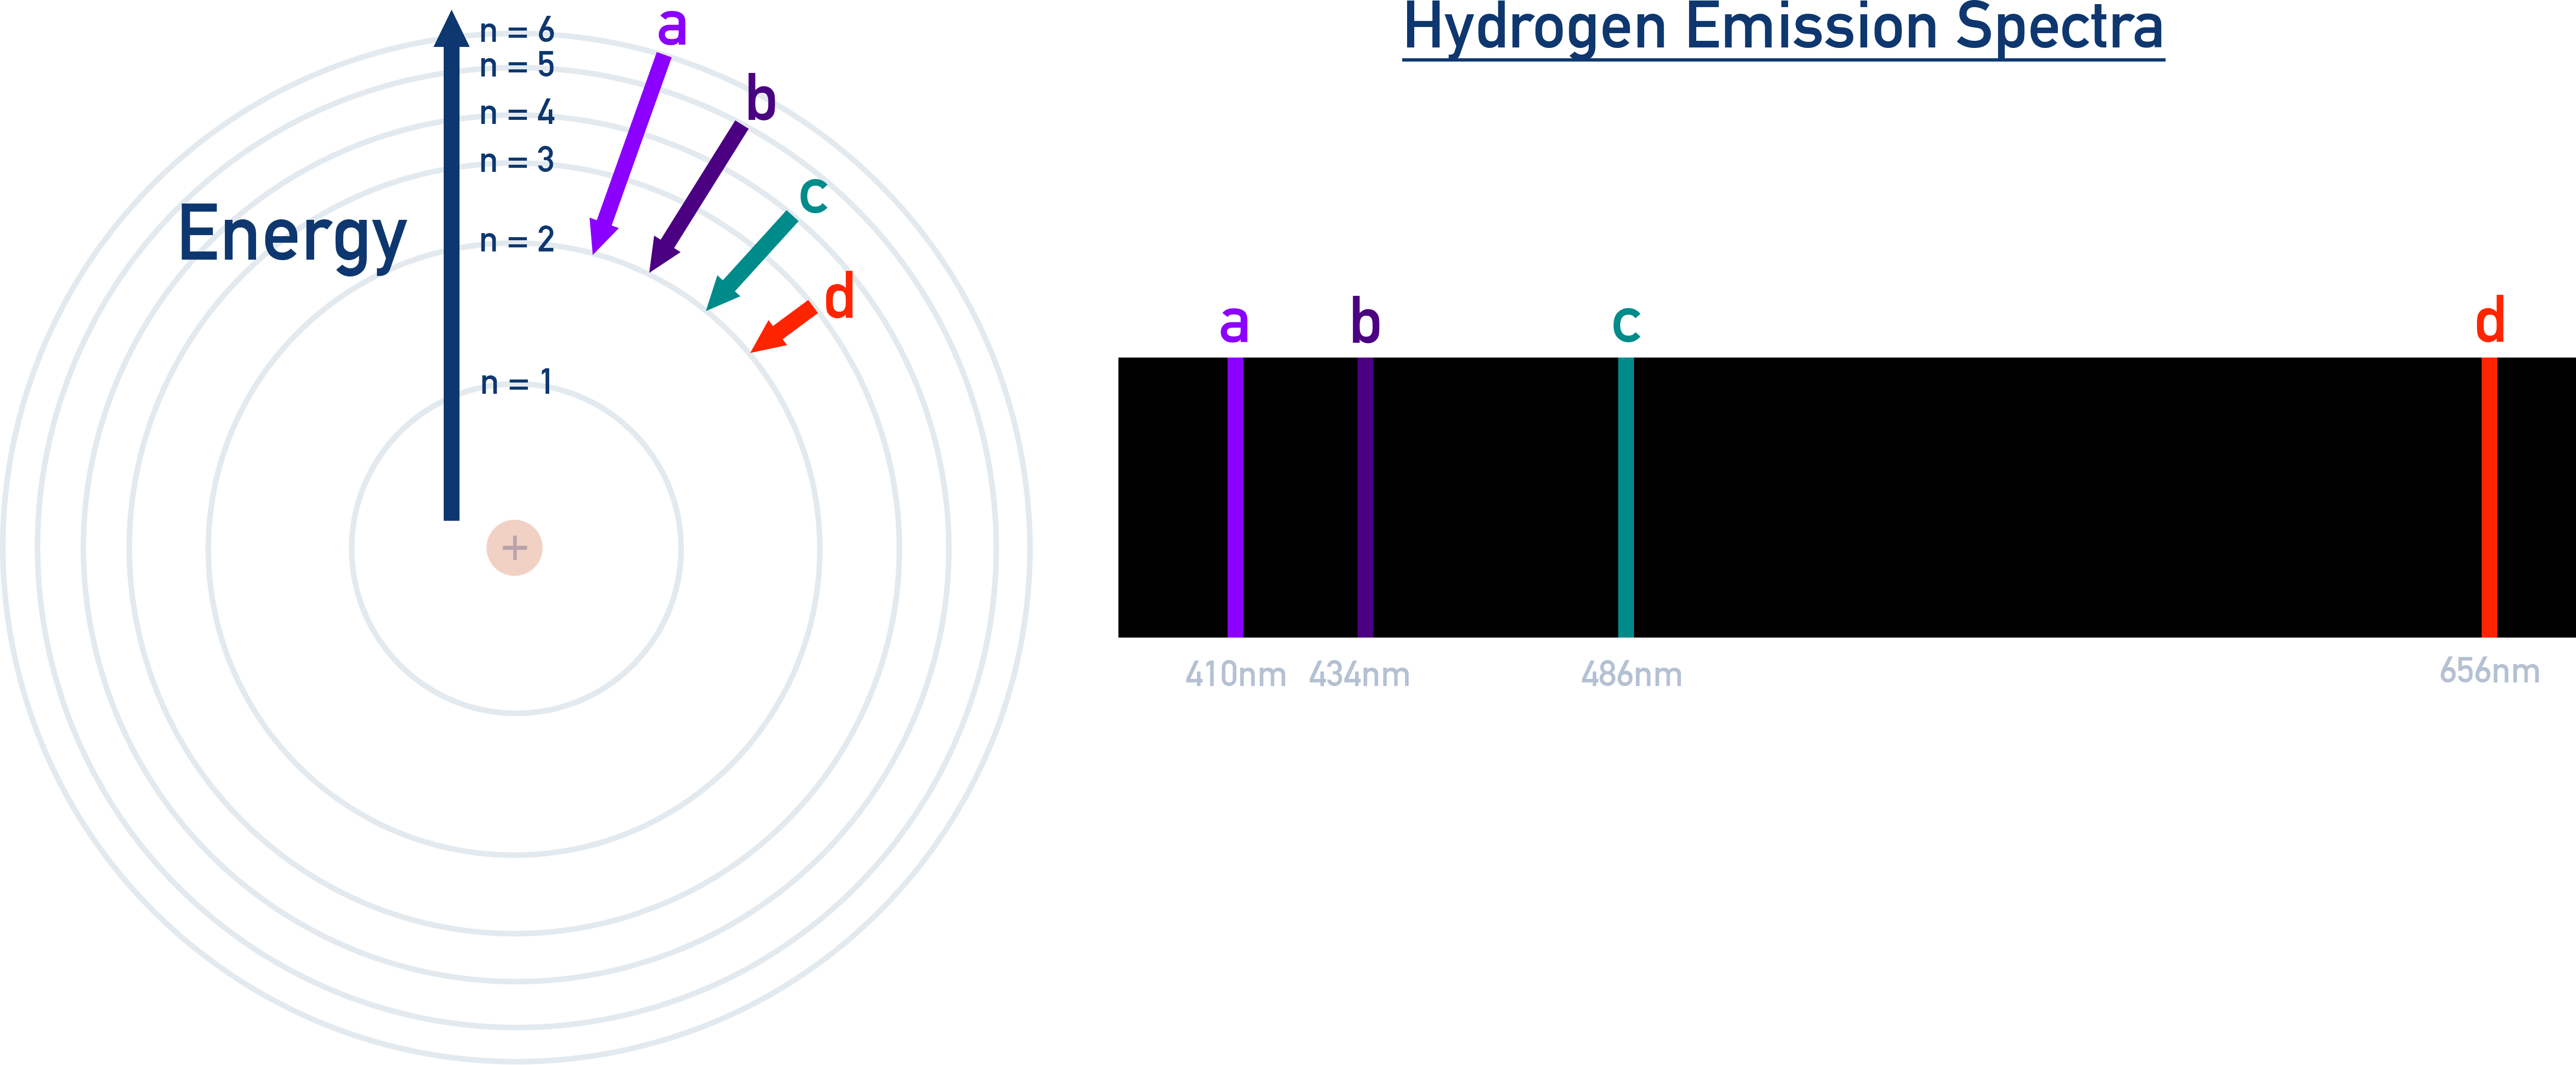
Each line in the emission spectrum corresponds to an electron falling from a higher energy level (n = x) to a lower level (n = y).
- The lines are not evenly spaced – they get closer together at higher energies, as energy levels converge.
- The emitted photon energy corresponds to the difference between the two levels.
- Bigger energy gaps = higher energy photons at shorter wavelengths (e.g., UV).
- Smaller energy gaps = lower energy photons at longer wavelengths (e.g., IR).
Transitions to Specific Energy Levels
You need to understand the relationship between transitions and regions of the electromagnetic spectrum:
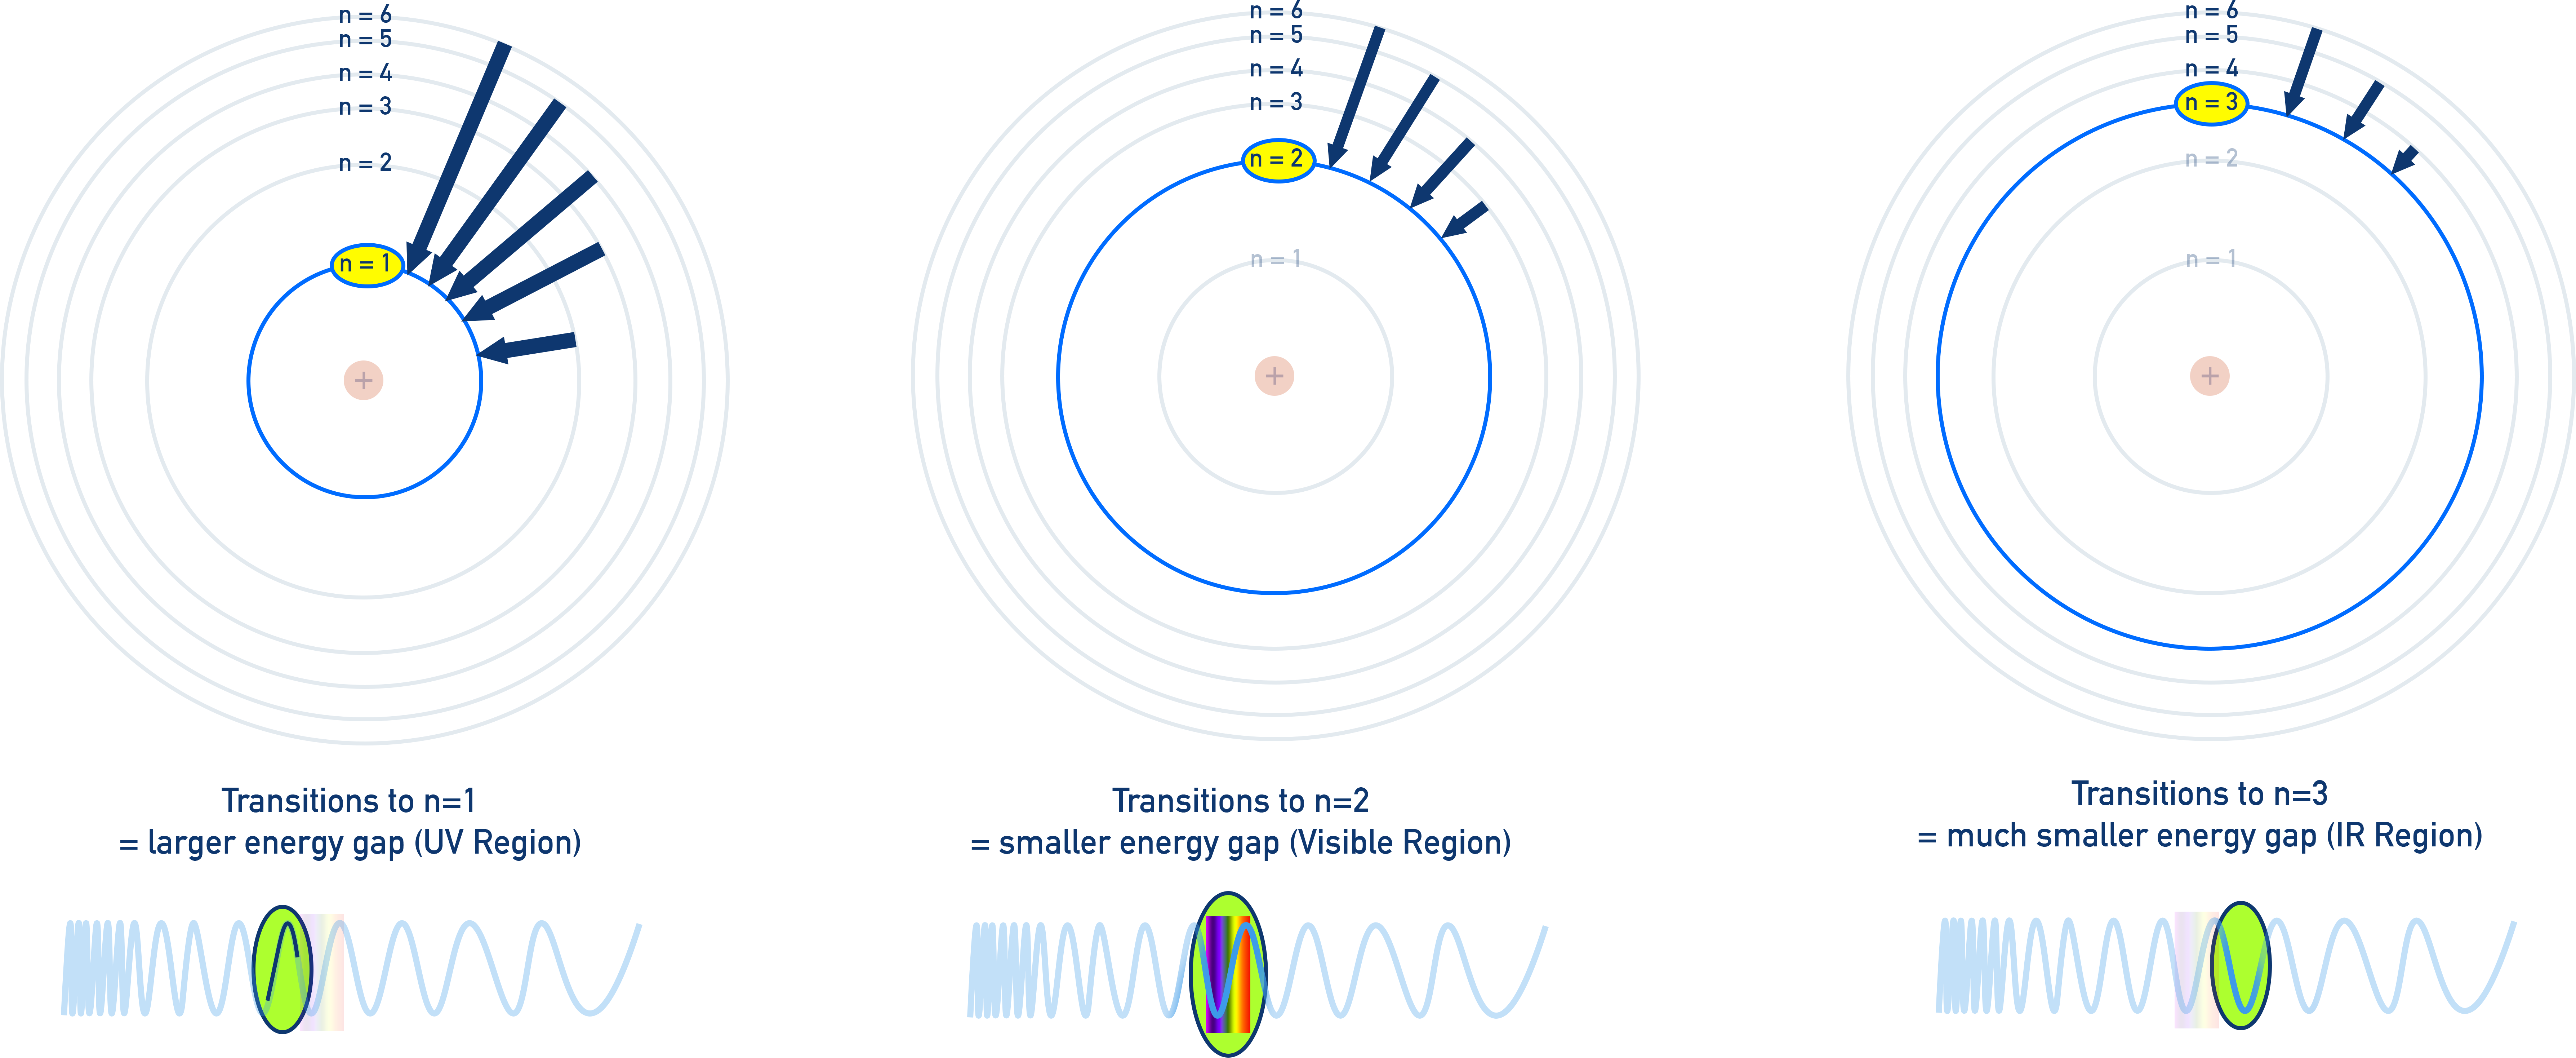
Transitions to n = 1:
Very large energy changes → ultraviolet (UV) lines, higher frequency and energy photons.
Transitions to n = 2:
Medium energy changes → visible region, coloured spectral lines.
Transitions to n = 3:
Smaller energy changes → infrared (IR) region, not visible to the human eye.
You don’t need to memorise the names of these series, but you should understand how the final energy level affects the type of light emitted.
Why This Supports Energy Levels
The hydrogen spectrum shows only specific lines, not a full rainbow.
This is evidence that the hydrogen electron can only occupy specific energy levels – it cannot fall any random amount. The converging pattern at higher energy also shows that the levels get closer together as you move further from the nucleus.
This strongly supports the model of the atom having discrete, quantised energy levels, rather than a continuous range of energies.
Summary
- The hydrogen emission spectrum provides evidence for quantised energy levels in atoms.
- Lines correspond to electron transitions between levels, with energy equal to the gap between them.
- n = 1 transitions → UV, n = 2 → visible, n = 3 → IR.
- Lines converge at higher energies as levels get closer together.
Linked Questions
In the study of emission spectra from gaseous elements and of light, what qualitative and quantitative data can be collected from instruments such as gas discharge tubes and prisms?
Qualitative data include the observation of distinct coloured lines produced when excited atoms emit light — each element gives a unique line pattern or spectrum. Quantitative data can be collected by measuring the precise wavelengths or frequencies of these spectral lines using instruments such as spectrometers or diffraction gratings. From these measurements, the energy of electronic transitions between atomic energy levels can be calculated using the relationship E = hν. Together, these data provide both visual and numerical evidence of electron energy levels within atoms.
How do emission spectra provide evidence for the existence of different elements?
Each element produces a unique emission spectrum because its atoms have distinct sets of electron energy levels. When electrons in an excited atom fall back to lower levels, they emit photons of specific energies corresponding to these differences. The resulting spectral lines act like a fingerprint for that element. The reproducibility of these spectra across experiments provides strong evidence for the existence of discrete energy levels in atoms and allows scientists to identify and distinguish between elements, even in distant stars or gaseous mixtures.